Trends Journal of Sciences Research (2015) 2(3):84-89
http://www.tjsr.org
E-learning Tool for Visualization of Shortest Paths Algorithms Daniela Borissova1 and Ivan Mustakerov1 1
Dept. of Information Processes & Decision Support Systems at the IICT – Bulgarian Academy of Sciences, Sofia, Bulgaria Correspondence: Daniela Borissova (
[email protected])
Abstract. Visualizations of algorithms contribute to improving computer science education. The process of teaching and learning of algorithms is often complex and hard to understand problem. Visualization is a useful technique for learning in any computer science course. In this paper an e-learning tool for shortest paths algorithms visualization is described. The developed e-learning tool allows creating, editing and saving graph structure and visualizes the algorithm steps execution. It is intended to be used as a supplement to face-to-face instruction or as a stand-alone application. The conceptual applicability of the described e-learning tool is illustrated by implementation of Dijkstra algorithm. The preliminary test results provide evidence of the usability of the e-learning tool and its potential to support students’ development of efficient mental models regarding shortest paths algorithms. This elearning tool is intended to integrate different algorithms for shortest path determination.
Keywords: Algorithm visualization, Dijkstra algorithm, e-learning tool, shortest path, software architecture. D. Borissova, I. Mustakerov. E-learning tool for visualization of shortest paths algorithms. Trends
Citation: Journal of Sciences Research. Vol. 2, No. 3, 2015, pp. 84-89.
Introduction The modern information and communication technologies provide means for easily presentation of information in a dynamic form that corresponds to the user preferences. It is recognized as potential for developing of e-learning tools visualizing many topics of mathematics and computer science, and in particular of different algorithms to aid their explanations and understanding. The usability of the e-learning tools is one of the main requirements for successful application of elearning systems[1]. It is pointed out that such systems should be interactive and provide feedback, should be directed to specific goals and to motivate without allowing any factor of nuisance that interrupts the training stream. An important field of mathematical theory is the mathematical study of the structure of abstract relationships between objects by means of graphs (networks). Although investigating of these constructions can be purely theoretical, they can be used to model pairwise relationships in many real world systems. One of most widely using applications is determination of shortest paths in many practical applications as: maps; robot navigation; texture mapping; typesetting in TeX; urban traffic planning; optimal pipelining of VLSI chips; subroutines in advanced algorithms; telemarketer operator scheduling; routing of telecommunications messages; approximating piecewise linear functions; network routing protocols (OSPF, BGP, RIP); exploiting arbitrage opportunities in currency exchange; optimal truck routing through given traffic congestion pattern [2]. Visual aids are widely recognized as amplifiers of the learning capabilities of students facilitating the processing of complex information [3]. Various algorithms can be illustrated through static visualization but trend in computer science education is to make the learning
process more individualized and interactive. Visualizations through interactive algorithms give the students more autonomy in their learning process. Many researchers have attempted to design and develop individualized learning environments based on learning styles [4,5]. Explaining difficult pieces of algorithms code is a challenge in mathematical and computer education. Providing a view of the algorithms inner working details by visualization of algorithm steps aims at making it more understandable [6,7]. Visualizations of work of nets are an effective pedagogical approach. The first significant attempt to assess the pedagogical effects of algorithm visualization was conducted by Hundhausen [8]. Good algorithm visualization brings algorithms to life by graphically representing their various states and animating the transitions between those states. They illustrate data structures in natural, abstract ways instead of focusing on memory addresses and function calls [9]. Simulated visualizations of algorithms have become a popular and effective learning tool and visualization tools are therefore an attractive learning essential for instructors and students alike [10]. Algorithm visualization construction and presentation appear not only to focus students on relevant activities and concepts, but also to enable them to participate more extensively the course, thus contributing to their learning [8]. On the other side, although breaking down the exemplified algorithms into individual steps suits for understanding of their inner workings and is good from a didactic and interactivity point of view there is a drawback. This approach can differ significantly from the "standard" one, potentially resulting in increased complexity and is not to be used for teaching the actual implementation of the algorithms [11]. Technology-enhanced learning area, systems and technology appeared that allow the creation of learning environments by mashing up such small applications [12].
Trends Journal of Sciences Research 2015, 2(3): 84-89
A user requirements study revealed that personal learning environments are not seen as persistent environments, but they should evolve according to the learner’s objectives and achievements [13]. Unlike traditional learning management systems where content and tools are predefined for the learner, personal learning environments are based on soft context boundaries with resources and tools being added at run time [14]. Replacing face-to-face lectures with online activities has the potential to improve learning in terms of a better student performance, higher student satisfaction, and a higher degree of flexibility for the students [15, 16]. In the current paper an e-learning tool for shortest paths algorithms visualization is described. It allows the teachers and student to interact with algorithm work in active way, providing corresponding feedback results. The described e-learning tool is intended to create, visualize and edit different graphs structures and to visualize the shortest paths algorithms execution step by step.
Dijkstra Shortest Path Algorithm One of the key problems in systems modeling by means of graphs is the determination of shortest paths between given nodes on a graph. It is one of the most important basic problems in operations research. It is known that essentially any combinatorial optimization problem can be formulated as a shortest path problem. That is why the class of shortest paths problems can be used to model numerous practical problems that are not really shortest path problems. In many practical applications the computation of the shortest path has to be done in real time. There are a number of shortest path algorithms but there is no clear answer as to which algorithm is the best. Many considerable empirical studies on the performance of shortest path algorithms have been reported in the literature [2,17-23]. There are two basic types of shortest path problems: those which find minimum paths from a given vertex and those which allow the determination of minimum paths between every vertex pair in the graph [24]. The shortest path problems exists both in directed and undirected graphs. Dijkstra’s algorithm solves the single-source shortest path problem while the Bellman-Ford algorithm solves the single-source problem if edge weights may be negative [25]. Floyd-Warshall algorithm solves all pairs shortest paths, Johnson’s algorithm solves all pairs shortest paths too, and may be faster than Floyd-Warshall on sparse graphs. Viterbi algorithm solves the shortest stochastic path problem with an additional probabilistic weight on each node [23]. Nevertheless of results of similar studies the practice shows that the most widely studied and used is the original Dijkstra algorithm. This algorithm is often used in routing and as a subroutine in other graph algorithms. For a given source vertex (node) in the graph, the Dijkstra’s algorithm finds the path with lowest cost (i.e. the shortest path) between that vertex and every other vertex. It can also be used for finding costs of shortest paths from a single vertex to a single destination vertex by stopping the algorithm once the shortest path to the destination vertex has been determined. For example, let the starting node is
85
X and the distance of node Y is the distance from the starting node X to Y. Dijkstra’s algorithm assign some initial distance values and will try to improve them step by step as follows: 1) Assign for every node a tentative distance value. The value for initial node is set to zero and infinity for all other nodes. 2) Mark all nodes unvisited and set the initial node as current. Create a set of the unvisited nodes called the unvisited set consisting of all the nodes. 3) For the current node, consider all of its unvisited neighbors and calculate their tentative distances. Compare the newly calculated tentative distance to the current assigned value and assign the smaller one. 4) If all of the neighbors of the current node are considered, the current node is mark as visited and is remove from the unvisited set. A visited node will never be checked again. 5) In case when the destination node has been marked or if the smallest tentative distance among the nodes in the unvisited set is infinity, then stop, i.e. the algorithm has finished. 6) Choice of unvisited node with the smallest tentative distance, and set it as the new "current node" then go back to step 3. In resume, shortest path algorithms have many practical applications to automatically find directions between physical locations, such as driving directions, urban traffic planning, network routing protocols, subroutine in advanced algorithms, etc. This is why the proposed tool for shortest paths visualization is a subject of e-learning for many students and practitioners.
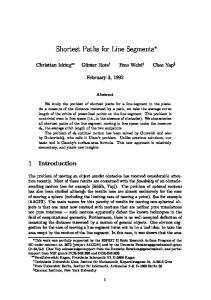
Basic Architecture of the Shortest Path E-learning Tool As is the case with most other teaching areas, there has been a significant gap between the theory and practical understanding of algorithms realization. This is true also for shortest paths algorithms and in particular for Dijkstra algorithm. The main goal of the e-learning tool is to use it from operations research educators and students for teaching and studying the existing known combinatorial graph algorithms. Starting with Dijkstra algorithm other shortest paths algorithms will be implemented gradually as the system evolves. The main idea of the system is to provide an integrated educational environment for both instructors and students to facilitate the learning process in efficient way. The graph e-learning tool is developed as a Java application composed by three main architecture modules as shown in Figure 1. The main module is composed of several functions intended for: loading a data file, saving as data file, export as image file and exit of system. By load function a data file in proper format that contains graph structure data of a previously created by the system graph is loaded. The save function allows the entered data (created graph) to be saved in proper data format.
86
Borissova D and Mustakerov I.:E-learning Tool for Visualization of Shortest Paths Algorithms
Figure 1. Structural scheme of the system
The export function supports the png file-format to export the graph structure as image. The exit function terminates the current session and quits the system. There are two options to support the auxiliary module – option for visualization and help. In the current e-learning tool version, this option consists of one function for changing the text font of the entered text and help text composed of useful information for using the tool. The algorithm module contains the needed function for entering, editing, visualizing and solving of the graph shortest path problem. Edit menu option has several functions for editing and corrections of entered data. Function undo reverts back the last operation repeatedly until that action makes sense. By choosing function node a node can be inserted with automatically numbering it. Function unidirectional edge allows inserting unidirectional edge with automatically positioning the edge on the line connecting both nodes centers with automatically drawing of the ending arrow at the ending node. Bidirectional edge function is the same as for
unidirectional edge with the difference that ending arrows are not drawn. That kind of edges are considered as passed in both directions with equal cost in both directions. When a bidirectional edge with different costs in different directions is needed it is created by inserting two unidirectional edges with same starting and ending node. Selection of function box allows drawing a box with mouse dragging, mainly for some visual aesthetic purposes. Function text can be used to enter some explanatory text within visualization pane. Through function select some graph elements can be selected for subsequent deleting (cutting). That operation is dependable of the graph structure specifics. By function cut selected allows to cut the selected graph elements. All of these functions should influence on the text pane with graph data accordingly the current graph structure
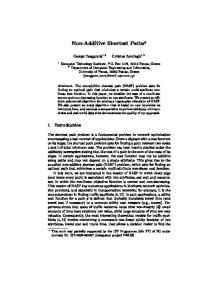
GUI Design and Implementation In education it is important to develop simple graphical user interface and to use visual components that will assist students in gaining an understanding of basic algorithmic concepts and ideas. Other important feature is to enable students to test and “try out” different types of graphs modifications and constructions. The developed GUI main screen is divided into following areas: 1) graphical area for visual processing of the graph; 2) text pane for numerical displaying of the graph structure; 3) status bar for operations and results; 4) menu and buttons toolbars as marked on Figure 2.
Figure 2. Main screen of visual processing of graph data tool
Visualizing graphs is not trivial and involves several theoretical and practical problems. The user-friendly interface allows easily creating and manipulating the
graph elements. Vertices, edges, edges costs, source and destination vertices can be chosen, moved, deleted or inserted. Once the graph is created, each modification in
Trends Journal of Sciences Research 2015, 2(3): 84-89
the graph structure is updated on the screen and data are modified correspondingly. The created in such way graphs can be saved in format of data files for subsequent processing or as pictures in png format for illustration purposes. The graph data are saved in system own data format with filename extension “.grph”. This allows saving and using different graph structures in process of teaching to visualize the algorithm performance. Let us consider an example of directed graph (with onedirectional and bi-directional edges) shown in Figure 2 where the shortest directed path from node 0 to node 7 should be found. It is used to visualize the Dijkstra
87
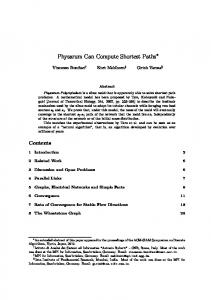
algorithm operation. The main characteristic of the algorithm is partitioning of all nodes into two sets: temporarily and permanently labeled nodes. On each iteration, when the next node is to be scanned the algorithm selects a temporarily labeled node with the minimum distance label. Once a node is scanned, it becomes permanently labeled. The Dijkstra algorithm terminates when all nodes become permanently labeled. The shortest path algorithm execution step by step is graphically visualized as shown by sequence of screens in Figure 3.
Figure 3. Example of Dijkstra shortest path algorithm visualization
The dijkstra() function takes a source vertex and fills in the distance array with shortest path distances from starting node. First, all distances are initialized to infinity, except for starting node distance, which is set to 0, i.e. node 0 is designated as the current node, the state of node 0 is (0, p) and every other node has state (∞, t). Then it is added to the queue and the first vertex is removed and all of its neighbors are scanned. The new distance to neighbors is computed and if it's better than the current known distance it is updated. In such way for each given graph Dijkstra's algorithm discovers the shortest path is a
directed graph. The algorithm characterizes each node by its state. The state of a node consists of two features: distance value and status label. Distance value of a node is a scalar representing an estimate of the its distance from node s. Status label is an attribute specifying whether the distance value of a node is equal to the shortest distance to node s or not. The status label of a node is permanent if its distance value is equal to the shortest distance from nodes. Otherwise, the status label of a node is temporary. The algorithm maintains and step-by-step updates the states of the nodes. At each step one node is designated as current.
88
Borissova D and Mustakerov I.:E-learning Tool for Visualization of Shortest Paths Algorithms
The main idea of the proposed e-learning tool is that once an algorithm is ready, it can be run in many ways like step-by-step or breakpoint mode, so that the user has control over what he has to see to understand algorithm action. Using an interactive animation allows the student to change the input, and step forward and backward through the animation that allows for better understanding. In contrast to Sanchez-Torrubia[26] the developed tool can be used in exercises in computer science to support not feedback to the program code, but by visualizing algorithm action. This approach helps the students themselves in an easy way to get active in order to generate visualizations for their exercise solutions. The practice shows that students are motivated and quite capable in using those types of simple and intuitive visualizing tools and consequently get benefit from using them. This corresponds to one of the primary concerns in on-line educational environments, i.e. to be the effective and to support the learning courseware material acceptance. The described tool is designed by means of Java technology and is oriented to help students on learning different shortest path algorithms topics. Programming in Java was chosen because Java is a crossplatform language and could be run on many platforms without changing the code. The e-learning tool can be used for creating and editing of any kind of directed or undirected graphs up to 999 vertices and with unlimited number of connecting edges with costs (distances or weights). The limitation of number of vertices was chosen because of limitations of the size of computer screen and taking into account the size of most practical problems. That limitation is not restrictive one and the system could be modified to any practical need if such exists.
Learning Effectiveness Results The developed prototype of e-learning tool for visualization of shortest paths algorithms provides visualization of Dijkstra's algorithm. This type of elearning tool is used both for demonstrating algorithms theory ideas and as tool allowing the students to explore theory on their own as well for solving different shortest paths problems. This ability contributes the students to gain a mental model and intuition for advanced algorithms theory concepts. Construction and presentation exercises for algorithms visualization are challenging for the students to participate in more expert ways than usual in the practices of the course they involved. The experimental results demonstrated that the implementation of the proposed approach is quite helpful and facilitate the users’ understanding using such elearning application. The testing showed the practical applicability of the described e-learning tool for visualization of shortest paths algorithms. The simple and intuitive GUI was very well accepted by the students and teachers. The proposed e-learning application allows to facilitate and to personalize individual knowledge and learning preferences for each particular user. It can run the algorithm performance as many times as needed and can stop it on each step. The test of the e-learning application was conducted with students divided into two groups: with using of the developed e-learning application and
without using any tools for algorithms visualizations. The final result showed significant improvement of the first group results compared to the second one. It is observed that benefits of visualization of algorithms in virtual environment can be used as different learning conceptions. Visualization of algorithms can be interpreted as a new technology that suits final learning objectives. Visualization helps to construct knowledge and to organize the perceived information. Learning the algorithms using appropriate learning tools could be conceived of as new capability in continuous improvement of attainment of learning goals..
Conclusion The developed software system could be used also from researchers for fast visual creating of graphs and networks and for solving of implemented combinatorial graph problems. In education it is important to develop simple graphical user interface and to use visual components that will assist students in gaining an understanding of basic algorithmic concepts and ideas. Other important feature is to enable students to test and “try out” different types of graphs modifications and constructions. Graphs and graph algorithms play an important role in computer science engineering education. Algorithmic way of thinking together with programming skills plays a central role in computing education. It means that students typically need to become familiar with a great number of different algorithms and data structures. Following this goal, the preliminary results of developing a prototype for visualization of shortest path algorithms are described in the paper. The described e-learning tool prototype is intended to support both of teachers and students. The implemented techniques for drawing over different graph layouts have been well received by teachers and students. Different shortest path problems can be formulated and explored as future extensions. The prototype developed for testing purposes implements Dijkstra algorithm as a widely used shortest path algorithm. The described elearning tool can be used as a supplement to face-to-face instruction or as a stand-alone tool. The results of early testing of this software are promising.
Acknowledgment The research work reported in the paper is partly supported by the project AComIn “Advanced Computing for Innovation”, grant 316087, funded by the FP7 Capacity Programme (Research Potential of Convergence Regions) and by the project “Innovative optimization methods for decision-making”.
References [1]
[2]
Ardito C., De Marsico, M., Lanzilotti, R., Levialdi, S., Roselli, T., Rossano,V. & Tersigni, M. Usability of E-Learning Tools, Available online at http://tesi.fabio.web.cs.unibo.it/twiki/pub/Tesi/DocumentiRitenuti Utili/p80-ardito.pdf Ahuja R. K., Magnanti, T. L. & Orlin, J. B. (1993). Network Flows: Theory, Algorithms and Applications. Englewood Cliffs, NJ: Prentice Hall.
Trends Journal of Sciences Research 2015, 2(3): 84-89 [3] [4]
[5] [6] [7] [8] [9] [10] [11]
[12]
[13]
[14]
[15]
[16]
[17] [18]
[19] [20] [21] [22] [23] [24] [25]
Akoumianakis D. (2011). Learning as 'Knowing': Towards Retaining and Visualizing Use in Virtual Settings. Educational Technology & Society, 14 (3), 55-68. Ozyurt O., Ozyurt H., Baki A., Guven B. & Karal H. (2012). Evaluation of an adaptive and intelligent educational hypermedia for enhanced individual learning of mathematics: A qualitative study. Expert Systems with Applications, 39(15), 12092-12104. Nguyen V.A. & Yamamoto A. (2012). Learning from graph data by putting graphs on the lattice. Expert Systems with Applications, 39(12), 11172-11182. Karavirta V. (2007). Integrating Algorithm Visualization Systems. Electronic Notes in Theoretical Computer Science, 178(4), pp. 7987. Seppala O. & Karavirta V. (2009). Work in Progress: Automatic Generation of Algorithm Animations for Lecture Slides. Electronic Notes in Theoretical Computer Science, 224, 97-103. Hundhausen C. D., Douglas S. A. & Stasko J. T. (2002). A metastudy of algorithm visualization effectiveness. Journal of Visual Languages and Computing, 13(3), 259-290. Fouh E., Akbar M. & Shaffer C. A. (2012). The Role of Visualization in Computer Science Education. Computers in the Schools, 29(1-2), 95-117. Roles J.A. & ElAarag H. (2013). A Smoothest Path algorithm and its visualization tool. Southeastcon, In Proc. of IEEE, DOI: 10.1109/SECON.2013.6567453. Paramythis A., Loidl S., Mühlbacher J. R., & Sonntag M. (2005). A Framework for Uniformly Visualizing and Interacting with Algorithms. In Montgomerie, T.C., & Parker E-Learning, J.R. (Eds.), In Proc. IASTED Conf. on Education and Technology (ICET 2005), Calgary, Alberta, Canada, 2-6 July 2005, pp. 28- 33. Nussbaumer A., Dahrendorf D., Schmitz H.-Ch., Kravcik M., Berthold M. & Albert D. (2014). Recommender and Guidance Strategies for Creating Personal Mashup Learning Environments. Computer Science and Information Systems, 11(1), 321-342. Gillet D., Law E.L.C. & Chatterjee A. (2010). Personal Learning Environments in a Global Higher. Engineering Education Web 2.0 Realm. In Proc. of IEEE EDUCON 2010 Conference. pp. 897906. Wilson S., Liber P.O., Johnson M., Beauvoir P. & Sharples P. (2007). Personal Learning Environments: Challenging the Dominant Design of Educational Systems. Journal of e-Learning and Knowledge Society, 3(2), pp. 27-28. Godsk M. (2014). Improving Learning in a Traditional, LargeScale Science Module with a Simple and Efficient Learning Design. European Journal of Open, Distance and e-Learning, 17(2), 142-158. Guliashki V., Genova K. & Kirilov L. (2013). The Decision Support System WebOptim in an E-Learning Context. In: Proc. of International Conference "Automatics and Informatics'2013", 2013, pp. I-117-I-120. Dijkstra, E. W. (1959). A Note on Two Problems in Connection with Graphs. Numeriche Mathematik, 1, 269-271. Dial R., Glover F., Karney D. & Klingman D. (1979). A Computational Analysis of Alternative Algorithms and Labeling Techniques for Finding Shortest Path Trees. Networks, 9(3), 215248. Glover F., Klingman D. & Phillips N. (1985). A New Polynomially Bounded Shortest Paths Algorithm. Operations Research, 33(1), (pp. 65-73). Gallo G. & Pallottino S. (1988). Shortest Paths Algorithms. Annals of Operations Research, 13(1), 73-79. Hung M. H. & Dovoky J. J. (1988). A Computational Study of Efficient Shortest Path Algorithms.Computers & Operations Research, 15(6), 567-576. Mondou J-F, Crainic T. G. & Nguyen S. (1991). Shortest Path Algorithms: A Computational Study with the C Programming Language. Computers & Operations Research, 18(8), 767-786. Cherkassky B. V., Goldberg A. V. & Radzik T. (1996). Shortest Paths Algorithms: Theory and Experimental Evaluation. Mathematical Programming, Ser. A73(2), 129-174. Silveira D.S., Melo V.A. & Boaventura Netto. P. O. (2009). AlgoDeGrafos: An Application to Assist in Course Lectures on Graph Theory. CLEI Electronic Journal, 12(1), paper 2. Goldberg A. V. & Radzik T. (1993). A Heuristic Improvement of the Bellman-Ford Algorithm. Applied Mathematics Letter, 6(3), 3-6.
89
[26] Sánchez-Torrubia M.G., Torres-Blanc C. & López-Martínez M. A. (2009). PathFinder: A Visualization eMathTeacher for Actively Learning Dijkstra’s Algorithm. Electronic Notes in Theoretical Computer Science, 224, pp. 151-158.