Eclipse Guard: Relative Debugging in the Eclipse Framework David Abramson, Tim Ho, Clement Chu and Wojtek Goscinski School of Computer Science and Software Engineering, Monash University, Clayton, VIC 3800, AUSTRALIA
Abstract
ing identify the point at which the internal state of the two codes diverge.
This paper describes an implementation of relative debugging under the Eclipse framework. The paper describes what relative debugging is and how it helps test and debug evolved applications. We give a brief overview of the architecture of Eclipse and show how our relative debugger, Guard, has been integrated into that environment.
Relative debugging is a powerful technique for refining a region where a program first produces incorrect results. A programmer does this by following the uses of key variables back to their definition points, in an attempt to isolate the region of code in error. In this paper we describe an implementation of relative debugging in ht e IBM Eclipse environment. Eclipse is a powerful interactive development environment (IDE) that supports multiple languages on multiple platforms. It is built using Java, and, importantly, it facilitates the integration of third party tools. In fact, almo st everything is regarded as an add-in. Our integrated relative debugger, called Eclipse Guard, allows a user to test and debug mu ltiple program versions within Eclipse. The source for both programs can be displayed simultaneously, facilitating side by sid e comparison of the programs . The user interacts with the debugger using add-in menu commands and mouse operations which are an integral part of the IDE. The power of this implementation is that a user need only learn a few extra commands over the ones normally used to compile and debug code, in order to perform relative debugging.
1 Introduction It is not uncommon to have multiple versions of a program – one that “works” and one that is “broken”. A new version may not work correctly because the programmer changed some code. These errors can often be quite subtle, because a change in one place may have an effect somewhere completely removed. Alternatively, something may have changed in the environment. For example, the operating system or compilers may have been upgraded, and exa ctly the same source code may produce different results. Finally, the program may work correctly on one platform, but fail on another. This could occur because of differences in the hardware, compilers, operating systems or any number of differences between the two platforms. Finding such bugs can be tedious and error prone.
2 Relative Debugging
Relative Debugging is a technique in which it is possible to compare the internal state of two exe cuting programs [1][2][3]. It is an amalgam of test and debug methodologies. It enables a user to test whether two programs perform the same task by comparing the output of the two programs given the same input. However, it goes beyond traditional test tools by facilitating the comparison of arbitrary data structures at arbitrary times in the execution of the two codes. Thus, it supports debugging of a new version of the program by help-
Assertions are the key construct used by a relative debugger. An assertion defines the names of two data structures that are to be compared in each code, and the locations in the two programs at which comparisons are to occur. It can also contain qualifiers that uniquely define the source line (like the source file name) and various trigger controls that describe when the assertion will “fire”. An assertion only fires when it has both operands, and
1
thus the core execution mechanism in a relative debugger is a dataflow interpreter [4].
active user interface tool for building assertions. This tool fits well with the interactive nature of Visual Studio. VSGuard is available as a commercial release from GuardSoft [7].
Assertions are actually implemented in a relative debugger by placing breakpoints at the required lines in the two codes . When the breakpoints are “hit”, an event is sent into the dataflow engine. The required data structure is read from the process, and if both operands are available, the comparison is performed. If, however, only one operand is available, it is stored in a special “node store” until the other half of the assertions data is available. This architecture is flexible enough to handle operands arriving at different times and in any order.
Guard Lite is a command line parallel debugger, without relative debugging [8]. It supports the High Performance Debugger Forum (HPDF) command syntax and works on a range of parallel machines. Guard Lite runs on the Linux operating system. In this paper we discuss Eclipse Guard. Eclipse Guard is a version of Guard integrated into the IBM Eclipse platform. Eclipse Guard leverages the flexibility and extensibility of Eclipse. It currently works with Java and C/C++, however, this will be extended as new language plug-ins are produced. Eclipse Guard currently runs on both Linux and Windows.
Over the past 10 years we have developed a number of different implementations of relative debugging, in a generic family of tools called Guard. Our earliest implementation of relative debugging is embodied in a version called Classic Guard. This version has been implemented in most Unix machines, and is command line driven. It has a client server architecture, and uses GDB as the portable debug server implementation. Assertions in Classic Guard are specified using a simple command syntax shown below:
3 Eclipse Eclipse is a universal tool platform written in Java. Similar to VS.NET, it allows tool developers to extend or add functionality. In contrast to VS.NET, which only runs on Windows, it runs on any system that supports the Java Virtual Machine (JVM).
assert P1::var1:line1 = P2::var2:line2
The platform has been designed to meet seven major requirements, namely [9]:
where var1 and var2 are names of data structures in each program P1 and P2 respectively, and line1 and line2 are line numbers in the two codes.
1)
Classic Guard supports both sequential and parallel relative debugging, and has novel features for describing the data decomposition in parallel codes. It supports a range of conventional programming languages, like C, C++, Fortran, etc, and also a data parallel research language called ZPL [5]. Classic Guard currently runs on a range of operating systems including Solaris, Linux and AIX.
2)
VSGuard is an implementation of relative debugging for the Microsoft Visual Studio .NET environment [6]. VSGuard leverages the .NET Frame work, and the Visual Studio Industry Partner (VSIP) Program. It supports all .NET Framework languages, and also legacy Microsoft languages like Visual Basic 6.0 and Visual C++. VSGuard runs only on the Windows operating system. Unlike Classic Guard, VSGuard provides an inter-
6)
3) 4)
5)
7)
To allow different tools to be built for application development; To allow any tool developer to develop tools for the platform; To allow tools to manipulate different content types such as HTML, Java and XML; To provide support for tool integration within and across different content types and tool developers; To support GUI and non-GUI application development; To run on multiple operating systems such as Windows and Linux and To use Java as the language for tool development.
The platform has an open architecture and employs a well-defined extension mechanism to allow tight tool integration based on a plug-in model. This platform has a well-designed structure so that any
2
s ignificant changes made to it would have little impact to other installed plug-ins. Plug-in developers can benefit from this architecture because complex tool integration is managed by the platform.
Controlling the Debugger. Reuse of original components of Classic Guard was a strong design goal. Guard’s core relative debugging functionality is encapsulated within a module called the “Guard Interpreter”. Therefore it was necessary to design a Guard Plug-in which provided the functionality required by the Guard Interpreter. This includes adding breakpoints, deleting breakpoints, notifying breakpoint events , retrieving values from the suspended Java threads as well as resuming the suspended Java threads .
Eclipse is structured as a number of co mponents that are implemented in one or more plug-ins. Apart from adding features to the platform, each of these plug-ins also defines its own extension points and APIs so that other plug-ins can extend or contribute functionality to the platform. Some of them also provide additional API libraries that can be used for implementing extensions, such as the JFace UI Framework and the SWT widget toolkit provided by the workbench UI plug-in. The platform runtime uses the same extension mechanism to contribute functionality with the components. In fact, plug-ins must follow this mechanism to add functionality.
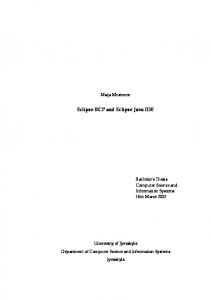
4.2 Implementation As shown in Figure 1, the architecture of Eclipse Guard is divided into two main components. The first of these is the Eclipse environment, co mplete with a Guard plug-in. The other is Guard, which provides the relative debugging functionality. This two part architecture allowed us to integrate Guard into the Eclipse environment by reusing the relative debugging functionality within original Guard components .
A plug-in is the most basic extension through which all Eclipse functionality must be defined and is written in Java. Depending on the comple xity, a feature may require one or more plug-ins. A plug-in usually consists of JAR libraries, images, native code libra ries, etc.
Eclipse
JAVA PROCESS
DEBUG SESSION
DEBUG MANAGER
DEBUG SESSION
GUARD GUARD PLUGIN PLUGIN
4 Eclipse Guard JAVA PROCESS
4.1 Design Decisions There are a number of design goals that were defined and later implemented to successfully integrate Guard into Eclipse. These include the following:
Guard
C++ C++ WRAPPER WRAPPER
Controlling Guard. Controlling Eclipse Guard should be as easy as controlling the standard debugger. Accordingly, Eclipse Guard was designed to leverage a user’s knowledge of standard debugging techniques and the interfaces already provided by Eclipse.
GENERIC GENERIC GUARD GUARD
JNI
GUARD GUARD CONTROLLER CONTROLLER
GUARD INTERPRETER
Figure 1 – Eclipse Guard Structure
Defining Assertions and Displaying Results. Adding assertions is one of the most frequent activities in relative debugging, therefore a simple mechanism is required for defining and maintaining assertions. Likewise, good reporting of assertion results is required to aid the debugging process.
The Eclipse plug-in is responsible for the graphical user interface and essential eclipse integration such as debugger control, setting breakpoints, receiving breakpoint events and expression evaluation. The Java Development Tooling (JDT) is the group of Eclipse plug-ins which supports Java development. The default implementation of the JDT does
3
not support running two Java classes which is required for relative debugging. Consequently it was necessary to design an extension to the default launching facility in order to allow the execution of multiple classes simultaneously. In addition, it was necessary to ensure that the JDT debugger could handle more than one class at the same time. This required multiple threads to avoid blocking one process when the other is suspended.
same way, and when this is completed an assertion is created, as shown in Figure 4. Comparison results are displayed when both halves of an assertion have been hit. Figure 5 shows the output of the results of one assertion, in which the data items are simple scalars and in this case are equivalent up until the seventh time the assertion is hit.
Most significantly Guard contains the Guard Interpreter, which is responsible for controlling the relative debugging process through a dataflow interpreter. Much of the code in the Guard interpreter is shared across the different versions of Guard and has been written to support Guard integration into any extensible IDE. The Guard plug-in is written in Java, and calls the Java Guard Controller, which in turn uses JNI to invoke the IDE-generic components which are written in C++. JNI is also used to facilitate calls out of the Guard interpreter to the Eclipse plug-in, such as those required to place breakpoints, perform expression evaluation, etc.
Figure 3 – Creating an assertion interactively.
Figure 2 shows a screen picture of Eclipse Guard. This screen clearly shows the two source windows that are visible – one for each version of the program under consideration.
Figure 4 – Complete Assertions.
5 Conclusions In this paper we have briefly described relative debugging and how it is integrated into the Eclipse framework. Unfortunately there is insufficient space to provide too many details of the implementation, although further details are available in [10]. At this stage we have tested Eclipse Guard on a range of Java programs, and recently also managed to use Eclipse Guard to debug C and C++ using the appropriate plug-ins. We plan to release an initial implementation of Eclipse Guard in the near future. There are many possible enhancements to the current prototype that would make it more powerful. First, we would like to support both local and remote debugging as seamlessly as possible. Second, we plan to integrate Eclipse Guard with a source code control system like CVS. Such integration would facilitate regression testing as a program evolves. Third, we would like to extend the execution mechanism to support debugging mult iple versions web services. Such functionality would
Figure 2 – Main screen of Eclipse Guard. Assertions are added interactively by selecting a statement in one program, and right clicking on the variable under consideration. This will cause the Eclipse Guard plug-in to extract the line number, the variable name and the project id, and it will add these to an assertion window shown in Figure 3. The other variable and project is added in the
4
extend the scope for Eclipse Guard significantly, and would enhance other Eclipse plug-ins like IBM Web Sphere. Finally, we would like to expand the range of visualizations for data differences. At present in Eclipse it is only possible to display simple text even for complex data stru ctures. However, we have had significant experiment with using scientific visualization packages to display complex variations in data [11][12] and it would be possible to integrate these into Eclipse Guard quite easily.
References [1] Abramson, D.A. and Sosic, R. "A Debugging and Testing Tool for Supporting Soft ware Evolution", Journal of Automated Soft ware Engineering, 3 (1996), pp 369 – 390. [2] Abramson D., Foster, I., Michalakes, J. and Sosic R., "Relative Debugging and its Application to the Development of Large Numerical Models", Proceedings of IEEE Supercomputing 1995, San Diego, December 95. [3] Sosic, R. and Abramson, D. A. "Guard: A Relative Debugger", Software Practice and Experience, Vol 27(2), pp 185 – 206 (Feb 1997. [4] Abramson, D.A., Sosic, R. and Watson, G. ”Implementation Techniques for a Para llel Relative Debugger”, International Conference on Parallel Architectures and Compilation Techniques - PACT '96, October 20-23, 1996, Boston, Massachusetts, [5] Lin, C. and Snyder, L., “ZPL: An Array Sublanguage,” Languages and Compilers for Parallel Computing, 6th Int’l Workshop Proc., Springer-Verlag, Berlin, 1994, pp. 96–114. [6] Meyer, B. “.NET is coming”, IEEE Computer, Vol. 34, No. 8; AUGUST 2001, pp. 92-97. [7] www.guardsoft.com [8] http://sourceforge.net/projects/guardsoft [9] Eclipse Platform Technical Overview, http://www.eclipse.org/whitepapers/eclipseoverview. pdf, Object Technology International (OTI). [10] Ho, Tim. “A Relative Debugger for Eclipse”, Bachelor of Computing Honours Thesis, School of Computer Science and Software Engineering, Monash University, Australia, 2002. [11] Abramson D., Foster, I., Michalakes, J. and Sosic R., "Relative Debugging: A new paradigm for debugging scientific applications", the Communications of the Association for Computing Machinery (CACM), Vol 39, No 11, pp 67 - 77, Nov 1996. [12] Abramson, D., Finkel, R., Kurniawan, D., Kowalenko, V. and Watson, G. “Parallel Relative Debugging with Dynamic Data Structures”, 16th International Conference on Parallel and Distributed Computing Systems, August 13 - 15, 2003 Reno, Nevada, USA.
Figure 5 – Screen display of assertion results
Acknowledgements This project has been supported by the Australian Research Council as part of an ARC Large Grant, and IBM under an Eclipse Fellowship and an Eclipse Innovation Award. We would also like to acknowledge our colleagues, Donny Kurniawan and Greg Watson.
About the Authors David Abramson is a Professor of Computer Science at Monash University. He served as chair of the School from 1998 to 2002. He is the leader of the Guard project, and a founder of GuardSoft, a company devoted to commercializing relative debugging (www.guardsoft.com). Tim Ho is currently a PhD student in the School of Computer Science and Software Engineering at Monash University. Ho is responsible for the initial implementation of Eclipse Guard. Clement Chu is a research assistant in the School of Computer Science and Software Engineering at Monash University. He implemented a prototype version of relative debugging under the Sun One Studio environment. Wojtek Goscinski is a PhD student in the School of Computer Science and Software Engineering at Monash Un iversity. All enquiries should be directed to Abramson at
[email protected].
5