Economic Load Dispatch Using Population-Variance Harmony Search Algorithm B K Panigrahi1*, V Ravikumar Pandi1, Swagatam Das2, Zhihua Cui3, Renu Sharma4 1
Department of Electrical Engg., IIT, Delhi, India – 110016. Department of Electronics and Telecommunication Engg., Jadavpur University, Kolkata, India. 3 Complex System and Computational Intelligence Laboratory, Taiyuan University of Science and Technology, Taiyuan, Shanxi, China, 030024. 4 Department of Electrical and Electronics Engg, ITER, SOA University, Bhubaneswar, Orissa, India 2
This paper presents a novel stochastic optimization approach to solve constrained economic load dispatch (ELD) problem using Harmonic Search algorithm (HS). HS is a recently developed derivative-free, meta-heuristic optimization algorithm, which draws inspiration from the musical process of searching for a perfect state of harmony. This work analyses the evolution of the population-variance over successive generations in HS and thereby draws some important conclusions regarding the explorative power of HS. The proposed methodology easily takes care of solving non-convex economic load dispatch problems along with different constraints like transmission losses, ramp rate limits of the generators and prohibited operating zones. Simulations were performed over various standard test systems with different number of generating units and a comparative study is carried out with other existing relevant approaches. The findings affirmed the robustness and proficiency of the proposed methodology over other existing techniques. Key words: Harmony Search; Economic load dispatch; Prohibited operating zones; Ramp rate
1. Introduction Economic load dispatch (ELD) problem (Choudhary et al., 1990; Happ, 1971) is a constrained optimization problem in power systems that have the objective of dividing the total power demand among the online participating generators economically while satisfying the various constraints. Over the years, many efforts have been made to solve the problem, incorporating different kinds of constraints or multiple objectives, through various mathematical programming and optimization techniques. The conventional methods include Lambda iteration method (Wood et al, 1984; Chen et al, 1993), base point and participation factors method (Wood et al, 1984; Chen et al, 1993), gradient method (Wood et al, 1984; Lee et al., 1984), etc. Among these methods, lambda iteration is most common one and, owing to its ease of implementation, has been applied through various software packages to solve ELD problems. But for effective implementation of this method, the formulation needs to be continuous. The basic ELD considers the power balance constraint apart from the generating capacity limits. However, a practical ELD must take ramp rate limits, prohibited operating
*
Address for correspondence: B K Panigrahi, Electrical Engineering Department, Indian Institute of Technology Delhi, Hauz Khas, New Delhi, India – 110016, E-mail:
[email protected] 1
zones, valve point loading effects, and multi fuel options (Lin et al., 1984) into consideration to provide the completeness for the ELD problem formulation. The resulting ELD is a non-convex optimization problem, which is a challenging one and cannot be solved by the traditional methods. An ELD problem with valve point loading has also been solved by dynamic programming (DP) (Bakirtzis et al., 1994; Lee et al., 1993). Though promising results are obtained in small sized power systems while solving it with DP, it unnecessarily raises the length of solution procedure resulting in its vulnerability to solve large size ELD problems in stipulated time frames. Moreover, evolutionary and behavioral random search algorithms such as Genetic Algorithm (GA) (Sheble et al., 1994; Walters et al., 1993; Ma et al., 1994), Particle Swarm Optimization (PSO) (Gaing, 2003; Park et al., 2005) etc. have previously been implemented on the ELD problem at hand. In addition, an integrated parallel GA incorporating ideas form simulated annealing (SA) and Tabu search (TS) techniques was also proposed in (Chen et al., 1995) utilizing generator’s output power as the encoded parameter. Yalcinoz has used a real-coded representation technique along with arithmetic genetic operators and elitistic selection to yield a quality solution (Yalcionoz et al., 2001). GA has been deployed to solve ELD with various modifications over the years. In a similar attempt, a unit independent encoding scheme has also been proposed based on equal incremental cost criterion (Fung et al., 2000). In spite of its successful implementation, GA does posses some weaknesses leading to longer computation time and less guaranteed convergence, particularly in case of epistatic objective function containing highly correlated parameters (Fogel, 2000; Eberhart et al., 1998). Moreover, premature convergence of GA is accompanied by a very high probability of entrapment into the local optimum (Damousis et al., 1995). Some other hybrid approaches like GA combined with simulated annealing (SA) (Wong et al., 1994), evolutionary programming (EP) (Yang et al., 1996), improved Tabu search (ITS) (Lin et al., 2002), improved fast EP (IFEP) (Sinha et al., 2003), evolutionary strategy optimization (ESO) (Pereira-Neto et al., 2005) have been successfully applied to solve the ELD problem. Besides these soft computing methodologies, some other promising techniques like Hopfield neural networks (Park et al., 1993; Lee et al., 1998), two phase neural network (Naresh et al., 2004) have been successfully applied to solve the constrained ELD. In the paradigm of artificial intelligence (AI), evolutionary algorithms (EA) are randomized search and optimization techniques that mimic the processes of Darwinian evolution and natural genetics (Back et al., 1997). In recent past the computational cost having been reduced almost dramatically, researchers, all over the world, are coming up with new EAs on a regular basis in order to meet the demands of the complex, real-world optimization problems. The challenge in bio inspired computing algorithm is given in (Akerkar et al., 2009). The predicted modified particle swarm optimization is developed in (Cai, et al., 2009). In 2001, Geem et al. proposed Harmony Search (HS) (Geem et al., 2002a), a derivative-free, meta-heuristic algorithm, mimicking the improvisation process of music players. Since its inception, HS has found several applications in a wide variety of practical optimization problems like pipe-network design (Geem et al., 2002b), structural optimization (Kang et al., 2004), vehicle routing problem (Geem et al., 2005), combined heat and power economic dispatch problem (Vasebi et al., 2007), and Dam Scheduling (Geem, 2007).A significant amount of research has already been undertaken on the application of HS for solving difficult practical optimization problems as well as to improve the performance of HS by tuning its parameters and/or blending it with other powerful optimization techniques like PSO (Particle Swarm Optimization) (Mahdavi et al., 2007; Omran et al., 2008; Fesanghary et al., 2008; Geem, 2006), clonal selection principles (Wang, et al., 2009) and differential evolution algorithm (Noman et al., 2008) . 2
Based on the analysis presented in (Mukhopadhyay et al., 2008), this paper uses a simple modification of the classical HS. In the modified HS, the control parameter known as distance bandwidth (bw) has been made equal to the standard deviation of the current population. The proposed modified HS algorithm is used to solve the ELD problem. In order to establish the capability of the proposed hybridized technique to optimize smooth as well as non-smooth cost functions, this paper considers six generator, thirteen generator, fifteen generator and forty generator test systems. The results obtained are compared with those of GA, PSO and other promising metaheuristic methods. The proposed methodology emerges out to be a robust optimization technique for solving ELD problem for various cost curve natures and different size power systems.
2. Problem Description In a power system, the unit commitment problem has various sub-problems varying from linear programming problems to complex non-linear problems. The concerned problem, i.e., Economic Load Dispatch (ELD) problem is one of the different non-linear programming sub-problems of unit commitment. The ELD problem is about minimizing the fuel cost of generating units for a specific period of operation so as to accomplish optimal generation dispatch among operating units and in return satisfying the system load demand, generator operation constraints with ramp rate limits and prohibited operating zones. The ELD problem with smooth and non smooth cost functions is considered in this paper. 2.1 ELD problem formulation The objective function corresponding to the production cost can be approximated to be a quadratic function of the active power outputs from the generating units. Symbolically, it is represented as Minimize
NG
Ftcos t = ∑ f i ( Pi )
(1)
i =1
f i ( Pi ) = a i Pi 2 + bi Pi + ci ,
where
i = 1,2,3, ..., N G
(2)
is the expression for cost function corresponding to ith generating unit and ai, bi and ci are its cost coefficients. Pi is the real power output (MW) of ith generator corresponding to time period t. NG is the number of online generating units to be dispatched. This constrained ELD problem is subjected to a variety of constraints depending upon assumptions and practical implications. These include power balance constraints to take into account the energy balance; ramp rate limits to incorporate dynamic nature of ELD problem and prohibited operating zones. These constraints are discussed as under. 1) Power Balance Constraints or Demand Constraints: NG
This constraint is based on the principle of equilibrium between total system generation ( ∑ Pi ) and i =1
total system loads (PD) and losses (PL). That is, NG
∑P = P i
D
+ PL
(3)
i =1
where PL is obtained using B- coefficients, given by 3
NG NG
NG
i =1 j =1
i =1
PL = ∑∑ Pi Bij Pj + ∑ Pi Bi 0 + B00
(4)
2) The Generator Constraints: The output power of each generating unit has a lower and upper bound so that it lies in between these bounds. This constraint is represented by a pair of inequality constraints as follows. Pi min ≤ Pi ≤ Pi max
(5)
where, Pimin and Pimax are lower and upper bounds for power outputs of the ith generating unit. 3) The Ramp Rate Limits: One of unpractical assumption that prevailed for simplifying the problem in many of the earlier research is that the adjustments of the power output are instantaneous. However, under practical circumstances ramp rate limit restricts the operating range of all the online units for adjusting the generator operation between two operating periods (He et al., 2008). The generation may increase or decrease with corresponding upper and downward ramp rate limits. So, units are constrained due to these ramp rate limits as mentioned below. If power generation increases, Pi − Pit −1 ≤ URi
(6)
Pit −1 − Pi ≤ DRi
(7)
If power generation decreases,
where Pit-1 is the power generation of unit i at previous hour and URi and DRi are the upper and lower ramp rate limits respectively. The inclusion of ramp rate limits modifies the generator operation constraints (5) as follows.
max(Pimin , Pit −1 − DR i ) ≤ Pi ≤ min(Pimax , Pit −1 + UR i )
(8)
4) Prohibited Operating Zone: The generating units may have certain ranges where operation is restricted on the grounds of physical limitations of machine components or instability e.g. due to steam valve or vibration in shaft bearings. Consequently, discontinuities are produced in cost curves corresponding to the prohibited operating zones. So, there is a quest to avoid operation in these zones in order to economize the production. Symbolically, for a generating unit i, ( ) Pi ≤ P pz and Pi ≥ P pz
(9)
( ) where P pz and P pz are the lower and upper are limits of a given prohibited zone for generating unit i.
2.2 ELD constraints Handling The equality and inequality constraints of the ELD problem are considered in the Fitness function (Jerror) itself by incorporating a penalty function
(
lim ⎧⎪ PFi = ⎨k i U i − U i ⎪⎩ 0
)
2
if violated otherwise th
(10)
Where ki is the constant, called penalty factor for the i constraint. Now the final solution should not contain any penalty for the constraint violation. Therefore the objective of the problem is the minimization of generation cost and penalty function due to any constraint violation as defined by the following equation 4
J error = Ftcos t +
nc
∑ PF ,
(11)
i
i =1
where “nc” is the number of constraints.
3. Harmony search Algorithm 3.1 Classical Harmony search Algorithm Harmony search is a new meta-heuristic optimization algorithm which imitates the music improvisation process applied by musicians. Each musician improvises the pitches of his/her instrument to obtain a better state of harmony. The goal of the process is to reach a perfect state of harmony. The different steps of the HS algorithm are described below: Step 1: The 1st step is to specify the problem and initialize the parameter values. The optimization problem is defined as minimize (or maximize) f ( x ) such that L x i ≤ x i ≤ U x i , where f ( x ) is the objective function, x is a solution vector consisting of N decision variables ( xi ) and
L
x i and
U
x i are the
lower and upper bounds of each decision variable, respectively. The parameters of the HS algorithm i.e. the harmony memory size ( HMS ), or the number of solution vectors in the harmony memory; harmony memory considering rate ( HMCR ); pitch adjusting rate ( PAR ); and the number of improvisations ( NI ) or stopping criterion are also specified in this step. Step 2: The 2nd step is to initialize the Harmony Memory. The initial harmony memory is generated from a uniform distribution in the ranges [ L x i , U x i ], where 1 ≤ i ≤ N . This is done as follows:
x ij = L x i + r × ( U x i − L x i ) , where j = 1,2,3...., HMS and r ~ U(0,1)
(12)
Step 3: The third step is known as the ‘improvisation’ step. Generating a new harmony is called /
/
/
/
/ / ‘improvisation’. The New Harmony vector x = ( x1 , x 2 ,x 3 ,x 4 ,..., x N ) is generated using the
following rules: memory consideration, pitch adjustment, and random selection. The procedure works as follows: Pseudo-code of improvisation in HS for each i ∈ [1, N ] do
if U (0,1) ≤ HMCR then /*memory consideration*/ begin x i/ = x ij , where j ~ U (1,2, Κ , HMS ) .
if U (0,1) ≤ PAR then
/* Pitch adjustment */
begin x i/ = x i/ + r × bw , where r ~ U (0,1) and bw is the
(13)
arbitrary distance bandwidth parameter. else /* random selection */ x ij = L x i + r ⋅ ( U x i − L x i )
(14)
endif 5
done Step 4: In this step the harmony memory is updated. The generated harmony vector
x / = ( x1/ , x 2 / ,x 3 / ,x 4 / ,..., x N / ) replaces the worst harmony in the HM (harmony memory), only if its fitness (measured in terms of the objective function) is better than the worst harmony.
Step 5: The stopping criterion (generally the number of iterations) is checked. If it is satisfied, computation is terminated. Otherwise, Steps 3 and 4 are repeated. 3.2 Improvement in harmony search (IHS) algorithm Improvement in harmony search (IHS) algorithm is proposed in (Mahdavi et al., 2007) by dynamically varying the pitch adjustment rate (PAR) with generation number and is expressed as (PAR Max − PAR Min ) PAR(gn ) = PAR Min + × gn NI (15) Where PAR PARMin PARMax NI gn
Pitch adjustment rate for each generation minimum pitch adjusting rate maximum pitch adjusting rate number of generations generation number
3.3 Modified Population Variance Harmony Search (PVHS) Algorithm Bases on the previous work (Mukhopadhyay et al., 2008) to analyze the explorative tendencies in HS, the following theorems have been evolved: Theorem 1: Let x = {x1 , x2 ,Κ , x N } be the current population, Y = {Y1 , Y2 ,Κ , YN } the intermediate
population obtained after harmony memory consideration and pitch adjustment. If HMCR be the harmony memory consideration probability, PAR the pitch-adjustment probability, bw the arbitrary distance bandwidth and if we consider the allowable range for the decision variables ( xi ) to be
{x min , x max } where x max = a , x min = −a , then E(var(Y )) =
(m − 1) ⋅ [ HMCR ⋅ var(x ) + HMCR ⋅ (1 − HMCR) ⋅ x 2 + HMCR ⋅ (1 − HMCR) ⋅ PAR ⋅ bw ⋅ x_ m
2 ⎛ 1 HMCR ⋅ PAR ⎞ a + HMCR ⋅ PAR ⋅ bw ⋅ ⎜ − ⋅ (1 − HMCR)] ⎟+ 4 ⎝3 ⎠ 3
(16)
2
If HMCR is chosen to be very high (i.e. very near to 1) and the distance bandwidth parameter ( bw ) is chosen to be the standard deviation of the current population (i.e. σ(x ) = var(x ) ), then population
variance (without selection) will grow almost exponentially over generations. Now, if we make HMCR ≈ 1 then terms containing
__
2
x , x , and a have very little contribution to the
overall expected population variance. Hence, if we choose bw = σ(x ) = var(x ) (i.e. the standard deviation of the current population) the expression (12) becomes: E(var(Y )) ≈
(m − 1) ⋅ ⎡ HMCR ⋅ var(x ) + HMCR ⋅ PAR ⋅ bw 2 ⋅ ⎛ 1 − HMCR ⋅ PAR ⎞⎤ m
⎜ ⎝3
⎢ ⎣
6
4
⎟⎥ ⎠⎦
Neglecting the terms containing (1 − HMCR ) , we may have,
E(var(Y )) =
(m − 1) ⋅ ⎡ HMCR + HMCR ⋅ PAR ⋅ ⎛ 1 − HMCR ⋅ PAR ⎞⎤ ⋅ var(x ) m
⎜ ⎝3
⎢ ⎣
4
⎟⎥ ⎠⎦
(17)
From (17) it is seen that if we do not include selection in the algorithm, then the expected variance of the gth population ( X g ) becomes: ⎧ (m − 1) ⎡ ⎛ 1 HMCR ⋅ PAR ⎞ ⎤ ⎫ ⋅ ⎢ HMCR + HMCR ⋅ PAR ⋅ ⎜ − E var X g = ⎨ ⎟ ⎥ ⎬ ⋅ var ( X 0 ) 4 ⎝3 ⎠⎦ ⎭ ⎣ ⎩ m g
( ( ))
(18)
If we choose the values of the parameters HMCR, PAR in such a way that the term within the second brackets becomes grater than unity, then we can expect an exponential growth of population variance. This growth of expected population variance over generations gives the algorithm a strong explorative power which is essential for an EA. Specifically in modified HS the bw is changed dynamically with generations as
σ(x ) = var (x )
(19)
Taking the inspiration from the above work, the ELD problem was solved using the population variance based harmony search. After many trials, the parameters of the algorithm are tuned optimally to have a better performance. It has been found that, HMCR = 0.98 and PAR = 0.67 provides more explorative power after performing a series of experiments.
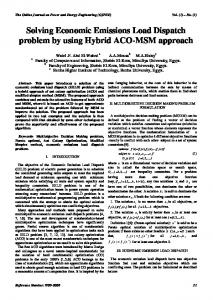
4. Results and Discussions 4.1 ELD with Smooth and Non Smooth Cost Function considering Ramp Rate Limits and Prohibited Operating Zones The applicability and viability of the aforementioned technique for practical applications has been tested on four different power system cases. The obtained results are compared with the reported results of GA, PSO (Gaing, 2003), CPSO (Jiejin et al., 2007), PSO-LRS, NPSO and NPSO-LRS (Selvakumar et al., 2007) methods. The cases taken for our study comprises of 6, 15, 18 and 40 generator systems. Following subsections deal with the detailed discussion of the obtained results. 4.2 Six-Unit System The system contains six thermal generating units. The total load demand on the system is 1263 MW. The results are compared with the elitist GA (Gaing, 2003), PSO (Gaing, 2003), NPSO-LRS (Selvakumar et al., 2007), DE (Noman et al., 2008) and CPSO (Jiejin et al., 2007) methods for this test system. Parameters of all the thermal units are reported in (Gaing, 2003). Results obtained using the proposed population variance harmony search algorithm is listed in table 1. The convergence of algorithm for this test system is shown in Figure 1. It can be evidently seen from table 1 that the technique provided better results compared to other reported evolutionary algorithm techniques. It is also observed that the mean cost using the proposed approach is less than the reported minimum cost using some of other methods. The standard deviation of the cost is 3.353 $. The reported results for the above test case using various evolutionary computing techniques are reported in Table 2.
7
(Insert Table 1 here) (Insert Table 2 here) (Insert Figure 1 here) 4.3 Fifteen Unit system This system comprises of 15 generating units with a load demand of 2630 MW. This test system consists of smooth cost function. The system transmission line losses are calculated through Bmn coefficients, and it has ramp rate limits and prohibited operating zones constraints. The parameters of this system can be found in (Gaing, 2003). The results obtained by different variants of harmony search are reported in table 3 and a comparative result with other promising methods is reported in table 4. The results obtained are significantly better than GA and comparable with PSO and other recently reported results by CPSO, and also satisfies the system constraints thereby validating the heuristics applicability.
(Insert Table 3 here) (Insert Table 4 here) 4.4 Forty-Unit System This test system consists of 40 generators with valve point loading effects and has a total load demand of 10 500 MW (Sinha et al., 2003). The system has many local minima, and global minimum is very hard to locate. The best generation cost reported until now is $1 21 418.27 (He et al., 2008) and in the same reference other comparisons are made. The best result obtained is reported in table 5 and compared with other recently reported results.
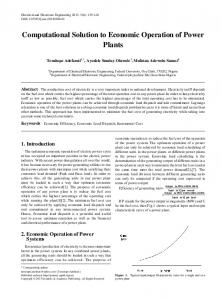
(Insert Table 5 here) 4.5 Eighteen-Unit System This system consists of 18 generating units with a maximum generation capacity of 433.22 MW. The system parameters are as reported in (Gaing, 2003, Damousis et al , 2003). In this paper, simulations have been carried out for different load demands using population variance based harmony search. Power demands considered in this work are 365 MW, 411.559 MW (i.e. 95% of Pmax), 346.576 MW (i.e. 80% of Pmax) and, 303.254 MW (i.e. 70% of Pmax) successively. The results for all these varying load demands are reported successively in table VI. Final comparison for all the load demands considered is made in table VII. The convergence characteristics using population variance based harmony search for all the four cases is presented in figure 2.
(Insert Table 6 here) (Insert Table 7 here) (Insert Figure 2 here)
8
5. Conclusions The paper has employed the modified population variance based harmony search algorithm on the constrained economic load dispatch problem. Practical generator operation is modeled using several non linear characteristics like ramp rate limits, prohibited operating zones. The proposed approach has produced results comparable or better than those generated by other evolutionary algorithms and the solutions obtained have superior solution quality and good convergence characteristics. From this limited comparative study, it can be concluded that the applied algorithm can be effectively used to solve smooth as well as non-smooth constrained ELD problems. In future, efforts will be made to incorporate more realistic constraints to the problem structure and the practical large sized problems would be attempted by the proposed methodology.
Acknowledgement The authors acknowledge the kind support of IIT Delhi, Jadavpur University and SOA University to carry out the collaborative research. This work was also supported by the Key Project of Chinese Ministry of Education under Grant 209021 References Akerkar, R. and Sajja, P. S. 2009: Bio-inspired computing: constituents and challenges. International Journal of Bio-Inspired Computation 1, 135-150. Bäck, T., Fogel, D. and Michalewicz, Z. 1997: Handbook of Evolutionary Computation, New York, Oxford University Press.
dispatch. IEEE Trans. on Power System 5, 1248-1259. Coelho, L. S. and Mariani, V. C. 2006: Combining of chaotic differential evolution and quadratic programming for economic dispatch optimization with valve-point effect. IEEE Trans. Power Syst. 21, 989–996.
Bakirtzis, A., Petridis, V. and Kazarlis, S. 1994: Genetic algorithm solution to the economic dispatch problem. Proc. Inst. Elect. Eng. Gen., Transm. Distrib. 141,377–382.
Damousis, I. G., Unkirlzis, A. G. and Dokopoulos, P. S. 2003: Network-Constrained Economic Dispatch Using Real-Coded Genetic Algorithm. IEEE Trans. on Power Systems 18, 198-205. Eberhart, R. C. and Shi, Y. 1998: Comparison between genetic algorithms and particle swarm optimization. Proc. IEEE Int. Conf. Evol. Comput., 611–616.
Cai, X., Cui, Y. and Tan, Y. 2009: Predicted modified PSO with time-varying accelerator coefficients. International Journal of Bio-Inspired Computation 1, 50-60. Chen, C. L. and Wang, S. C. 1993: Branch and bound scheduling for thermal generating units. IEEE Trans. on Energy Conversion 8, 184-189.
Fesanghary, M., Mahdavi, M., Minary-Jolandan, M. and Alizadeh, Y. 2008: Hybridizing Harmony Search Algorithm with Sequential Quadratic Programming for Engineering Optimization Problems. Computer Methods in Applied Mechanics and Engineering 197, 3080-3091. Fogel, D. B. 2000: Evolutionary Computation:
Chen, P. H. and Chang, H. C. 1995: Large scale economic dispatch by genetic algorithm. IEEE Trans. Power Syst. 10, 1919–1926. Choudhary, B. H. and Rahman, S. 1990: A Review of recent advances in economic 9
Toward a New Philosophy of Machine Intelligence, second ed., IEEE Press, Piscataway, NJ. Fung, C. C., Chow, S. Y. and Wong, K. P. 2000: Solving the economic dispatch problem with an integrated parallel genetic algorithm. In Proc. POWERCON, 1257–1262.
structural optimization method based on the harmony search algorithm. Comput. Struct. 82, 781–798. Lee, K. Y. et al., 1984: Fuel cost minimization for both real and reactive power dispatches. IEE Proc. Gener. Trsns. & distr 131, 85-93.
Gaing, Z. L. 2003: Particle swarm optimization to solving the economic dispatch considering the generator constraints. IEEE Trans. on Power Systems 18, 1187-1195.
Lee, F. N. and Breipohl, A. M. 1993: Reserve constrained economic dispatch with prohibited operating zones. IEEE Trans. Power Syst. 8, 246–254.
Geem, Z. W., Kim, J. H. and Loganathan, G. V. 2002a: A new heuristic optimization algorithm: harmony search, Simulation. 76, 60–68.
Lee, K. Y., Sode-Yome, A. and Park, J. H. 1998: Adaptive Hopfield neural network for economic load dispatch. IEEE Trans. Power Syst., 13, 519–526.
Geem, Z. W., Kim, J. H. and Loganathan, G. V. 2002b: Harmony search optimization: application to pipe network design. Int. J. Model. Simul. 22, 125–133. Geem, Z. W., Lee, K. S. and Park, Y. 2005: Application of Harmony Search to Vehicle Routing. American Journal of Applied Sciences 2, 1552-1557.
Lin, C. E. and Viviani, G. L. 1984: Hierarchical economic dispatch for piecewise quadratic cost functions. IEEE Trans. on Power Apparatus Systems PAS103, 1170-1175. Lin, W. M., Cheng, F. S. and Tsay, M. T. 2002: An improved tabu search for economic dispatch with multiple minima. IEEE Trans. Power Syst. 17, 108–112. Ma, H., El-Keib, A. A. and Smith, R. E. 1994: A genetic algorithm-based approach to economic dispatch of power systems, IEEE Proc. of Southesatcon-94, 212-216.
Geem, Z. W. 2006: Improved Harmony Search from Ensemble of Music Players. Lecture Notes in Artificial Intelligence 4251, 86-93. Geem, Z. W. 2007: Optimal Scheduling of Multiple Dam System using Harmony Search Algorithm. Lecture Notes in Computer Sceince 4507, 316-323. Happ, H. H. 1971: Optimal power dispatch-a comprehensive survey. IEEE Trans on Power Apparatus and Systems PAS-96, 841-854.
Mahdavi, M., Fesanghary, M. and Damangir, E. 2007: An improved Harmony Search Algorithm for Solving Optimization Problems. Applied Mathematics and Computation 188, 1567-1579.
He, D., Wang, F. and Mao, Z. 2008: A hybrid genetic algorithm approach based on differential evolution for economic dispatch with valve-point effect. Electrical power and energy systems 30, 31-38.
Mukhopadhyay, A., Roy, A., Das, S., Das, S. and Abraham, A. 2008: Population-Variance and Explorative Power of Harmony Search: An Analysis. In Third IEEE International Conference on Digital Information Management (ICDIM 2008), 13-16, University of East London, London. UK.
Jiejin, C., Xiaoqian, M., Lixiang, L. and Haipeng, P. 2007: Chaotic particle swarm optimization for economic dispatch considering the generator constraints. Energy conver. and Management 48, 645-653. Kang, S. L. and Geem, Z. W. 2004: A new
Naresh, R., Dubey, J. and Sharma, J. 2004: Two phase neural network based modeling framework of constrained economic load 10
dispatch. IEE Proc. Gener. Transm. Distrib., 151, 373-378.
dispatch by Harmony Search Algorithm. International Journal of Electrical Power and Energy Systems 29, 713-719. Walters, D. C. and Sheble, G. B. 1993: Genetic algorithm solution of economic dispatch with valve point loading. IEEE Trans. on Power Systems 8, 1325-1332. Wang, X., Gao, X. and Ovaska, S. J. 2009: Fusion of clonal selection algorithm and harmony search method in optimisation of fuzzy classification systems. Int. Journal Bio-Inspired Computation 1, 80-88. Wong, K. P. and Wong, Y. W. 1994: Genetic and genetic/simulated –annealing approaches to economic dispatch. Proc. Inst. Elect. Eng., Gen., Transm., Distrib. 141, 507–513. Wood, A. J. and Wollenberg, B. F. 1984: Power Generation, Operation and Control. New York, John Wiley & Sons. Yalcionoz, T., Altun, H. and Uzam, M. 2001: Economic dispatch solution using a genetic algorithm based on arithmetic crossover. In Proc. IEEE Power Tech. Conf. 2, Porto, Portugal.
Noman, N. and Iba, H. 2008: Differential evolution for economic load dispatch problems, Electric Power Systems Research, 78(8),. 1322-1331. Omran, M. G. H. and Mahdavi, M. 2008: Global-Best Harmony Search. Applied Mathematics and Computation, 198, 643-656. Park, J. H., Kim, Y. S., Eom, I. K. and Lee, K. Y. 1993: Economic load dispatch for piecewise quadratic cost function using Hopfield neural network. IEEE Trans. Power Syst., 8, 1030–1038. Park, J. B., Lee, K. S., Shin, J. R. and Lee, K. Y. 2005: A Particle Swarm optimization for economic dispatch with non-smooth cost functions. IEEE Transactions on Power Systems 20, 34-42. Pereira-Neto, A., Unsihuay, C. and Saavedra, O. R. 2005: Efficient evolutionary strategy optimisation procedure to solve the nonconvex economic dispatch problem with generator constraints. Proc. Inst. Elect. Eng., Gen., Transm., Distrib., 152, 653–660. Selvakumar, A. I. and Thanushkodi, K. 2007: A new particle swarm optimization Solution to nonconvex economic dispatch problems. IEEE Trans. on power systems 22, 42-51. Selvakumar, A. I. and Thanushkodi, K. 2009: Optimization using civilized swarm: solution to economic dispatch with multiple minima. Electric power systems research 79, 8-16.
Yang, H. T., Yang, P. C. and Huang, C. L. 1996: Evolutionary programming based economic dispatch for units with non-smooth fuel cost functions. IEEE Trans. Power Syst. 11, 112–118.
Sheble, G. B. and Brittig, K. 1994: Refined genetic algorithm-economic dispatch example. IEEE/PES Winter Meeting 199-0 PWRS, Paper 94. Sinha, N., Chakrabarti, R. and Chattopadhyay, P. K. 2003: Evolutionary programming techniques for economic load dispatch. IEEE Trans. Evol. Comput., 7, 83–94. Vasebi, A., Fesanghary, M. Bathaeea, S. M. T. 2007: Combined heat and power economic 11
Table I Results for 6 unit system for a demand of 1263 MW Generator Power Output (MW)
PVHS
HS
IHS
PG1
448.312 3
463.331 5
448.722 3
PG2
178.590 3
175.417 7
168.321 1
PG3
257.781 9
256.442 2
255.515 9
PG4
142.803 5
142.922 2
139.957 2
PG5
159.144 5
155.579 8
171.402
PG6
88.727 3
81.673 4
91.643 3
Total Power Generation (MW)
1275.3598
1275.3669
1275.5619
Minimum Cost ($/hr)
15 444.96
15 447.5042
15 445.6448
Ploss (MW)
12.367 2
12.360 6
12.588 6
Mean Cost ($/hr)
15 451.4
15 455.8
15 453.5
3.353
4.814
4.103
Standard Deviation Cost ($/hr)
of
Table II Reported results for Six unit system: PD=1263MW Method
Best cost($/hr)
Mean cost($/hr)
Stand. Dev. of cost($/hr)
PSO(Gaing, 2003)
15 450
15 454
-
GA(Gaing, 2003)
15 459
15 469
-
NPSO-LRS (Selvakumar et al., 2007)
15 450
15 450.5
-
DE (Noman et al., 2008)
15449.766
15449.777
-
CPSO1(Jiejin et al., 2007)
15 447
15 449
-
CPSO2(Jiejin et al., 2007)
15 446
15 449
-
PVHS (proposed)
15 444.96
15 451.4
3.353
Table III Results for 15 unit system for a demand of 2630 MW Generator Power Output (MW)
PVHS
HS
IHS
PG1
455.000
451.458 8
455.000
PG2
373.820
376.519 5
353.815 1
PG3
130.000
130.000
130.000
PG4
130.000
128.873 9
124.679 8
PG5
166.313
168.204 9
168.719 2
PG6
456.542
460.000
452.560 1
12
PG7
428.270
416.833 3
415.276 4
PG8
66.059
129.816 5
97.496 3
PG9
120.496
40.560 7
117.100 6
PG10
146.955
115.053
94.193 2
PG11
43.223
59.212 7
80.000
PG12
80.000
75.648 5
76.665 9
PG13
27.979
25.000
28.004
PG14
20.955
48.895 1
44.426 9
PG15
16.671
34.582 7
22.617 3
Total Power Generation (MW)
2 662.284
2 660.659 6
2 660.554 8
Minimum Cost ($/hr)
32 780.00
32 813.341 4
32 830.338 3
Ploss (MW)
32.195 3
30.6852
30.5336
Mean Cost ($/hr)
32 892.463
32 910.652
32 925.263
Standard Deviation of Cost ($/hr)
35.331
40.271
45.415
Table - IV Fifteen – unit system: PD = 2630MW Method
Mean Time (s)
Best cost($/hr)
Mean cost($/hr)
Stand. Dev. cost($/hr)
PSO(Gaing, 2003)
26.59
32 858
33 039
-
GA(Gaing, 2003)
49.31
33 113
33 228
-
CPSO1 (Jiejin et al., 2007)
13.31
32 835
33 021
-
CPSO2 (Jiejin et al., 2007)
13.13
32 834
33 021
-
PVHS
29.701 4
32 780
32 892.463
24.669 7
Table - V Results for 40 unit system for a demand of 10 500 MW 13
of
Generator Power Output (MW)
PVHS
HS
IHS
PG1
110.831 2
110.799 8
110.799 8
PG2
110.823 4
110.799 8
110.799 8
PG3
97.399 9
97.399 9
97.399 9
PG4
179.733 1
179.733 1
179.733 1
PG5
88.993 2
97.000 0
91.957 5
PG6
140.000 0
140.000 0
140.000 0
PG7
259.600 6
300.000 0
300.000 0
PG8
284.614 3
284.599 7
284.599 7
PG9
284.599 7
284.599 7
284.599 7
PG10
130.000 0
130.000 0
130.000 0
PG11
168.799 8
168.799 8
168.799 8
PG12
168.799 8
94.000 0
94.000 0
PG13
214.759 8
125.000 0
214.759 8
PG14
394.279 4
394.279 4
394.279 4
PG15
304.519 1
394.279 4
304.519 6
PG16
394.279 4
394.279 4
394.279 4
PG17
489.279 4
489.279 4
489.279 4
PG18
489.279 4
489.279 4
489.279 4
PG19
511.279 6
511.279 4
511.279 4
PG20
511.279 4
511.279 4
511.279 4
PG21
523.286 7
523.279 4
523.279 4
PG22
523.283 6
523.279 4
523.279 4
PG23
523.279 4
523.279 4
523.279 4
PG24
523.279 4
523.279 4
523.279 4
PG25
523.279 4
523.279 4
523.279 4
PG26
523.279 4
523.279 4
523.279 4
PG27
10.000 0
10.000 0
10.000 0
PG28
10.000 0
10.000 0
10.000 0
PG29
10.000 0
10.000 0
10.000 0
PG30
91.218 4
96.999 9
87.799 9
PG31
190.000 0
190.000 0
190.000 0
PG32
190.000 0
190.000 0
190.000 0
PG33
190.000 0
190.000 0
190.000 0
PG34
164.917 9
164.799 8
164.799 8
PG35
164.867 2
164.799 8
164.799 8
PG36
164.878 6
185.757 5
200.000 0
PG37
110.000 0
110.000 0
110.000 0
PG38
110.000 0
110.000 0
110.000 0
PG39
110.000 0
110.000 0
110.000 0
PG40
511.279 5
511.279 4
511.279 4
Total Power
10 500.00
10 500.00
10 500.00
14
Generation (MW) Minimum Cost ($/hr)
1 21 415.456 0
1 21 511.346 4
1 21 439.810 2
Mean Cost ($/hr)
1 21 567.029 2
1 21 601.957
1 21 630.238
Standard Deviation of Cost ($/hr)
94.149 8
105.091
110.213
Table - VI Results for 18 unit system for a different load demands Generator Power Output (MW)
Load demand 365 MW
Load demand 95 % of Pmax
Load demand 80 % of Pmax
Load demand 70 % of Pmax
PG1
15.0286
15.0378
15.0280
15.0253
PG2
45.0000
45.0000
45.0000
44.6417
PG3
25.0000
25.0000
25.0000
25.0000
PG4
25.0000
25.0000
25.0000
25.0000
PG5
25.0000
25.0000
25.0000
25.0000
PG6
4.3470
13.6962
3.0000
3.0000
PG7
4.3442
13.6967
3.0000
3.0000
PG8
12.2800
12.2800
12.2800
12.2800
PG9
12.2800
12.2800
12.2800
12.2800
PG10
12.2800
12.2800
12.2800
12.2800
PG11
12.2800
12.2800
12.2800
12.2800
PG12
22.8577
24.0000
20.7005
14.8673
PG13
3.0001
6.4063
3.0000
3.0000
PG14
34.4037
36.2000
30.8687
21.1234
PG15
35.7039
45.0000
32.3803
23.2316
PG16
36.5910
37.0000
33.2450
24.1259
PG17
36.6029
45.0000
33.2335
24.1188
PG18
3.0000
6.4062
3.0000
3.0000
Total Power Generation (MW)
365
411.559
346.576
303.2540
Minimum Cost ($/hr)
25427.7
29729.3
23854.1
20385
Mean Cost ($/hr)
25468.24
29772.95
23873.64
20405.2
Standard Deviation of Cost ($/hr)
11.42
10.31
10.35
10.19
15
Table - VII Comparison of results for 18 unit system with other reported results Method
Lambda Iteration (Damousis et al , 2003)
Binary GA (Damousis et al , 2003)
Real coded GA (Damousis et al , 2003)
PVHS
365 MW
-
-
25786.84
25427.7
95% Pmax
29731.05
29733.42
29731.05
29729.3
80% Pmax
23861.58
23980.24
23861.58
23854.1
70% Pmax
20393.43
20444.68
20396.39
20385
Figure 1 comparison of Convergence for six unit system
1.56
x 10
4
PVHS IHS HS
1.558
Fuel Cost ($/hr)
1.556 1.554 1.552 1.55 1.548 1.546 1.544
0
1
2 3 Number of Fitness Evaluations
16
4
5 x 10
4
Figure 2 Convergence plot for eighteen unit system
17