Original papers
Effect of different CaO/MgO ratios on the structural and mechanical properties of bioactive glass-ceramics #
M. U. Hashmi, Saqlain A. Shah*, M. J. Zaidi**, S. Alam***
*Department of Applied Sciences, Superior University, Lahore, Pakistan **Department of Physics, Forman Christian College, Lahore, Pakistan ***Department of Physics, Government College University Lahore, Pakistan #
E-mail:
[email protected]
Submitted February 11, 2012; accepted December 2, 2012 Keywords: Melt-quench method, Crystalline phases, Densification, Hardness The aim of present work is to study the relationship between crystalline phases, microstructure and mechanical properties of bioactive glass-ceramics. For this purpose, glasses of composition (50-x) CaO–34SiO2–14.5P2O5–1 CaF2–0.5MgF2– x MgO (wt. %) (where x = 4, 25 and 46 respectively) were synthesized by conventional melt-quench method. Each glass was sintered according to the endothermal and exothermal peaks of differential scanning calorimetric (DSC) data to form three glass ceramics termed G1, G2 and G3 respectively. X-ray diffraction (XRD) revealed crystalline phases of hydroxyapatite and wollastonite in G1 and G2, whereas in G3, a new phase ‘whitlockite’ was observed probably due to a greater concentration of MgO in this sample. Bulk density of the samples was determined by Archimedes principle. Scanning electron microscope (SEM) data illustrated that the rate of densification of materials increased with the decrease of CaO/MgO ratio. Analysis of mechanical properties revealed that micro-hardness and bending strength of the samples increased with the increase in MgO content, which is in accordance with the results of XRD, SEM and bulk density.
Introduction It is a known fact that good bio-materials must show high bio-compatibility, high strength and high corrosion resistance. Glass-Ceramics materials are being used for a long time due to having comparatively high strengths than glasses and having high bio-compatibility than that of ceramics. Apatite-Wollastonite containing glass ceramics (A-W GC) have been reported to be bioactive having in vitro and in vivo stability and are difficult to be resolved in physiological environment [1]. Bioactive glass ceramics containing apatite and wollastonite phases are found to have good mechanical properties and can be prepared by sintering and subsequent crystallization of glass powders [2-6]. Bioactivity and structural properties of glass ceramics are found to vary by compositional and parametric changes [2, 7]. Further studies on the crystallization of glass-ceramic, based on the MgO–CaO–SiO2–P2O5 system revealed that this glass-ceramics system had a superior strength and fracture toughness when compared to the apatite-wollastonite material [6, 7]. Glasses having Mg are found to have outstanding properties [8-14]. Mechanical properties are dependent on microstructure, grain size and crystalline phases etc. [15-17]. A lot of researchers prepared glass ceramics by including Al2O3, ZrO2 and TiO2 etc. in MgO–CaO– Ceramics – Silikáty 56 (4) 347-351 (2012)
SiO2–P2O5 system to show the high mechanical strength but the materials didn’t remain bio-active and became bio-inert. We are in research to develop the bio-materials that remain bio-active but also show the high mechanical strength. For this, we chose the glass-ceramics of composition (50-x) CaO–34 SiO2–14.5 P2O5–1 CaF2‑0.5 MgF2–x MgO (wt. %) (where x = 4, 25 and 46 respectively). In our previous work [18], we investigated the In Vitro dissolution behaviour of these compositions and found that, by increasing the amount of MgO, the bioactivity of the material decreased but it remained bioactive even after adding a high amount of MgO. In the present work, structural characterization is carried out employing thermal analysis using differential scanning calorimeter (DSC), crystallization studies using X-ray diffraction (XRD), bulk densification using Archimedes principle and surface morphological studies using SEM. Micro-hardness and strength parameter are investigated to study the mechanical properties. Experimental Synthesis Glasses of three different compositions (50-x) CaO–34 SiO2–14.5 P2O5–1 CaF2–0.5 MgF2-x MgO (wt. %) (where x = 4, 25 and 46 respectively) were
347
Hashmi M. U., Shah S. A., Zaidi M. J., Alam S.
Structural characterizations of the samples were carried out by various techniques. Thermal analysis was done by differential scanning calorimeter (DSC) (SDT Q600 V8.0 build 95) to investigate the endothermic and exothermic peaks of different phases and the thermal stability of the samples. The temperature was raised at the rate of 5°C/min. PAnalytical X’Pert PRO MPD θ–θ X-ray diffractometer (XRD) operating at a voltage of 40 kV and a current of 40 mA using a CuKα (λ = 1.540598 Å) radiation source was used to study the various crystalline phases of the samples sintered at different temperatures. The bulk density ρ of the samples was calculated using Archimedes principle [19], using water as an immersion liquid: ρ = αρw/(α-b)
(1)
where ρw is the density of water, α is the mass of the sample in air and b is the mass of the sample in water. In order to be sure that open porosity had not been intruded by water, results were compared with density of geometrical shape (i.e. mass/vol). For the morphological study, 20 nm carbon coating was deposited on the samples’ surfaces using vacuum evaporator to create conducting layer. The morphology of the ceramic samples was studied using scanning electron microscope (SEM) (JEOL, JSM 840A) using secondary electron mode of imaging. The grain size was calculated by the intercept method [20]. According to the intercept method, we drew a circle and calculated the number of grains crossing this circle. Then the average grain size (S) was calculated using the formula: S = L/(NxM)
(2)
where L is circumference of the circle, N number of grains crossing the circle and M is magnification.
348
Hv = F.g.2sin(136°/2)/d²
(3)
where F is the applied load in kg, g is the standard gravity (9.8 m/s2) and d is the average length of the diagonals left by the intender in mm. Three point bend test was used for measuring the strength parameter of each sample of 6×7×12 mm3 volume. Test was performed on six pallets of each sample and then average was taken. Results and Discussions Structural Characterization Thermal Analysis Figure 1 shows the DSC curves of G1, G2 and G3. Endotherms in the temperature range of 280°C to 303°C corresponds to the elimination of the organic binder whereas next endotherms at 703°C to 737°C are related to glass transition temperature (Tg) and exothermal peaks in the temperature range 950°C to 990°C correspond to crystallization temperature of the samples. Shift of both endotherms and exotherms from lower temperature to higher temperature indicates that the system is going to be thermally stable with closed packed structure due to increase of MgO content in the composition. 990
Exo.
Structural characterization
For the detailed study of mechanical properties, the samples were flattened by grinding their surfaces using emery papers of coarse grit to the 800 grit sizes. The micro-hardness of the investigated samples was measured using Vicker’s microhardness indenter (SHIMADZU, Japan). Testing was carried out using a load of 100 g with a fixed loading time of 10 sec. After removing the load, the lengths of indentation diagonals were measured with an estimated accuracy of 0.5 µm. The micro-hardness (Hv, in MPa) was calculated similarly as in [17] using eq. (3):
G3
Heat flow (W/g)
Characterization
Mechanical characterization
G2
Endo.
prepared by the same method as mentioned in our previous paper [18]. The glasses were named G1, G2 and G3 respectively. Every glass was powdered using agate mortar and pestle for several hours. 5 wt. % Polyvinyl Alcohol (PVA) was used as organic binder for compaction and powder was compacted under a pressure of 10 tons/cm2 in a hydraulic press. In the present work, G1, G2 and G3 are sintered at 700°C/1 hour - 950°C/3 hours, 720°C/1 hour - 975oC/3 hours and 735°C/1 hour - 990°C/3 hours respectively in a muffle furnace according to the differential scanning calorimetric (DSC) data. The temperature of the furnace was raised at the rate of 5°C/min beginning from the room temperature. The furnace was switched off at the end of each sintering process till the room temperature achieved and samples were taken out. The samples were now ready for characterization.
G1
971 736
299
950 722
697
278
200
300
400
500 600 700 800 Temperature (°C)
900
1000
Figure 1. DSC of G1, G2 and G3. Ceramics – Silikáty 56 (4) 347-351 (2012)
Effect of different CaO/MgO ratios on the structural and mechanical properties of bioactive glass-ceramics
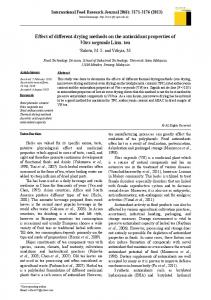
X-ray Diffraction Figure 2 shows the XRD graphs of samples G1, G2 and G3. Graph of G1 contains the majority of hydroxyapatite (HA) peaks with minor phases of wollastonite. Peak intensities of majority of HA phases slightly decrease by decreasing the CaO/MgO as shown in graph of G2. It indicates the decrease in crystals growth that may be due to the ability of MgO to increase the viscosity of silicate glasses by decreasing the non-bridging oxygen in the glass due to which, rate of diffusion and mobility of ions decreased during crystallization process. Presence of whitlockite as the dominant crystalline phase along with HA in graph of G3 is due to very high amount of MgO that demonstrates its high mechanical strength. Whitolockite Hydroxypatite Wollastonite
Intensity (a.u.)
G3
G2
G1
30
35
2θ (°)
40
G3 as well but with slower rate due to already achieved bulk density. In order to be sure that open porosity has not been intruded by water, bulk density is compared with geometrical density (i.e. mass/volume). Both are found to be nearly equal. Scanning Electron Microscopy SEM images of samples G1, G2 and G3 are shown in Figures 3, 4 and 5 respectively. There are irregular grains of different shapes and sizes. Sample G1 has much porosity in its structure which is reduced in G2 due to the densification process during sintering. In the samples having higher MgO content, the diffusion process takes place between the particles along the grain boundaries and the vacancies annihilation occurs that causes the mutual particle coalescence and formation of necks thus increasing the sample density. The coalescence of agglomerates and increased density are highly visible in G3 where the pores have eliminated to a higher extent. This reduction in porosity and the increase in densification are in accordance with the bulk density data. The variation of average grain size with the lower CaO/MgO ratio is tabulated in Table 1. It increases with lowering CaO/MgO ratio; it is the largest for G3 (18 mm) and smallest for G1 (4 mm).
45
Figure 2. XRD of G1, G2 and G3.
Bulk Density Table 1 shows the variation of bulk density with lowering CaO/MgO ratio. Rise in bulk density (2.5 g/cm3 to 2.9 g/cm3) in G1-G2 is much more than that (2.9 g/cm3 to 3.1 g/cm3) in G2-G3 indicating a significant thickening process has already occurred in G1 and G2 in which most of grain boundaries movements and pores reductions have occurred. This process of densification continues in
Figure 3. SEM of G1.
Table 1. Data of bulk density, grain size, micro-hardness and bending strength of G1, G2 and G3. G1 G2 G3 CaO/MgO ratio Heat treatment (°C/h) Bulk Density (g/cm3) Geometrical density (g/cm3) Grain size (µm) Indentation diagonal (µm) Micro hardness (MPa) Bending strength (MPa) Ceramics – Silikáty 56 (4) 347-351 (2012)
11.5/1 700/1-950/3 2.5 2.3 4 18.7 ± 0.5 5192 ± 5.3 % 211
1 725/1-970/3 2.9 2.8 12 17.5 ± 0.5 % 5946 ± 5.7 % 252
1/11.5 730/1-990/3 3.1 3.2 18 16.8 ± 0.5 6467 ± 5.9 % 281
349
Hashmi M. U., Shah S. A., Zaidi M. J., Alam S.
and tabulated in Table 1. The data shows the increase in hardness values for the samples having higher amount of MgO and lower CaO/MgO ratio that may be due to decrease in porosity and refined microstructure by which the crystal size plays an important role in preventing the propagation of the cracks in the whole structure as conformed by SEM micrographs. Whitlockite along with wollastonite in G3 is also an evident for the highest hardness of G3 that shows its closely packed structure. The obtained data revealed that the investigated glassceramics had hardness values (5192-5946-6467 MPa) respectively. Figure 4. SEM of G2.
Bending strength Measure of ductility of material is called bending strength. Bending strength of glass ceramics are dependent on the nature of amorphous and crystalline phases and can be varied by structure and morphology of the material. The results of bending strength of investigated samples are tabulated in Table 1 that declares the bending strength in the range 211-281 MPa showing the highest mechanical strength of G3 that may be due to higher amount of MgO in composition, presence of whitlockite crystalline phase as conformed by XRD and closely packed structure as conformed by SEM. The results are in accordance with bulk density, micro-hardness, XRD and SEM analysis.
Mechanical characterization Figure 5. SEM of G3.
Micro-hardness (MPa)
7000
Conclusion G3
6500
6467
G2
6000
5946
5500 G1 5000
5192
Figure 6. SEM images of the composite M_30t.
Vicker’s micro-hardness Hardness is the resistance of material to abrasion that is found to be dependent on the nature of the material and its composition. Hardness values of investigated samples along with indentation produced are shown in Figure 6
350
Glasses of three different compositions, (50-x) CaO–34 SiO2–14.5 P2O5–1 CaF2–0.5 MgF2–x MgO (wt. %) (where x = 4, 25 and 46 respectively) were prepared using conventional melt-quench method. Each glass was sintered as per DSC data. DSC curves showed that “the higher the MgO content in the samples, the higher the required sintering temperature”.. Crystalline phases of hydroxyapatite and wollastonite were observed in G1 and G2. In G3, also whitlockite was determined. Bulk properties of the samples and morphological study by SEM revealed that rate of densification increased with the decrease of CaO/MgO ratio as well as increase of sintering temperature. Hardness values (5192-6467 MPa) and bending strengths (211-281 MPa) were found to be increased with increase of MgO in the composition and the results were in accordance to that of XRD, SEM and bulk density. The main conclusion is, the lower the CaO/MgO ratio, the higher the sintering temperature and the higher the sintering temperature, the higher the mechanical properties. Ceramics – Silikáty 56 (4) 347-351 (2012)
Effect of different CaO/MgO ratios on the structural and mechanical properties of bioactive glass-ceramics
Acknowledgement Authors acknowledge the support of higher authorities of Superior University Lahore and FC College Lahore. We are also thankful to Dr. Abdul Majeed, Brooklyn Hospital Centre, Brooklyn NY U.S.A, for his technical assistance. References 1. Teramoto H., Kawai A., Sugihara S.: Acta Medica Okayama 59, 201 (2005). 2. Yu B., Liang K., Gu S.: Ceramics international 28, 695 (2002). 3. Kokubo T., Shigematsu M., Nagashisma Y.: Bull. Inst. Chem. Res. Kyoto univ. 60, 260 (1982). 4. Shyu J. J., Wu J.M.: J. Mater. Sci. Lett. 10, 1056 (1991). 5. Shyu J. J., Wu J. M.: J. Am. Ceram. Soc. 73, 1062 (1990). 6. Liu D. M., Chou H. M.: J. Mater. Sci. Mater. Med. 5, 7 (1994). 7. Shyu J. J., Wu J. M.: J. Am. Ceram. Soc. 74, 2123 (1991) 8. Hauret G., Vaills Y., Luspin Y., Gervais F., Cote B., J. NonCryst. Solids 170, 175 (1994).
Ceramics – Silikáty 56 (4) 347-351 (2012)
9. Cervinka L., Berghova J., Trojan M., J. Non-Cryst. Solids 121, 192 (1995). 10. Hoppe W., Walter G., Knanold R., Stacheland D., Baiz A., J. Non-Cryst. Solids 28, 192 (1995). 11. Hoppe W., J. Non-Cryst. Solids 195, 138 (1996). 12. Liu C. C., Yeh J. K., Alola J. F., J. Bone Miner. Res. 3, S104 (1988). 13. Li X., Ito A., Wang X., LeGeros R. Z.: Acta Biomaterelia 5, 508 (2009). 14. Vallet-Regi M., Salinos A. J., Roman J., Gil M., J. Mater. Chem. 9, 515 (1999). 15. Henry J., Hill R. G.: J. Non-Cryst. Solids 319, 13 (2003). 16. Holland W., Beall G. H: Glass-ceramic Technology, Am. Ceram. Soc, Inc., New York 2002. 17. Hasan S. A., Salman S. M., Darwish H., Mahdy E. A.: Ceramics-Silikaty 53, 165 (2009). 18. Hashmi M. U., Shah S. A., Alam S., Shamim A.: CeramicsSilikaty 54, 8 (2010). 19. Marikani A., Maheswaran A., Premanathan M., Amalraj L.: J. Non Crys. Solids 354, 3929 (2008). 20. Evis Z., Usta M., Kutbay I., J. Europ. Ceram. Soc. 29, 621 (2008). 21. J. E. Hilliard, Met. Prog, Datasheet 85, 99 (1964).
351