African Journal of Biotechnology Vol. 11(21), pp. 4833-4840, 13 March, 2012 Available online at http://www.academicjournals.org/AJB DOI: 10.5897/AJB11.3344 ISSN 1684–5315 © 2012 Academic Journals
Full Length Research Paper
Effect of fire disturbances on soil respiration of Larix gmelinii Rupr. forest in the Da Xing’an Mountain during growing season Wenwen Tan, Long Sun, Haiqing Hu and Xiangwei Chen* School of Forestry, Northeast Forestry University, 26 Hexing road, Harbin, 150040, China. Accepted 26 January, 2012
The Da Xing’an Mountain is a key distribution area for Chinese boreal forests and is a fire-prone area. Frequent forest fires have influenced on the regional carbon cycle enormously, especially for the influence of soil respiration. Thus, understanding post-fire soil respiration is important in the study of the global carbon balance. This study chose different fire intensities burned area in 2006 and near unburned area as study area. The objectives of this study were to (1) investigate soil respiration and its components after different intensities of fire disturbances; (2) determine the relationship between postfire soil respiration and soil temperature and soil water content. The results show that heterotrophic respiration is reduced with an increase in fire intensity, whereas autotrophic respiration increases with an increase in fire intensity. The soil respiration does not significantly correlate with fire intensity (P > 0.1). T and W accounted for 56.3 to 77.4% of soil respiration; this percentage increased with an increase in fire intensity. The results provided a foundation for further studies on the effect of forest fires on the soil carbon balance in boreal forests. Key words: Soil respiration, Larix gmelinii Rupr. forest, fire intensity, heterotrophic respiration, environment factors. INTRODUCTION Global climate change, driven by increasing atmospheric concentrations of carbon dioxide (CO2), is a foremost environmental concern, and considerable research has focused on quantifying the components of the global carbon (C) cycle (Savage et al., 2008) . Soil is a major biospheric reservoir for carbon (C), containing twice as much of the global C as the atmosphere and three times as much as vegetation (Granier et al., 2000). The carbon from the soil is released into the atmosphere through soil respiration (Hibbard et al., 2005). Soil respiration (Rs), which originates from autotrophic root respiration (Ra)
*Corresponding author. Email:
[email protected]. Tel:+860451-82191976. Abbreviations: Rs, Soil respiration; Rh, heterotrophic microbial respiration; Ra, root respiration; Rc, root respiration contribution.
rhizosphere and the bulk soil, provides the main carbon microbial respiration (Rh) in the and heterotrophic efflux from terrestrial ecosystems to the atmosphere and is therefore an important component of the global carbon balance (IPCC, 1996; Buchmann, 2000; Schlesinger and Andrews, 2000). Soil respiration contributes 30 to 80% of the total respiratory efflux in most ecosystems (Davidson et al., 2002), and is thus considered a key component of the carbon cycle. Small changes in Rs can have a great effect on CO2 atmospheric concentrations and provide a potential positive feedback loop between increasing temperature and enhanced Rs that may ultimately accelerate global warming (Grace and Rayment, 2000; Schlesinger and Andrews, 2000; Sánchez et al., 2003; Rodeghiero and Cescatti, 2005). Understanding the mechanisms of, and potential changes to, the soil– atmosphere exchange of CO2 through Rs is a critical aspect of understanding ecosystem responses to climate change. Thus, measurements of Rs have become a pri-
4834
Afr. J. Biotechnol.
mary tool for terrestrial carbon cycling research (Savage et al., 2008). Boreal forests, which are very sensitive to climatic change (Gorham, 1991), are expected to be severely affected by global warming (IPCC, 2001). Boreal forests, containing roughly 40% of the world’s reactive soil carbon, an amount similar to that held in the atmosphere, play an important role in the global soil carbon pool (Melillo et al., 1993; McGuire et al., 1995; Schlesinger, 1997; Kasischke and Stocks, 2000). In the boreal forest ecosystem, the major factor influencing carbon absorption and emission is forest fires (Kasischke et al., 1995, 2000; Kasischke, 2000; McGuire et al., 2004; Czimczik et al., 2006). Frequent and serious forest fires have a significant effect on the carbon balance in the boreal forest (Kasischke et al., 1995; Kasischke and Stocks, 2000). The loss of soil carbon from the boreal forest during and after forest fires is not only the main determinant of the forest carbon balance (Harden et al., 2000), but is also one of the factors contributing to significant uncertainties in global carbon balance estimations (French et al., 2004). These uncertainties arise from the high heterogeneity of the soil, the differences in the soil environment (Ottmar and Sandberg, 2003) and the complexity of forest fires (Hinzman et al., 2003). Forest fires partially or fully burn the forest vegetation, resulting in huge changes to soil temperature (T), soil water content (W), soil microbial activities, roots, and Rs. The relationship between the quantification of these environmental factors and Rs plays an important role in the development of fire disturbance ecosystem response models (O'Neill et al., 2002a). Thus, the ecosystem of the boreal forest is a crucial area in understanding the effect of forest fire on soil respiration. China’s boreal forests are mainly located in the Da Xing’an Mountain. The main forest type in this region is the Larix gmelinii Rupr. forest, which accounts for over 70% of the area(Xu, 1998). The L.. gmelinii Rupr. forest ecosystem is important to China’s forest ecological, as well as in global changes and in the regional carbon balance; however, there have been few studies on Rs in the L. gmelinii Rupr. forest and results have been inconclusive (Gower et al., 2001; Wang et al., 2001). Based on fire statistics, 959 fires occurred in the Da Xing’an Mountain of Heilongjian from 1980 to 2009 and 6 2 the burn area was 2.89 × 10 hm , of which 1.47 × 6 2 10 hm was forest. Forest fire has become the major natural disturbance factor in the boreal forest ecosystem in China. The stands in this area selected for this current study have been exposed to the most representative and typical fires. Currently, studies on forest Rs in China mainly focus on the forests of the temperate and subtropical zones (Jiang and Huang, 1997; Liu et al., 1998; Ma et al., 2000; Sun et al., 2001; Zhang et al., 2007). Few studies have been performed on the Rs of forests at high latitudes. How does the forest fire influence the soil respiration is a key scientific problem.
In this study, ixed monitoring sample plots of forest areas burned at different intensities and neighboring unburned control areas, were assigned to measure effects of burning on Rs, T, W, and other indices throughout the growing season. What we tried to explain were as follows: (1) to quantify the dynamic characteristics of Rs, Ra and Rh in the L. gmelinii Rupr. forest throughout the growing season; (2) to study the effects of different intensities of fire disturbances on Rs and its components; and (3) to determine the relationship between Rs and T and W throughout the growing season before and after fires. Site This study site is located at the Nanwenghe Forest Ecosystem Research Station in Songling area of the Da Xing’an Mountain in Heilongjiang province of China. The station is in the southeast of the Da Xing’an Mountain at the southern foot of Yilehuli Mountain on the boundary of Songling. On the north is the Yilehuli Mountain, east of Ergenhe, and on the south is the Songling and the Jiagedaqi Forestry Bureau. Its geographical coordinates are 51°05′07″–51°39′24″ northern latitude and 125°07′55″–125°50′05″ eastern longitude. This stateowned forest covers a total area of 229,523 hm2 at 500– 800 m above sea level. It has a low-mountain hilly terrain with a broad valley. The climate zone of the site is cold temperate with a continental monsoon. The average annual temperature is -3°C and the extreme minimum temperature is -48°C. It has a 500 mm annual rainfall and 90 to 100 frost-free days. The soil in this area is brown coniferous forest soil. The forest type before the fire was a half-mature forest of Rhododendron L. gmelinii Rupr. The species composition was 10 Larch + Birch + Populus. In April 2006, a forest fire broke out in 798 high lands of the Kandu River in the Songling area of the Da Xing’an Mountain. The total burned area was 12 × 104 to 15 × 104 hm2, and the 4 2 burned forest area was over 5 × 10 hm . This study sample plot is located within the range of the fires. METHODS Sample plot description Areas that burned in April 2006 in serious, moderate or mild fires were selected for this study and the neighboring unburned sample plots were used as control plots. A total of 12 plots 20 × 20 m each, consisting of three sample plots and a control plot for each type of burn (serious, moderate or mild), were selected. Seriously burned areas were defined as having a tree death rate of 88.04% with fully burned undergrowth, dead soil covering and duff. The average blackened tree height in the seriously burned areas was 5.86 ± 0.8 m. In the moderately burned areas, the tree death rate was 64.60% and fully burned the dead soil covering and duff, though the color under the duff was unchanged. The average blackened tree height in these areas was 2.32 ± 0.4 m. In the mildly burned areas, the
Tan et al.
forest death rate was 23.91 and 5.0% of the undergrowth was burned out. The average blackened tree height was 1.45 ± 0.5 m.
Soil respiration measurement An LI-8100-103 Portable Survey Room was connected to the LI8100 Automatic Measuring System for Soil Carbon Flux (LI-COR Inc., NE, USA) to detect Rs. In early May 2010, 5 PVC soil rings, with an inner diameter of 19 cm and height of 7 cm, were randomly arranged in each sample plot. The PVC soil rings were pressed into the soil after one end was sharpened to reduce the suppression effect caused by the arrangement of the soil rings. The resultant height above ground for each soil ring was 2 to 3 cm and the position of each ring was kept unchanged during the measurement period. The first measurement was made 24 h after the arrangement of the soil rings was completed (Wang et al., 2002). The trench method was used to measure Ra (Bond-Lamberty et al., 2004). In early May 2010, four 50 × 50 cm quadrats were randomly set in the periphery of each fixed sample plot, 1 to 2 m from the border of the sample plot. The root zone was trenched (approximately 45 to 55 cm), and double-layer plastic sheets were used to divide the peripheral root system into enclosed quadrats. The living plants in the quadrats were carefully removed so that no living plants would be present in the quadrats during the measurement period. Finally, a soil ring was placed in each quadrat. The CO2 flux values of these quadrats was Rh, and the difference in the CO2 flux values between the trenched and the untrenched quadrats was Ra (Luo and Zhou, 2006). The root system contribution rate was the percentage of Ra account for Rs. Measurements were conducted each month from May to September 2010 for a total of five measurements. At the time of soil respiration measurement, an LI-8100 Self Soil Temperature Probe (P/N 8100-201) and an ECH2O-type EC-5 Soil Moisture Probe (P/N 8100-202) (Decagon Devices, Inc., Pullman, WA) were used to measure T and W at 5 cm soil depth. Data analysis The SAS 9.0 statistical software package (SAS Institute Inc., Cary, NC, USA) was used for data processing. ANOVA and multiple comparisons were conducted for Rs and Rh at different intensities and months. After log transforming Rs and Rh, a multiple regression analysis was conducted on Rs, ln(Rs), Rh, ln(Rh), T and W in order to establish a relationship model between soil respiration, T, and soil humidity. In addition, a residual inspection was conducted for all models to meet the statistical requirements.
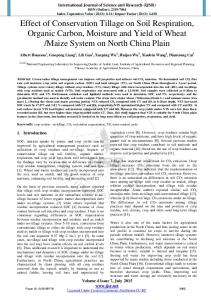
RESULTS Seasonal dynamics of Rs after different intensities of fire disturbances In the burned sample plots with three burn different intensities and unburned control areas, the seasonal dynamics of Rs and Rh throughout the growing season shows a single peak trend (Figure1). The Rs’s of the burned sample plots were significantly less than those of the control plots (α = 0.05) for every month. The maximum Rs occurred in July for every sample plot; the minimum Rs occurred in September for all sample plots except for the mild burn intensity plot, in which the minimum Rs occurred in May (Figure 1). Effects of fire intensity showed seasonal dynamics. The
4835
Rs’s of the plots with the same fire intensity showed significant seasonal dynamics (α = 0.05) (Figure 1). The seriously burnt sample plots exhibited the maximum seasonal effect, with the respiration rate in July being 5.7 times that in May. The moderately burnt sample plot exhibited the smallest seasonal effect, with a 3.4 fold greater respiration rate in July 3.4 than in May. The respiration rates of the control and mildly burnt sample plots in July were 3.6 times greater than in May. For every month examined, burn intensity had a significant effect on Rs (Figure 1). The Rs’s in descending order for each month are as follows: in May and June: control >moderate >mild >serious; in July and August: control >moderate >serious >mild; and in September: control >mild >moderate >serious. For all sample plots, the burn intensity effect was greatest in September when the Rs of the control plot were 2.5 times that of the seriously burnt sample plot. The effect was least in July when the Rs of the control sample plot were 1.4 times that of the mildly burnt sample plot. Based on the average respiration rate throughout the entire growing season, the Rs’s in descending order are as follows: control >moderate >mild >serious. The Rs of the control sample plot was 1.45 times that of the seriously burnt sample plot (Table 1). Seasonal dynamics of soil intensities of fire disturbances
Rh
after
different
The maximum Rh of the control plot occurred in June and all other sample plots peaked in July. The minimum Rh occurred in September for all plots (Figure 1). These results indicate significant synchronization of Rs with Rh (Figure 1). Throughout the entire growing season, the Rh of the control plot was higher than that of all burned sample plots. However, except for June and September, the differences between the control and burnt plots were not significant (α = 0.05) (Figure 1). Seasonal effects on Rh were seen in all burn intensity plots. The seriously burnt sample plot showed the highest seasonal effects. The difference between the Rh of the month with maximum values and the month with the minimum values was almost 8.8 fold. The mildly burnt sample plot had the smallest seasonal effect with a maximum difference of 3.4 for (Figure 1). Burn intensity affected Rh. The Rh values for each burn intensity averaged over the entire growing season ranked as follows: control >mild >moderate >serious. The one exception was in May and August, the Rh of the moderately burnt plot was slightly higher than that of the mildly burnt plot (Figure 1).The Rh values for the all four burn intensities plots were in the range of 3.25 to -2 -1 5.13 μmol·m ·s . Estimate of Ra and Rc An abnormal value in the seriously burnt sample plot
4836
Afr. J. Biotechnol.
Figure 1. The seasonal dynamics of Rs and Rh after different intensities of fire disturbances in Larix gmelinii forest.
Table 1. Average Rs, Rh, Ra, Rc for all burn intensities over the entire growing season.
Fire intensity Serious Moderate Mild Control
Rs (μmol·m -2·s-1) Mean SE 4.64A 0.37 AB 5.13 0.36 4.81AB 0.29 6.72B 0.36
Rh (μmol·m -2·s-1) Mean SE 3.25A 0.32 AB 4.32 0.32 4.36AB 0.27 5.13B 0.46
Ra (μmol·m -2·s-1) Mean SE 1.39AB 0.39 AB 0.81 0.35 0.46A 0.32 1.59B 0.31
Rc (%) Mean 30.34A BC 11.76 7.96C 24.34AB
SE 5.94 6.75 5.55 3.26
A, B and C signifies significant differences between different fire intensities (α = 0.05).
-2
-1
appeared in May, when the Rh (1.42 μmol·m ·s ) was higher than the Rs (1.32 μmol·m-2·s-1) (Figure 1). Thus, the data in June to September were used to estimate Ra and root respiration contribution (Rc) (Table 1). The average Ra values throughout the growing season are listed in descending order: control > serious >moderate >mild. The Ra of the control sample plot was 3.5 times that of the mildly burnt sample plot. The rank of burn intensity Rc values differed slightly from the rank of burn intensity RA values. Burn intensities, in descending
order of Ra values, were: serious (24.1 to 42.2%) >control (10.7 to 33.0%) >moderate (10.5 to 20.1%) >mild (0.7 to 14.2%) (Table 1). No consistent rule was observed for the Rc in the four sample plots (Table 1). Relationship between Rs, T, and humidity In this study, the natural logarithms of Rs and Rh were fit to T and W because correctional multiple correlation
Tan et al.
4837
Table 2. Multivariable linear regression model among Rs/Rh, T and W
Fire intensity
Adj R-Sq
P>F
Percentage explained
0.6634 0.7687 0.4337 0.6056