kg) accommodated in a clay-graphite crucible with diameter of 150 mm. .... This work is performed within the Ultramelt Project supported by the EPSRC Grants ...
Effect of input power and temperature on the cavitation intensity during the ultrasonic treatment of molten aluminium I Tzanakis1, G S B Lebon2, D G Eskin1, K Pericleous2 1) Brunel Centre for Advanced Solidification Technology (BCAST), Brunel University, Uxbridge, Middlesex, UB8 3PH, UK 2) Centre for Numerical Modelling and Process Analysis, University of Greenwich, London, SE10 9LS, UK
Abstract Experimental results of ultrasonic processing of liquid aluminium with a 5 kW magnetostrictive transducer and a 20 mm titanium sonotrode excited at 17 kHz are reported in this study. A unique high-temperature cavitometer sensor, placed at different locations in the liquid melt, measured cavitation activity at various acoustic power levels and different temperature ranges. The highest cavitation intensity in the liquid bulk is achieved below the surface of the sonotrode, at the lowest temperature and when the applied power was 3.5 kW. This two-fold mechanism is related to a) acoustic shielding and b) the tendency of liquid aluminium to release hydrogen when the temperature drops, thus promoting multiple cavitation events. Understanding these mechanisms in liquid metals will result in a major breakthrough for the optimization of ultrasound applications to liquid metal processing. Keywords: Ultrasonic treatment, metallic alloys, cavitation bubbles, frequency spectrum, acoustic pressure 1. Introduction Ultrasonic treatment of liquid metallic alloys is closely related to cavitation and bubble dynamics and has been proven effective and promising in degassing and structure refining of metallic alloys [1]. Ultrasonic vibrations are transmitted to a liquid metal and generate large instantaneous pressures and temperature fluctuations in the melt, creating special local conditions and influencing the solidification process. The introduction of a sufficient amount of acoustic energy into the melt sets up cavitation: the negative pressures within the melt are large enough to initiate bubble formation. Cavitation is the formation, growth, oscillation, collapse, and implosion of bubbles in liquids [2]. In the vicinity of collapsing bubbles, extreme temperatures (>10000 K) [3], pressures (>400 MPa) [4], and cooling rates (>1011 K/s) [5] occur. To establish a condition where cavitation occurs, a peak to peak amplitude of about 10 µm at 20 kHz, corresponding to acoustic pressures of greater than 0.5 MPa at frequencies of 20 kHz, is required [1, 6]. Despite decades of research, the solidification process under the effect of ultrasonic vibration is still not clear, as most studies have been phenomenological rather than quantitative. In this paper, the main parameters of ultrasonic processing, such as casting temperature, ultrasonic intensity, and the distance from the sonotrode, have been investigated. An in-depth understanding of these mechanisms in liquid metals will result in a major breakthrough for the optimization of ultrasound applications in liquid metal processing. 2. Methodology
The ultrasonic equipment consisted of a 5 kW magnetostrictive transducer (Reltec, Russia) with a Ti sonotrode of 20 mm in diameter. Experiments were performed at a driving frequency of 17 kHz for various temperatures and power inputs ranging from 780 °C to 690 °C and 2 to 4.5 kW, respectively. The sonotrode was preheated and submerged to a depth of 20 mm below the melt surface. The Al charge was heated up to 780 °C with an electric furnace. The melt volume was approximately 2 l (5.2 kg) accommodated in a clay-graphite crucible with diameter of 150 mm. The liquid level in the vessel
was at 110 mm. The melt temperature was continuously monitored by a K-type thermocouple. There was no controlled atmosphere, and each experiment was repeated several times to ensure reproducibility of results. The intensity of cavitation was directly measured with a high-temperature calibrated cavitometer. The cavitometer used in this study is designed for immersion into molten metals. It consists of a tungsten probe with a diameter of 4 mm and length of 500 mm, connected to a piezoelectric receiver mounted within a metallic enclosure (Belorussian State University of Informatics and Radioelectronics). A full account of the cavitometer can be found in [7]. Cavitometer was placed either at an angle under the sonotrode or straight down near the wall of the crucible (about 75 mm off the sonotrode axis), with the cavitometer’s probe submerged at 70 mm below the liquid free surface as schematically shown in Fig 1.
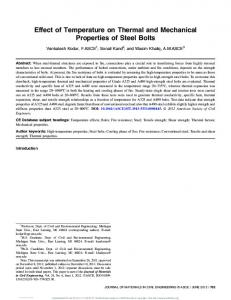
2-4.5 kW
Sonotrode
Transducer Cavitometer
Cavitometer
Molten Al
Crucible
Figure 1: A photograph and a principle diagram of the experimental test rig.
Signal acquisition and processing was carried out using a dedicated external digital oscilloscope device (Picoscope) that allowed real-time signal monitoring of the cavitometer sensor’s data and ultrasonic parameters. The raw voltage signal was transformed to the frequency values via a Fast Fourier Transform. A total of 1000 waves were analysed in each of the points of interest. 3. Experimental results In this section we look at which parameter plays more important role during sonication of liquid Al. The effect of acoustic energy on the cavitation intensity is shown in Fig. 2. Six power settings were used during experiments in the range of 2-4.5 kW corresponding to peak-to-peak amplitudes from 20 to 52 µm respectively. Two different runs were performed in two temperature ranges i) 765 to 740 0C, ii) 735 to 710 0C with the highest temperature within each range corresponding to 2.5 kW and the lowest at 4.5 kW. Figure 2 demonstrates that an increase in power input does not result in an equivalent increase in cavitation activity. It can be clearly seen that maximum intensity value is obtained at 3.5 kW (39 µm peak-to-peak) for all the cases. The reason for this may be shielding and scattering of acoustic waves and energy due to the formation of bubbly clouds especially in the region below the sonotrode. On the one hand, after a certain input of acoustic power, bubble structures become developed facilitating shielding effects: thus intensity is dropped. This is a well-known effect [8]. On the other hand, at a higher transducer power, i.e. 3.5 kW, powerful acoustic streamers push the bubbly clusters further downwards, opening a way for the formation of new cavitation bubbles and allowing existing bubbles to migrate deeper into the bulk of the liquid. It is a trade-off between acoustic power, number of bubbles, displacement of bubbles from the streamers and cavitation intensity. These results are in a good agreement with recent X-ray imaging observations where numerous cavitation bubbles were seen to sustain for long periods of time in the bulk liquid before they disappear [9].
Peak%to%peak%Amplitude%(μm)% 14# 16# 18# 20# 22# 24# 26# 28# 30# 32# 34# 36# 38# 40# 42# 44# 46# 48# 50# 52# 650#
Cavita4on%Intensity%(mV)%
600# 550# 500# 450#
Temperature%Range%765D740%°C%
400# Temperature%Range%735D710%°C%
350# 300# 1.5#
2#
2.5#
3#
3.5#
4#
4.5#
Acous4c%Power%(kW)%
Figure 2: Cavitation intensity measured under the sonotrode vs transducer power for two temperature ranges (17-kHz magnetostrictive transducer, Ti sonotrode with a 20 mm diameter tip, able to produce tip displacement amplitudes up to 52 microns p-p. Sonotrode was submerged 20 mm below the melt surface). 140"
Cavita&on)Intensity)(mV))
120" 100" 80" 60" 40"
I"="$0.02T2"+"28T"$"9806" " R²"="0.98"
20" 0" 680"
700"
720"
740"
760"
Temperature)(0C))
780"
800"
Figure 3: Cavitation intensity measured near the crucible wall, 150 mm from the sonotrode. Sonotrode was submerged 20 mm below the melt surface the transducer power was 3.5 kW.
In Figure 3, the effect of temperature on the cavitation intensity is shown for the measurements performed at a distance from the acoustic source (sonotrode), i.e. close to the crucible wall. For the same power level (3.5 kW) and similar temperature regimes to those shown in Fig. 2, cavitation intensity is significantly lower. Thus, it can be deduced that cavitation intensity decreases with the increasing distance from the acoustic source. Specifically, for the same power output at 3.5 kW and similar temperature, e.g. 750 °C, cavitation intensity drops by about 85%. Cavitation intensity shows a very good second order polynomial correlation with temperature T, which can be expressed as follows. 𝐼 = −0.02𝑇 ! + 28𝑇 − 9806 (1) A comparison of the tested parameters was conducted in order to estimate their impact on the cavitation intensity. This was achieved by comparing the measured cavitation intensities at extreme
values of the variable parameters, i.e. i) at 2 and 3.5 kW power input (20 and 52 µm p-p acoustic amplitude), ii) \t 750 and 700 °C and iii) at under sonotrode and close to the wall. This was calculated using the following expression (Eq. 2):
𝐼!"# =
!! !!! !!
· 100 [%]
(2)
where Iint is the percentage of change)of the cavitation intensity between the lowest Ii and the highest I0 values of the variable parameters. Amplitude* 12%*
Temperature* 14%*
Distance* 74%*
Figure 4: Percentage of influence of the distance from the sonotrode, acoustic amplitude (power input) and the melt temperature on the cavitation intensity in liquid Al.
Fig. 4 shows the percentage of influence the distance from the source, the acoustic amplitude and the melt temperature has on the intensity of cavitation within a liquid Al melt. The higher the percentage, the greatest is the impact on the cavitation regime. Cavitation intensity is mainly influenced by the distance from the source (74%) rather than the melt temperature or the input power to the melt, both having similar influence percentages of 14% and 12%, respectively. 4. Conclusions The measurements of cavitation intensity during ultrasonic melt processing allowed us to establish an essential relationship between the effective distance, the input power, the melt temperature and the cavitation development. Quantitative analysis of the effect of ultrasonic amplitude showed that there is an optimum setting (at 3.5 kW) where bubbly structures and acoustic amplitude find a physical balance and cavitation intensity acquires maximum values. With a temperature drop a more intense cavitation regime is generated. Distance plays a predominant role in propagation of cavitation in liquid Al alloy.
Acknowledgments: This work is performed within the Ultramelt Project supported by the EPSRC Grants EP/K005804/1 and EP/K00588X/1. References 1. G.I. Eskin, D.G. Eskin “Ultrasonic treatment of light alloy melts” Second Edition, Series: Advances in Metallic Alloys, CRC Press, 2014. 2. T. G. Leighton “The acoustic bubble”, Ed. Academic Press, London, 1994. 3. D. J. Flannigan, K. S. Suslick “Plasma formation and temperature measurement during singlebubble cavitation “Nature 434 (2005) 52-55. 4. I. Tzanakis, D.G. Eskin, A. Georgoulas, D. Fytanidis “Incubation pit analysis and calculation of the hydrodynamic impact pressure from the implosion of an acoustic cavitation bubble.” Ultrasonics Sonochemistry 21 (2014) 866–878. 5. A. Gedanken “Using sonochemistry for the fabrication of nanomaterials” Ultrasonics Sonochemistry 11 (2004) 47–55 6. S. Komarov, K. Oda, Y. Ishiwata, N. Dezhkunov “Characterization of acoustic cavitation in water and molten aluminium alloy” Ultrasonics Sonochemistry, 20 (2013) 754–761. 7. I. Tzanakis, M. Hodnett, B. Lebon, N. Dezhkunov, D.G. Eskin “Calibration and performance assessment of an innovative high-temperature cavitometer” Ultrasonics Sonochemistry (Under Review) 8. L.D. Rozenberg, in “Powerful Ultrasonic Fields”, Part VI Cavitation Region, Nauka, Moscow, 1968, pp. 221-266. 9. W. W. Xu, et al. TMS2015 Annual Meeting Supplemental Proceedings, Wiley/TMS, Hoboken (NJ), 2015, pp. 61–66.