2216
IEEE TRANSACTIONS ON GEOSCIENCE AND REMOTE SENSING, VOL. 45, NO. 7, JULY 2007
Effect of the Oxygen Line-Parameter Modeling on Temperature and Humidity Retrievals From Ground-Based Microwave Radiometers Maria P. Cadeddu, Vivienne H. Payne, S. A. Clough, K. Cady-Pereira, and James C. Liljegren
Abstract—The Atmospheric Radiation Measurement (ARM) Program maintains a suite of instruments in various locations to provide continuous monitoring of atmospheric parameters. Temperature and humidity retrievals are two of the key parameters used by the climate-modeling community. Accuracy in the spectroscopy adopted by the various radiative transfer models is crucial for obtaining accurate retrievals. While the accuracy of the spectroscopic parameters used for water-vapor retrievals is satisfactory, temperature retrievals continue to be affected by uncertainties in oxygen line parameters leading to discrepancies between the modeled and observed brightness temperatures. In this paper, we compare the model calculations in the oxygen-band channels with the measurements collected by the ARM-operated 12-channel Microwave Radiometer Profiler (MWRP). The dataset used spans a wide range of atmospheric temperature conditions, with ground temperatures varying between −40 ◦ C and +20 ◦ C. Model calculations are performed by using line parameters from the high-resolution transmission molecular-absorption (HITRAN) database and from a set of newly published parameters. Our comparison shows that the newly published parameters agree more closely with the MWRP measurements and confirms the need to update the HITRAN database for the oxygen lines. We show the effect of line parameters on the retrievals of temperature, water vapor, and liquid water, and show that improved oxygen absorption is essential to reduce the clear-sky bias in the liquid-water path retrievals. Index Terms—Microwave radiometry, oxygen absorption, temperature retrieval, water-vapor retrieval.
I. I NTRODUCTION
A
S PART of the ongoing effort to improve cloud and climate modeling, the Atmospheric Radiation Measurement (ARM) Program (www.arm.gov) operates several facilities that provide continuous data streams from a number of instruments. Among them, a suite of radiometers offers continuous monitoring of atmospheric microwave emissions at several sites. The Microwave Radiometer Profiler (MWRP) has five channels in the water-vapor absorption region (22.235, 23.035,
Manuscript received June 1, 2006; revised November 17, 2006. This work was supported by the Climate Change Research Division, U.S. Department of Energy, Office of Science, Office of Biological and Environmental Research under Contract DE-AC02-06CH11357, as part of the Atmospheric Radiation Measurement Program. Argonne National Laboratory is operated by UChicago Argonne, LLC for the U.S. Department of Energy. M. P. Cadeddu and J. C. Liljegren are with the Argonne National Laboratory, Argonne, IL 60439 USA (e-mail:
[email protected]). V. H. Payne, S. A. Clough, and K. Cady-Pereira are with Atmospheric and Environmental Research (AER), Inc., Lexington, MA 02421 USA. Digital Object Identifier 10.1109/TGRS.2007.894063
23.835, 26.235, and 30.000 GHz) and seven channels (51.250, 52.280, 53.850, 54.940, 56.660, 57.290, and 58.800 GHz) in the oxygen-absorption region of the microwave spectrum. Radiative transfer models used to retrieve temperature, precipitable water vapor (PWV), and liquid-water path (LWP) from measurements of brightness temperatures (BTs) play a crucial role in the data analysis. ARM-provided PWV and LWP retrievals are widely used by the scientific communities for the validation of satellite-based retrieval algorithms, comparisons with other ground-based instruments, and input to radiative flux models. Temperature and humidity profiles retrieved from the MWRP rely on the Rosenkranz model [1] modified by Liljegren et al. [2]. The Rosenkranz-modified model is referred to as the R98-mod model in the remainder of this paper. On the other hand, PWV and LWP retrievals from the two-channel MWR (21.83 and 31.4 GHz) are performed by using the radiative transfer code MonoRTM from [3] and [4], which relies on the spectral information derived from the high-resolution transmission molecular-absorption (HITRAN) database [5] and the line-mixing parameters from [6]. The HITRAN database is widely used by the scientific community for radiative transfer computations. However, unlike the millimeter-wave propagation model (MPM) [7] and the R98-mod models validated in, for example, [8] and [9], the HITRAN database, in the region of the microwave oxygen absorption, has never been systematically validated by the comparison of the modeled and measured BTs. The advantages of using the ground-based versus satellite measurements to perform model validations reside in the fact that, with the ground-based instrumentation, calibration issues are much easier to identify. In addition, it is easier to identify cloud contamination in the field of view of the radiometer. The oxygen-absorption spectrum features a number of spectral lines in the 50–70-GHz band. The close spacing of these lines means that the simulated BTs are highly sensitive to the treatment of line mixing in the model. The effect of uncertainties in line-mixing parameters on the modeled BTs has been recently examined in [10]. The conclusions of the authors are that spectroscopic errors in this frequency region can lead to errors of a few degrees in computed BTs and that dry atmospheres would be most impacted. The Arctic region is well known for its extremely dry and cold conditions, with temperatures well outside the range of experimental laboratory measurements and high surface pressure; therefore, it is expected that uncertainties in the oxygen model would mostly affect the retrievals at this location.
0196-2892/$25.00 © 2007 IEEE
CADEDDU et al.: EFFECT OF THE OXYGEN LINE-PARAMETER MODELING
2217
The objective of this paper is the validation and potential improvement of the spectroscopy associated with the oxygen absorption for the purpose of increasing the accuracy of temperature-profile retrievals. Two different sets of oxygen line parameters are analyzed. One set consists of the parameters in the HITRAN database together with the line-mixing coefficients from Hoke et al. [6] (H04 in the remainder of this paper); the second is a set of recently published parameters by Tretyakov et al. [11] (hereinafter referred to as T05) derived from the laboratory measurements. MWRP measurements are used to identify the inadequacies of the HITRAN parameters and to show how they affect the temperature retrievals. We reexamine the PWV and LWP retrievals and assess the effect of the oxygen-model uncertainties. This paper is organized as follows. First, we compare the formulation of line parameters in the two databases in an attempt to isolate the sources of discrepancies. We compute the BTs by using the radiative transfer code MonoRTM with the two sets of oxygen parameters. We then compare the model computations with the measurements collected by the MWRP. Finally, we examine the impact of the parameters on the temperature retrievals from the MWRP and on the PWV and LWP retrievals from the MWR measurements. II. L INE P ARAMETERS The oxygen complex in the microwave region spans 0–120 GHz with strong absorption features at 0, 60, and 120 GHz. As a result of collision broadening, the single lines are blended to form an overlapped absorption band. The shape of the individual line α(ν) is therefore determined by the linewidth coupled with the effect of the off-diagonal terms Yj called mixing coefficients α(ν) ∝
! j
Sj
"
ν νj
#2 $
% γj −(ν + νj )Yj γj + (ν −νj )Yj + . (ν −νj )2 + γj2 (ν + νj )2 + γj2
(1)
In (1), Sj (T ) is the line intensity (or strength), ν is the frequency, and γj is the line half-width. Values for Sj (T ), γj , and Yj are usually based on the laboratory measurements and the theoretical computations and are stored in the spectral databases. Line strengths in the oxygen band are known with an accuracy of 2%, and various models agree with each other within this range of accuracy. The line half-width is a function of temperature and pressure γair (P, T ) = γ0,air
"
P P0
#"
T0 T
#X
(2)
where X is the temperature dependence of the width, assumed to be 0.8 in T05 and 0.71 in H04. Temperature and pressure dependences of line-mixing coefficients Yj are usually expressed as Yair = yT,air
"
P P0
#"
T0 T
#X
(3)
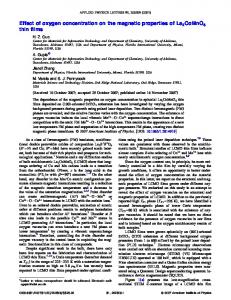
Fig. 1. Broadening parameters for the oxygen-band lines as specified in the H04 database (filled black circles) and the T05 model (squares) at T = 296 K. (Left panel) Air-broadening. (Right panel) Self-broadening.
where yT,air can be a function of temperature as well. In the T05 model, the temperature dependence is expressed as # " T0 −1 (4) yT,air = y0,air + b T where y0,air and b are the tabulated coefficients for each transition. In the H04 model, Yair is explicitly calculated at four temperatures (T = 200, 250, 296, and 340 K) and linearly interpolated in the log temperature for the intermediate temperatures. The two oxygen-absorption models analyzed in this paper use different spectral databases. The HITRAN database uses strengths and half-widths specified in [12] and [13]. Since the HITRAN database does not include the line-mixing coefficients, these coefficients are taken from [6]. This combination is the model referred to as H04. The T05 model is based on the HITRAN line intensities, new linewidth, and mixing-coefficient measurements. The pressure air- and self-broadening parameters in the two models at T = 296 K are shown in Fig. 1. For the T05 models, air-broadening parameters, computed as 0.21γO2 + 0.79γN2 , are taken from [11, Table 5] and converted to T = 296 K. Self-broadening coefficients for R-branch transitions (N −) higher than N = 25 are linearly extrapolated from the tabulated values in [11, Table 1]. The H04 broadening coefficients are asymmetric around N = 0 and lower than those provided in T05. R-branch transitions higher than N = 25 in the H04 database are not extrapolated. The consequence is that the air-broadening coefficients of T04 are lower than T05 in the proximity of the center and higher than T05 in the proximity of the tail of the absorption band. Differences between the two sets of broadening coefficients as a function of temperature are shown in Fig. 2. The temperature dependence is computed according to (2) by using X = 0.71 for H04 and X = 0.8 for T05. The eight frequencies shown correspond to the transitions N = 33−, 35−, 31−, 29−, 25−, 23−, 21−, and 19−, and they are in the proximity of the first four MWRP channels at 51.250, 52.280, 53.850, and 54.940 GHz. Operational satellite-based MWRs, such as the Advanced Microwave Sounding Unit-A,
2218
IEEE TRANSACTIONS ON GEOSCIENCE AND REMOTE SENSING, VOL. 45, NO. 7, JULY 2007
Fig. 4. Temperature dependence of mixing coefficients (in 1/105 Pa) computed for the T05 (black circles and open squares) and H04 (diamonds and crosses) models. Fig. 2. Differences between the T05 and H04 air-broadening parameters as a function of temperature. The differences derive from the temperature dependence of the linewidth. The eight frequencies shown are in the proximity of the first four channels of the MWRP.
Fig. 3. Mixing coefficients (in 1/105 Pa) for the oxygen-band lines in the H04 (black filled circles) and T05 (filled squares) models.
use similar frequencies for the retrievals of atmospheric temperature. Fig. 2 shows that differences between the line broadening coefficients increase at lower temperatures. Line-mixing coefficients at four temperatures are shown in Fig. 3. Again, mixing coefficients from [6] (H04) are lower than those provided in T05. Fig. 4 shows the temperature dependence of the mixing coefficients. Temperature dependence for the T05 model was computed starting from the tabulated values provided in [11]. Values at three temperatures (200, 250, and 300 K) are shown in Fig. 4 to represent the temperature dependence of the H04 parameters. The eight frequencies shown in Fig. 4 are the same as that shown in Fig. 3. From Figs. 1–3, it is evident that the first four MWRP channels (the most transparent) are in the region of the highest discrepancy between the two models for both the linewidth and mixing coefficients. The next section shows how these differences affect the BT simulation.
III. M EASUREMENT -M ODEL C OMPARISON A. MWRP Instrument and Calibration The MWRP data analyzed here were collected at the ARM North Slope of Alaska (NSA), Barrow site, in 2004 and 2005. The radiometer is the TP/WVP-3000 developed and built by Radiometrics Corporation (www.radiometrics.com). The radiometer has been operating at the NSA site since January 2004. At each frequency, the signal voltage resulting from a sky measurement is transformed to a BT according to the expression TB = Tref − G−1 (Vref − Vsky ), where Tref is the near ambient temperature of an internal blackbody reference target, and Vref is the signal voltage resulting from a measurement of the reference target. G is the radiometer gain given by G = (Vref+nd − Vref )/(Tref+nd − Tref ), where Tref+nd and Vref+nd are the temperature and the signal voltage, respectively, obtained by adding a noise injection temperature Tnd from a calibrated noise diode. Calibration of the effective noise diode is performed each year by using a liquid-nitrogen (LN2 ) target. A Styrofoam container filled with LN2 is placed on top of the radiometer, and alternating measurements of the near ambient internal and cold external targets are taken for up to an hour or until condensation forms on the bottom of the Styrofoam container. In a preliminary evaluation performed by Liljegren [14], the calibration accuracy of the V-band channels was found to be within 2 K for all channels. All channels were found to be stable except for the 51.25- and 52.28-GHz channels, which were found to drift with time. A semiannual calibration was deemed sufficient to maintain stability. Because of logistic difficulties, the radiometer at the NSA is calibrated only once a year. This could cause a higher uncertainty in the instrument’s calibration. The MWRP was calibrated on January 30, 2004; on April 12, 2005; and on April 13, 2006. In Fig. 5, the monthly mean differences between the measured and modeled BTs are shown. The measurement-model difference is stable (within ±1.2 K) for all channels except for the one at 51.25 GHz that appears to have been drifting since December 2004. The calibration performed on April 2006 brought the difference back to where it was during the first 11 months of 2004.
CADEDDU et al.: EFFECT OF THE OXYGEN LINE-PARAMETER MODELING
Fig. 5. Monthly averages of measured-minus-modeled (T05) BTs from February 2004 to May 2006. The dates indicate when calibration was performed. The channels are 51.25 (circles), 52.28 (squares), 53.85 (triangles), and 54.94 (diamonds) GHz.
To avoid uncertainties due to drift in calibration, the remainder of this paper considers only the data collected during the year 2004 and the months of April through June 2006.
2219
Fig. 6. Scatter plots of measured (x axis) and computed BTs for N = 137 cases at the NSA. Circles are simulations with the H04, and “X” are simulations with the T05 model (see Table I for slope, intercept, and correlation information). TABLE I SLOPES, INTERCEPTS, AND CORRELATION COEFFICIENTS RELATIVE TO FIG. 6 (N = 137)
B. Model Computations Radiosondes Vaisala RS90 were used as an input to the model computations. Data from a colocated dual-channel MWR were used to eliminate cloudy conditions. The MWR has two channels at 23.835 and 31.4 GHz that are sensitive to the presence of PWV and LW. Data were rejected when the standard deviation of a 30-min data segment was greater than 0.3 K in both channels. The Wintronics KT-19 infrared thermometer located on top of the MWRP was used to additionally screen segments that passed the first screening procedure. A temperature threshold of T = 224 K was set to identify the liquidcloud-free conditions. The final screened dataset consists of 137 radiosondes profiles. BT simulations were carried out with the original H04 and the T05 spectral parameters (after conversion to HITRAN units). The results are shown in Fig. 6. It is noticeable from the comparison that there are large discrepancies between the two models at the two lowest frequencies. The H04 model returns the BTs lower than observed at 51.25 GHz. The statistical information of the comparison is shown in Table I. It is apparent that, for the two most transparent channels, slopes of 1.15 and 1.24 for the H04 model are unsatisfactory. For the 51.25-GHz channel, the T05 model shows a definite improvement in both slope and intercept. For the 52.28-GHz channel, the T05 model shows an improved slope and intercept (1.08 and −9.5); however, the modeled BTs are generally higher than the observed ones. For the remaining channels, the two models have comparable results, both being in acceptable agreement with the measurements, as shown later. Frequencies at 56.66 GHz and above are opaque, and atmospheric layers immediately above the radiometer contribute strongly to the observed BT. Differences between the models at these opaque frequencies are negligible; therefore, this analysis is concerned
with the model performances at the four more transparent frequencies (51.25, 52.28, 53.85, and 54.94 GHz). Fig. 7, top and middle panels, shows the simulated spectra for an Arctic standard winter atmosphere at frequencies between 20 and 150 GHz for the down-looking (assuming a surface emissivity ε = 0.6) and up-looking views, respectively. The surface emissivity of 0.6 was chosen as the representative of snow-covered ground in this frequency range. The bottom panel shows the differences between the BTs simulated with H04 and T05 for the two viewing configurations. The differences are more pronounced in the window region and in the wings of the oxygen-absorption band. The sign of the difference varies depending on the frequency. In the 20–40-GHz region, the T05 parameters produce BTs about 10% larger than those produced by H04 for the up-looking simulation. On the other side, in the 80–110-GHz region, the opposite is true. Large differences are also observed in the wing of the 118-GHz line that corresponds to the quantum transition with N = −1. This can be attributed to the large difference in the linewidth between the two formulations, as shown in Fig. 1. We will examine
2220
IEEE TRANSACTIONS ON GEOSCIENCE AND REMOTE SENSING, VOL. 45, NO. 7, JULY 2007
TABLE II MEAN AND STANDARD DEVIATION OF MEASURED-MINUS-MODELED BTS (N = 137)
Fig. 7. (Top two panels) BT for a standard Arctic atmosphere simulated with H04 (solid) and T05 (dashed) parameters for a down-looking (top panel) and up-looking (middle panel) views. The down-looking simulation assumed a surface emissivity ε = 0.6. (Bottom panel) BT difference (H04–T05) for the down-looking (solid line) and up-looking (dashed line) views.
the T05 model shows a higher bias in this channel. A more detailed discussion on this bias follows in the next section. From this comparison, it appears that the adjustments in the linewidths and mixing coefficients proposed in T05 improve the agreement with the measurements. The 53.85-GHz channel has biases of 1 and −1.5 K for the H04 and T05 models, respectively. In Table II, the residuals for the two models at the seven frequencies are displayed. D. Comparison With Ground-Based Scanning-Radiometer (GSR) Measurements
Fig. 8. Measured-minus-modeled BTs as a function of surface temperature. The models are H04 (filled circles) and T05 (open squares).
the consequence of these differences on the PWV and LWP retrievals in Section V. C. Comparison With MWRP Measurements In Fig. 8, the differences between the measured and modeled BTs are shown as a function of surface temperature. Differences between the measurements and simulations carried out with the H04 parameters display marked temperature dependence in the first two channels. Since differences in the line-mixing coefficients between the two models (Fig. 4) increase at lower temperatures, it is possible to speculate that the strong temperature dependence of the residuals in the first two channels for the H04 model, shown in Fig. 8, could be due to an inadequate temperature dependence of the width and mixing coefficients. On the other hand, residuals obtained from the computations performed with the T05 parameters do not display any temperature dependence on the 51.25-GHz channel and a weaker dependence in the 52.28-GHz channel. However,
The large bias of −3 K in the T05 model for the 52.28-GHz channel could be due to the errors in the spectroscopic parameters, to the instrument calibration in this channel, or to the combination of these factors. If further evidence existed suggesting that the bias was due to the spectroscopic parameters rather than the instrument calibration, it would be possible to adjust the parameters in order that the model provides a better fit to the measurements. An analysis has been performed on the additional data from another radiometer with channels in the 50–60-GHz region that is the GSR [15]. This instrument has seven channels between 50 and 56 GHz and is calibrated by tip curves at the most transparent channels. The GSR was situated at the NSA, Barrow site during March and April 2004, and it therefore provides an independent set of measurements to compare with those provided by the MWRP. Mean model/measurement BT differences in the MWRP and GSR channels are shown in Fig. 9. The results for the GSR are consistent with those obtained for the MWRP at all channels, except at 52.28 GHz, indicating that it would not be possible to adjust the spectroscopic parameters to improve the model/measurement agreement at this frequency without degrading the agreement in the GSR channels at 52.265 and 53.29 GHz. The evidence strongly suggests that the large bias for the MWRP 52.28-GHz channel is related to the instrument calibration. Simulations were also performed with the R98-mod models. The results are shown in Fig. 10 and Table II and are in good agreement with T05 in this spectral region. IV. R ETRIEVALS OF T EMPERATURE P ROFILES One of the main motivations for evaluating the oxygen line parameters in the radiative transfer models is the improvement
CADEDDU et al.: EFFECT OF THE OXYGEN LINE-PARAMETER MODELING
Fig. 9. Differences between the measured and modeled BTs for the MWRP and the GSR. (Top panel) Computations are with the H04 parameters. (Bottom) Computations are with the T05 parameters. Vertical bars indicate one standard deviation.
2221
Fig. 11. Bias (retrieved radiosonde) and standard deviation of 63 winter temperature profiles at the NSA. Dotted lines are the first guess, solid lines are T05, and dashed lines are H04. The dotted-dashed line is the standard deviation of the retrieval noise.
Fig. 10. Differences between the measured and modeled BTs for the MWRP using the R98-mod parameters. Vertical bars indicate one standard deviation.
of retrievals of vertical profiles of temperature. We retrieve the clear-sky temperature profiles between 0 and 10 km, with the seven V-band channels of the MWRP by optimal estimation [16]. The vertical resolution of the retrieval grid is 100 m between 0 and 1 km, and 250 m between 1 and 10 km. A statistical ensemble of radiosondes soundings and its covariance were used as a statistical constraint. The covariance matrix of the measurement errors was assumed to be diagonal with elements equal to 2 K. The temperature profile was retrieved from the BT observations by successive iterations that rapidly converged toward the final solution. The first-guess profiles of temperature and humidity were obtained by the linear statistical regression from the MWRP measurements. Sixty-seven clear-sky winter cases at the NSA were selected to test the effect of model parameters on retrievals. Convergence was usually achieved at the second iteration. The bias (retrieved minus radiosonde) and standard deviation of the retrievals are shown in Fig. 11 with the T05 parameters (solid line) and with the original H04 parameters (dashed line). The dotted lines are the bias and standard deviation of the ARM statistical retrievals (first guess). The dotted-dashed line in the right-hand panel is the square root of the diagonal elements of the retrieval-noise covariance. Above 4-km uncertainties in the radiosondes measurements and remaining uncertainty in the spectroscopy are significantly con-
Fig. 12. MWR-measured BTs minus-model computations. Crosses represent model computations performed with the H04 parameters, while squares are computations performed with the T05 parameters. Black circles are differences between the two models (H04–T05).
tributing to the total standard deviation. Retrievals performed by using the H04 parameters overestimate the temperature between 0 and 5 km. The new parameters reduce the temperature bias to ∼1 K over the whole vertical profile. V. E FFECT OF L INE P ARAMETERS ON PWV AND LWP R ETRIEVALS PWV and LWP are routinely retrieved at the NSA site from the measurements of BTs collected by the MWR at 23.835 and 31.400 GHz. The modeling of the oxygen-absorption band has some effects on the BTs in the region of WV and LW absorption. The oxygen contribution is the dry opacity term that affects the clear-sky retrievals of LWP. As observed by Marchand [17], the differences in absorption models due to the dry contribution can be as high as 0.5 K, leading to the differences in the retrieved LWP of 15 to 20 g/m2 . Fig. 12 shows the differences
2222
IEEE TRANSACTIONS ON GEOSCIENCE AND REMOTE SENSING, VOL. 45, NO. 7, JULY 2007
between the clear-sky measured and modeled BTs as a function of PWV measured by radiosondes. Crosses represent the model computations performed with the H04 parameters, while squares are the computations performed with the T05 parameters. Black circles are the differences between the two models (H04–T05). On the left-hand panel, results at 23.835 GHz are shown. With the T05 parameters, the differences between the measurements and the model computations decreased by about 0.3 K (the mean value went from 0.57 to 0.23 K). The slight increase in the 23.8-GHz BT, caused by the new parameters, should have a negligible effect on the retrieval of PWV. On the right-hand panel, results at 31.4 GHz are shown. In this case, the mean value of the measurement-minus-model computations went from 0.85 K (for the H04 parameters) to 0.21 K (for the T05 parameters). For both frequencies, the differences between the two models slightly decrease with increasing PWV. From Fig. 12, it can be seen that model computations performed by using the HITRAN-database oxygen parameters (H04) will cause an average underestimation of the 31.4-GHz BTs of about 0.8 K, leading to an overestimation in the retrieved LWP of more than 20 g/m2 . The differences between the measurements and the model computations are due to the calibration errors (estimated to be up to 0.3 K), the errors in the oxygen model, in the model of the 22.835-GHz absorption line, and the WV continuum. However, the 0.67-K mean difference between the two models (translating to an LWP difference of approximately 20 g/m2 ) is only due to the oxygen model. VI. C ONCLUSION This paper examines how the differences in the spectral parameters of oxygen absorption affect the retrievals of temperature, the PWV, and the LWP. We examined two spectral databases: the widely used HITRAN database and a new set of parameters recently proposed by Tretyakov et al. [11]. We highlighted the differences in the line air- and self-broadening parameters and in the mixing coefficients. We then compared the modeled BTs with the measurements from the MWRP. The choice of the Arctic location was dictated by the fact that we have a large continuous dataset of MWRP measurements that enabled us to investigate the stability of calibration. In addition, the low-humidity and high-pressure conditions at the NSA are favorable for investigating the effect of the oxygen component on the retrievals of PWV and LWP. The comparison indicates that the Tretyakov et al. oxygen line parameters should be implemented in the HITRAN database. The line-broadening coefficients are not satisfactory in H04, especially in the region of the wing of the band, where many instruments operate. This fact was recently observed by Tretyakov et al. [11]. The assumed temperature dependence of the linewidth (X = 0.71) appears to be inadequate as well, leading to a temperature dependence of the residuals. The higher value proposed by Liebe et al. [7] (X = 0.8) results in better agreement between the measured and modeled BTs. The resulting BTs are, in general, too low when compared to the measurements at the most transparent channels. Of the seven MWRP channels, four operate at the transparent frequencies that provide information on the upper troposphere layers. The remaining three operate at opaque
channels that provide information on the atmospheric layers above the radiometer. BTs computed with the H04 parameters are generally lower than the measurements, resulting in a strong overestimation of the temperature profiles in the first 6 km. The T05 parameters improved the measurement-model agreement at all channels. However, a −3-K bias at 52.28 GHz remains. An additional analysis of the data collected with the GSR suggests that the source of this bias is in the MWRP instrument rather than in the spectroscopy. Simulations of BTs for the down-looking and up-looking instruments were carried out for a standard Arctic atmosphere across the microwave spectrum (20–150 GHz) by using the two sets of parameters. Results showed that the oxygen model alone could cause a difference of about 10% in the computed BTs in the window regions. Since we have analyzed only the data collected at the NSA, we cannot assess how the two models perform in other climatic conditions. It is known that performances of various models vary, depending on the location. The assessment of the T05 model under different climatic conditions will be the subject of future work. In particular, an assessment of the model at higher altitude with significantly less oxygen loading and lower pressure would be beneficial. Finally, we have addressed how the oxygen parameters affect the modeling of frequencies used in the WV and LW retrievals. We have shown that when the T05 parameters are employed in the model, the computed BTs at the 23.8- and 31.4-GHz channels are higher than those obtained by using the H04 parameters. The differences are approximately 0.33 K for the 23.8-GHz channel and 0.67 K for the 31.4-GHz channel. This results in a decrease in the retrieved LWP of about 20 to 25 g/m2 . R EFERENCES [1] P. W. Rosenkranz, “Absorption of microwaves by atmospheric gases,” in Atmospheric Remote Sensing by Microwave Radiometry, M. A. Janssen, Ed. New York: Wiley, 1993. [2] J. C. Liljegren, S.-A. Boukabara, K. Cady-Pereira, and S. A. Clough, “The effect of the half-width of the 22-GHz water vapor line on retrievals of temperature and water vapor profiles with a 12-channel microwave radiometer,” IEEE Trans. Geosci. Remote Sens., vol. 43, no. 5, pp. 1102– 1108, May 2005. [3] S. A. Clough, M. W. Shepard, E. J. Mlawer, J. S. Delamere, M. J. Iacono, K. Cady-Pereira, S. Boukabara, and P. D. Brown, “Atmospheric radiative transfer modeling: A summary of the AER codes, short communication,” J. Quant. Spectrosc. Radiat. Transf., vol. 91, pp. 233–244, 2005. [4] S. A. Clough, M. W. Shephard, E. J. Mlawer, J. S. Delamere, M. J. Iacono, K. Cady-Pereira, S. Boukabara, and P. D. Brown, “Atmospheric radiative transfer modeling: A summary of the AER codes,” J. Quant. Spectrosc. Radiat. Transf., vol. 91, no. 2, pp. 233–244, Mar. 2005. [5] L. S. Rothman et al., “The HITRAN 2004 molecular spectroscopic database,” J. Quant. Spectrosc. Radiat. Transf., vol. 96, no. 2, pp. 139–204, Dec. 2005. [6] M. L. Hoke, S. A. Clough, W. J. Lafferty, and B. W. Olson, “Line coupling in oxygen and carbon dioxide,” in IRS 88: Current Problems in Atmospheric Radiation, J. Lenoble and J. F. Geleyn, Eds. Hampton, VA: A. Deepak, 1989, pp. 368–371. [7] H. J. Liebe, P. W. Rosenkranz, and G. A. Hufford, “Atmospheric 60-GHz oxygen spectrum: New laboratory measurements and line parameters,” J. Quant. Spectrosc. Radiat. Transf., vol. 48, no. 5/6, pp. 629–643, Dec. 1992. [8] T. J. Hewison, D. Cimini, L. Martin, C. Gaffard, and J. Nash, “Validating clear air absorption models using ground-based microwave radiometers and vice-versa,” Meteorol. Z., vol. 15, no. 1, pp. 27–36, Feb. 2006. [9] P. W. Rosenkranz and C. D. Barnet, “Microwave radiative transfer model validation,” J. Geophys. Res., vol. 111, no. D9, p. D09S07, Mar. 2006. DOI: 10.1029/2005JD006008.
CADEDDU et al.: EFFECT OF THE OXYGEN LINE-PARAMETER MODELING
[10] S. A. Boukabara, S. A. Clough, J.-L. Moncet, A. F. Krupnov, and V. V. Parshin, “Uncertainties in the temperature dependence of the line coupling parameters of the microwave oxygen band: Impact study,” IEEE Trans. Geosci. Remote Sens., vol. 43, no. 5, pp. 1109–1114, May 2005. [11] M. Y. Tretyakov, M. A. Koshelev, V. V. Dorovskikh, D. S. Makarov, and P. W. Rosenkranz, “60-GHz oxygen band: Precise broadening and central frequencies of fine-structure lines, absolute absorption profile at atmospheric pressure, and revision of mixing-coefficients,” J. Molec. Spectrosc., vol. 231, no. 1, pp. 1–14, May 2005. [12] R. R. Gamache, A. Goldman, and L. S. Rothman, “Improved spectral parameters for the most abundant isotopomers of the oxygen molecule,” J. Quant. Spectrosc. Radiat. Transf., vol. 59, no. 3–5, pp. 495–509, 1998. [13] P. H. Krupenie, “The spectrum of molecular oxygen,” J. Phys. Chem. Ref. Dat., vol. 1, no. 2, pp. 423–534, 1972. [14] J. C. Liljegren, Evaluation of a new multi-frequency microwave radiome ter for measuring the vertical distribution of temperature, water vapor, and cloud liquid water. Tech. Rep. DOE/SC-ARM/TR-057. [Online]. Available: http://www.arm.gov/publications/tech_reports/handbooks/ mwrp_handbook.pdf [15] D. Cimini, E. R. Westwater, A. J. Gasiewski, M. Klein, V. Leuski, and J. Liljegren, “Ground-based millimeter- and submillimeter-wave observations of low vapor and liquid water contents,” IEEE Trans. Geosci. Remote Sens., vol. 45, no. 7, pp. 2169–2108, Jul. 2007. [16] C. D. Rodgers, Inverse Methods for Atmospheric Sounding. Theory and Practice. Hackensack, NJ: World Scientific, 2000, p. 73. [17] R. Marchand et al., “An assessment of microwave absorption models and retrievals of cloud liquid water using clear-sky data,” J. Geophys. Res., vol. 108, no. D24, 4773, Dec. 2003. DOI:10.1029/2003JD003843. Maria P. Cadeddu received the M.S. degree in physics from the University of Cagliari, Cagliari, Italy, in 1994 and the Ph.D. degree in physics from Heriot-Watt University, Edinburgh, U.K., in 2002. She is currently the Instrument Mentor for the U.S. Department of Energy Atmospheric Radiation Measurement program on microwave instrumentation at Argonne National Laboratory, Argonne, IL. Dr. Cadeddu is a member of the American Geophysical Union. Vivienne H. Payne received the M.Phys. degree in physics from the University of Edinburgh, Edinburgh, U.K., in 2001 and the D.Phil. degree in atmospheric physics from the University of Oxford, Oxford, U.K., in 2005, where she worked on retrievals of water vapor and methane from MIPAS, an infrared limb sounder flying on ESA’s Envisat satellite. She was with the University of Colorado, Boulder, in 2005, working on the interpretation of her retrievals of water vapor isotopes before joining the Atmospheric and Environmental Research, Inc., Lexington, MA, in January 2006. She is currently involved in radiative transfer modeling and retrievals in the infrared and microwave regions.
2223
S. A. Clough received the B.S. degree in engineering physics from Cornell University in 1954, the Master’s degree from Columbia University in 1957. He was then with the Air Force Geophysics Laboratory (AFGL), conducting research on the molecular spectroscopy of atmospheric molecules, principally water vapor and ozone. His education continued at the Massachusetts Institute of Technology, Cambridge. Following an extended career at AFGL, he accepted his current position at the Atmospheric and Environmental Research, Inc., Lexington, MA. He is a participant in the Earth Observing System (EOS) project as a Coinvestigator on the tropospheric emission spectrometer (TES), a high-resolution spectrometer on the EOS AURA platform. He is a member of the Science Team of the Atmospheric Radiation Measurement program, researching on the development, improvement, and validation of radiative transfer models and atmospheric composition. He has been responsible for the development of the widely used atmospheric radiative modeling codes including LBLRTM, RRTM, and CHARTS and has made significant contributions to the HITRAN spectroscopic database. He is well known for his contributions to the theory of collision broadening as applied to atmospheric problems including the water vapor continuum. His principal areas of interest include atmospheric radiative transfer, molecular physics, and approaches to the retrieval of information from remotely sensed measurements. His current activities are focused on the improvement of radiative transfer modeling with application to remote sensing and to general circulation models for climate change studies and include the assessment of the forward model used by TES and its improvement.
K. Cady-Pereira, photograph and biography not available at the time of publication.
James C. Liljegren received the B.S., M.S., and Ph.D. degrees in mechanical engineering from the University of Illinois, Urbana-Champaign, in 1980, 1983, and 1989, respectively. His dissertation focused on stochastic modeling of turbulent dispersion in the convective boundary layer. He joined the Pacific Northwest National Laboratory in 1990, where he became involved in ground-based microwave radiometry with the U.S. Department of Energy Atmospheric Radiation Measurement (ARM) program. He joined the Ames Laboratory, Ames, IA, in 1997, where he continued to pursue research related to microwave radiometry and retrieval algorithm development. Since 1999, he has been with Argonne National Laboratory, Argonne, IL. In 2000, he became the Site Program Manager for the ARM Southern Great Plains (SGP) Climate Research Facilities in Oklahoma and Kansas. Since 2003, he has also served as the ARM Instrument Team Coordinator. Dr. Liljegren is a member of the American Meteorological Society and the American Geophysical Union.