Fibers and Polymers 2015, Vol.16, No.2, 404-412 DOI 10.1007/s12221-015-0404-3
ISSN 1229-9197 (print version) ISSN 1875-0052 (electronic version)
Effect of Wetting Pretreatment on Structure and Properties of Plasma Induced Chitosan Grafted Wool Fabric C. X. Wang1,2,3*, M. Du4, J. C. Lv1, Q. Q. Zhou1, D. W. Gao1,3, G. L. Liu1, L. M. Jin5, Y. Ren2, and J. H. Liu3,6 1
College of Textiles and Clothing, Yancheng Institute of Technology, Jiangsu 224003, China 2 School of Textile and Clothing, Nantong University, Jiangsu 226019, China 3 Key Laboratory of Eco-textiles, Ministry of Education, Jiangnan University, Jiangsu 214122, China 4 College of Textiles and Clothing, Yancheng Institute of Industry Technology, Jiangsu 224000, China 5 Shanghai Institute of Applied Physics, Chinese Academy of Sciences, Shanghai 201204, China 6 College of Textiles and Clothing, Jiangnan Univesity, Jiangsu 214122, China (Received August 25, 2014; Revised October 16, 2014; Accepted November 3, 2014) Abstract: Chitosan (CS) was grafted on the wool after being wetted at different relative humidity (5 %, 65 % and 95 % RH) and induced by O plasma to investigate the influence of wetting pretreatment on the structure and properties of plasma induced chitosan (PICS)-grafted wool fabric. The effects of the RH of wetting pretreatment, CS concentration and grafting time on weight gain ratio and PICS-grafted wool fabric properties including wettability, dyeability and shrink resistance were studied. Scanning electron microscopy (SEM) observation showed that the scales on the wool fiber wetted at 95 % RH and then treated by O plasma were more severely damaged. The surface roughness and polar group content of PICS-grafted wool fabrics increased with the RH of wetting pretreatment. The analysis results of surface morphology by SEM and chemical composition by X-ray photoelectron spectroscopy (XPS) revealed much more CS on the surface of PICS-grafted wool fabric wetted at 95 % RH. The analysis results of weight gain ratio, contact angle, K/S value and area felting shrinkage manifested the optimum parameters of PICS grafting on the wool fabric wetted at 95 % RH could be set as the chitosan concentration of 2 g/l and the grafting time of 2 h. The machine washable wool fabric with the area felting shrinkage of 4.5 % and the better wettability and dyeability could be obtained by a new ecologically acceptable process of PICS grafting on the wool wetted at 95 % RH. 2
2
Keywords: Wetting pretreatment, Plasma induced grafting, Chitosan, Wool, Properties, SEM, XPS
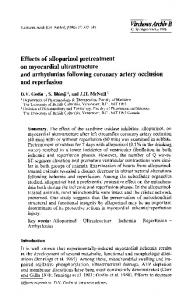
Figure 1 shows the chemical structures of cellulose, chitin and CS. It can be seen that these polymers, which are all similar in chemical structure, have polar groups such as amino and hydroxyl. CS has been widely applied in many fields such as medicine, environment, food, papermaking, daily-use chemical and agriculture owing to desirable properties including reactivity, biocompatibility, biodegradability, moisture absorption, air permeability and broad-spectrum antibacterial function [10,11]. It has been proven through some preliminary studies that CS finishing of textiles can improve fabric properties such as dyeability, antibacterial, anti-shrinkage and so on [12-14]. However, the application of CS in textile has been restricted due to the poor cohesion between fiber surface and CS [8,15-17]. In order to enhance physical adsorption and chemical combination, the fiber surface can be modified to enhance surface roughness and introduce polar groups by low temperature plasma [18,19]. In this research, PICS grafting on wool was employed to improve wool fabric properties. Wool fabrics were wetted at different RH to study the influences of wetting pretreatment on PICS grafting on wool, which were detected by the changes in weight, structure and properties before and after PICS grafting on wool. The amount of PICS grafting on wool was qualitatively evaluated with weight gain ratio. The wettability, dyeability and shrinkage resistance of wool fabric were characterized by optical contact angle, K/S value
Introduction Wool, a natural protein fiber, has many excellent characteristics of luster, elasticity, abrasive resistance, warm retention and so on [1,2]. However, the existence of scales on wool fiber surface results in poor wettability, dyeability and shrinkage resistance [3,4]. In recent years, wool fabric is extensively used to produce spring and autumn clothing. People’s requirement of wool fabric comfortability is increasing more and more highly. How to improve wettability, dyeability and shrinkage resistance of wool fabric has attracted wide attention of researchers. In current, most of traditional scale removal methods reported in literatures are chemical treatment, which causes se serious environmental pollution because of high AOX levels [5,6]. With the progress of social science technology and the improvement of people’s environmental awareness, the applications of low temperature plasma and natural polymers such as chitin to improve wool fabric properties have attracted a great deal of scientific and industrial interest as possible substitutes owing to their minimum damage to environment and resources availability [7-9]. CS, produced by deacetylation of chitin from crayfish waste, is an environmentally friendly natural polysaccharides polymer. *Corresponding author:
[email protected] 404
Plasma Induced Chitosan Grafted Wool Fabric
Fibers and Polymers 2015, Vol.16, No.2
405
Plasma Treatment The plasma treatment of wool fabric was carried out using HD-1B low temperature plasma apparatus manufactured by Changzhou Zhongke Changtsi Plasma Processing Apparatus Plasma Technology Co., Ltd., (Jiangsu, China). The low temperature plasma was generated by capacitance coupling glow discharge at lower pressure than 20 Pa. The wetted wool fabrics were treated by Ar, N2 and O2 plasma for 2 min at 200 W, respectively. The plasma treated wool fabric was immediately placed into a clean plastic bag to minimize potential contamination for CS grafting.
Figure 1. Molecular structures of (a) cellulose, (b) chitin, and (c) CS.
and area felting shrinkage, respectively. Surface morphology and chemical composition were analyzed by SEM and XPS.
PICS Grafting The desired amount of CS was dissolved in distilled water containing 1 % HAc to prepare CS solution. PICS grafting was conducted by the exhaustion method using a liquor ratio to wool fabric of 20:1 at 30 oC. The plasma treated wool fabrics with wetting pretreatment were immersed in CS solution with different CS concentrations (1, 2, 3, 4, 5 g/l) for 2 h and in 2 g/l CS solution for different times (1, 2, 3, 4, 5 h), respectively. Then the samples were washed, squeezed and dried at room temperature to obtain PICS-grafted wool fabrics wetted at 5 %, 65 % and 95 % RH, respectively. Weight gain ratio was calculated from weight difference to obtain a quantitative assessment of PICS grafting on wool as follows: Weight gain ratio (%) =
Experimental Materials A plain woven wool fabric (14.7 tex×2 ply warp and 40 tex×2 ply weft; 280 g/m2) with the thickness of 0.635 mm was provided by Shenzhou Woolen Factory (Jiangsu, China). A weft-knitted wool fabric for shrinkage resistance test was produced with 64s commercially available wool yarns. CS with the molecular weight of 100,000 and the deacetylation degree of 85 % was supplied by Zhejiang Golden-Shell Biochemical Co., Ltd., (China). Acetone, HAc (acetic acid), NaOH (sodium hydroxide) and Sulfuric acid (H2SO4) were of analytical reagent grade and offered by Sinopharm Chemical Reagent Co., Ltd., (China). All chemical reagents were used as received. The purity of gases (Ar, N2, O2) used to produce low temperature plasma was 99.99 %. Acid Scarlet G was presented by Huntsman Textile and Dye Co., Ltd., (China). Wetting Pretreatment Wool fabrics was scoured twice in acetone for 30 min to eliminate residues and then washed three times in distilled water. After being dried to a stable weight in a vacuum oven at room temperature, wool fabric was stored in a desiccator for use. The cleaned wool fabric was wetted for 12 h at 5 %, 65 % and 95 % RH for plasma treatment, respectively.
weight of PICS − grafted wool fabric − weight of plasma treated wool fabric ×100 weight of plasma treated wool fabric
Wettability Measurement Contact angle was measured to determine the wettability of woven wool fabric [3]. The contact angle test was done on a JC2000D3 Contact Angle Analyzer (Zhongchen Digital Technic Apparatus Co., Ltd., Shanghai, China). A droplet of distilled water (5 µl) was placed on the surface of woven wool fabric fixed on holder using a microsyringe at room temperature. Initial contact angle was recorded as soon as the droplet was on the surface of woven wool fabric. Dyeability Measurement Woven wool fabric was dyed with Acid Scarlet G, an acidic dye recommended for wool. Dyeing was carried out using a liquor ratio of 50:1, pH 5 (70 % H2SO4) and 2 % o.w.f. The temperature profile applied during dyeing process was shown in Figure 2. At the end of dyeing, wool fabric was rinsed with cold water and dried at room temperature. Color Measurement Spectrophotometer (CE7000A, USA) was utilized to measure the color strength of dyed wool fabric, expressed as K/S value (K is the absorption coefficient and S is the scattering coefficient), which was determined by
406
Fibers and Polymers 2015, Vol.16, No.2
C. X. Wang et al.
Surface Morphology Observation The surface morphology of wool fiber was observed with a QUANTA200 Scanning Electron Microscope provided by FEI Company (Hillsboro, America). Wool fiber was sputtered with gold under vacuum prior to observation. SEM micrograph was taken at 10,000× magnification.
Figure 2. Temperature profile during wool dyeing process.
the Kubelka-Munk equation [20] as follows. Rλmax is the fabric reflectance value at peak wavelength. 2
( 1 – Rλmax ) K ---- = -------------------------S 2Rλmax Shrinkage Resistance Measurement According to ISO 6330 [3], knitted wool fabric conditioned for 24 h was subjected to washing procedures. Area felting shrinkage was calculated from the size difference of wool fabric before and after washing as follows: Area felting shirnkage (%) = size of fabric before washing−size of fabric after washing ×100 size of fabric before washing
Surface Chemical Composition Analysis An ESCALAB 250 X-ray photoelectron spectrometer system (Thermo-VG Scientific, England) was applied to analyze the surface chemical composition of wool fiber. The test system was equipped with a Mg Ka X-ray source (1253.6 eV). The sample preparation and analysis were performed under UHV condition 5×10⁻¹⁰ mbar and 1×10⁻¹⁰ mbar, respectively. The power was 300 W and photoemitted electrons were collected at a take-off angle of 90 o. Statistical Analysis Contact angle, K/S value and area felting shrinkage were measured for five times or more and an average value with acceptable relative standard deviation (≤4 %) was obtained. One-way analysis of variance (ANOVA) and Tukey’s Pairwise Multiple Comparison were adopted to analyze test results of weight gain ratio, contact angle, K/S value and area felting shrinkage [3,21,22]. There were fifteen determinations made in each cell and two levels were used. A P-value smaller than 0.05 was considered significant in all analysis.
Figure 3. SEM micrographs of (a) the control and the wool fiber treated by different plasmas (b) Ar plasma, (c) N plasma, and (d) O plasma. 2
2
Plasma Induced Chitosan Grafted Wool Fabric
Fibers and Polymers 2015, Vol.16, No.2
407
SEM Analysis SEM observations yielded information about the plasma etching effect and PICS grafting on wool as shown in Figures 3-5. Figure 3 showed the SEM micrographs of the control (Figure 3(d)) and the wool fibers treated by Ar, O2 and N2 plasma, respectively. Whereas the surface appearance of Ar plasma treated wool fiber was similar to that of the control,
the surface of N2 plasma and O2 plasma treated wool fiber showed a considerable etching effect. It could be explained by polymer degradation reaction due to the bombardment of ions and electrons as well as polymer oxidative reaction with nitrogen or oxygen atoms and free radicals [23-25]. Especially O2 plasma treatment caused the most physical modification on wool fiber cuticle surface, which could be attributed to the higher oxygen content in plasma for a given operating pressure [26]. Therefore, it was found that O2 plasma treatment was more effective than Ar and O2 plasma treatment in
Figure 4. SEM micrographs of the O plasma treated wool fiber wetted in different RH (a) 5 %, (b) 65 %, and (c) 95 %.
Figure 5. SEM micrographs of the PICS-grafted wool fibers wetted at different RH (a) 5 %, (b) 65 %, and (c) 95 %.
Results and Discussion
2
408
Fibers and Polymers 2015, Vol.16, No.2
C. X. Wang et al.
etching wool fiber surface. Figure 4 showed the SEM micrographs of the O2 plasma treated wool fibers wetted at different RH. No significant difference in surface appearance was observed between the control (Figure 3(d)) and the wool fiber wetted at 5 % RH. However, on the surface of the wool fiber wetted at 65 % and 95 % RH, many scales were destroyed or removed resulting in much smoother surface. And furthermore, almost no scales on the surface of the wool fiber wetted at 95 % RH could be noticed. The hydrophilic cortex of the wool fiber wetted in the higher RH could absorb much more water, which could break intrafibril hydrogen bonds resulting in the swelling of wool fiber bulk. There was less deformation on hydrophobic scale surface. The scale angle to fiber axis increased due to the different deformations between scale and fiber bulk [27]. Therefore, the larger area of wool fiber surface was exposed to O2 plasma leading to the much greater etching effect on wool fiber surface during bombardment of active species in plasma [3]. Figure 5 showed the SEM micrographs of the PICSgrafted wool fibers wetted at different RH. Compared with the control as shown in Figure 3(a), it could be seen that there was pronounced difference in surface morphology of the control and PICS-grafted wool fibers. The more and larger particles were homogeneously distributed on the much rougher surface with the RH of wetting pretreatment increasing, which indicated the more CS deposition on wool fiber surface. Based on SEM results, it was reasonable to assume that the higher RH could help the more CS presence on the PICS-grafted wool fiber [28]. XPS Analysis XPS analysis was carried out to detect the changes of surface chemical composition including elements and functional groups. XPS survey scan and chemical composition of the control and the PICS-grafted wool fibers wetted at different RH were presented in Figure 6 and Table 1. The main photoelectron peaks at 532 eV, 400 eV and 285 eV corresponded to O1s, N1s, C1s, respectively. The chemical composition of the control was similar to that reported in literatures [29-31]. The survey scan indicated that no elements were introduced and no significant changes in sulphur and silicon content were found on the surface of PICS-grafted wool fiber. It could be noticed that a significant
Figure 6. XPS survey scan of (a) the control and the PICS-grafted wool fibers wetted at different RH (b) 5 %, (c) 65 %, and (d) 95 %.
decrease in carbon content and progressive increase in oxygen and nitrogen content of PICS-grafted wool fiber with the RH of wetting pretreatment increasing. Especially, the atomic ratio (O+N)/C of the PICS-grafted wool fiber wetted at 95 % RH was much higher than that of the control. The more significant change in element content proved that the more CS was grafted on wool, which was consistent with SEM analysis result as shown in Figure 5. In order to examine the changes in functional side groups, the Cls spectrum was deconvolved with XPSPEAK software. The deconvolution analysis results of the control and the PICS-grafted wool fibers wetted at different RH were elucidated in Figure 7 and Table 2. Based on literatures [3, 29-31], the carbon-containing groups on wool fiber surface could be attributed to C-C (285 eV), C-N (286.6 eV), C-O (288.5 eV) and C=O (289.5 eV). The contents of C-C and C-O/C-N groups drastically decreased and increased, respectively, while the content of C=O did not obviously change. The C-O/C-N content steadily increased with the RH of wetting pretreatment, which demonstrated that the higher RH facilitated PICS grafting on wool. All these changes in surface morphology and chemical composition of wool fiber could help to increase weight gain ratio and improve wettability, dyeability and shrinkage resistance. Weight Gain Ratio Analysis The effects of the RH of wetting pretreatment, CS
Table 1. Relative chemical composition and atomic ratios determined by XPS for the control and the PICS grafted wool fibers wetted at different RH Sample Control PICS-grafted wool fibers wetted at different RH
5% 65 % 95 %
C 69.2 63.8 60.0 55.3
O 17.2 20.9 23.1 25.6
Chemical composition (%) N 10.1 11.7 13.5 15.8
S 2.8 2.7 2.6 2.5
Si 0.7 0.9 0.8 0.8
Atomic ratio (O+N)/C 0.39 0.51 0.61 0.75
Plasma Induced Chitosan Grafted Wool Fabric
Fibers and Polymers 2015, Vol.16, No.2
409
Figure 7. Deconvolution of XPS core level C1s spectra of (a) the control and the PICS-grafted wool fibers wetted at different RH (b) 5 %, (c) 65 %, and (d) 95 %.
Table 2. Results of deconvolution analyses of C1s peaks for the control and the PICS grafted wool fibers wetted at different RH Sample Control PICS-grafted wool fibers wetted at different RH
5% 65 % 95 %
Relative area of different chemical bonds (%) -C-C- -C-N- -C-O- -O=C79.3 11.7 6.1 2.9 69.3 17.2 10.3 3.2 63.7 19.0 13.3 4.0 52.3 25.6 17.4 4.7
concentration and grafting time on PICS grafting on wool were investigated on the basis of weight gain ratio of wool fabric. The influence of the RH of wetting pretreatment on the weight gain ratio of the PICS-grafted wool fabrics before and after washing was depicted in Figure 8. The weight gain ratio after washing signified the durability of PICS grafting on wool. The results showed that the weight gain ratio before and after washing was affected by RH. The weight gain ratio of PICS-grafted wool fabrics and the difference in
Figure 8. Effect of the RH of wetting pretreatment on the weight gain ratio of the PICS-grafted wool fabrics before and after washing.
weight gain ratio before and after washing increased and decreased, respectively, with the increasing RH of wetting pretreatment. It could be attributed to that the rougher
410
Fibers and Polymers 2015, Vol.16, No.2
surface and more introduction of new anionic groups [26], which reacted with the amine groups of CS, leading to the much more PICS grafting on wool as reported in literatures [3,8]. The change trend of weight gain ratio with the RH of wetting pretreatment was exactly as the analysis results of SEM and XPS. The effects of CS concentration and grafting time on weight gain ratio of the PICS- grafted wool fabrics wetted at different RH were shown in Figures 9-10, respectively. It could be seen that with CS concentration and grafting time increasing weight gain ratio firstly rapidly increased and then proceeded at a lower rate, tending to a plateau. At the lower CS concentration for the shorter grafting time, weight gain ratio increased much faster due to the availability of the more active cites on wool. With the increase of CS concentration and grafting time, the active cites on wool were
Figure 9. Effect of CS concentration on the weight gain ratio of the PICS-grafted wool fabrics wetted at different RH.
Figure 10. Effect of grafting time on the weight gain ratio of the PICS-grafted wool fabrics wetted at different RH.
C. X. Wang et al.
gradually occupied and so the available cites for PICS grafting on wool decreased. This could be seen by no significant increment in weight gain ratio of wool fabric at the higher CS concentration or for the longer grafting time. The weight gain ratio of the PICS-grafted wool fabric wetted at 95 % RH increased to a certain CS concentration of 2 g/l lower than 3 g/l for the PICS-grafted wool fabric wetted at 65 % RH and 4 g/l for the PICS-grafted wool fabric wetted at 5 % RH. Similarly, a certain grafting time of 2 h for the PICS-grafted wool fabric wetted at 95 % RH was shorter than 3 h for the PICS-grafted wool fabric wetted at 65 % RH and 4 h for the PICS-grafted wool fabric wetted at 5 % RH. The presence of electronegative groups usually enhanced PICS grafting. The higher reactivity of CS toward wool could be attributed to the easier grafting of free amine groups of CS with the available reactive sites (carboxylic groups of the plasma-treated wool fiber). It was suggested that the optimum process parameters of PICS grafting on wool wetted at 95 % RH were set as the CS concentration of 2 g/l and the grafting time of 2 h. It should be emphasized that PICS grafting on wool wetted at the higher RH was recommended to improve wool fabric properties. Analysis of Wool Fabric Properties Effects of the RH of wetting pretreatment on contact angle, K/S value and antifelting area shrinkage of PICSgrafted wool fabrics were illustrated in Figures 11-13, respectively. The results showed the contact angles of the control and the PICS-grafted wool fabrics wetted at 5 %, 65 % and 95 % RH were 160 o, 118 o, 55 o and 26 o, respectively. These variations could be explained by the formation of hydrogen bond resulting from the increasing hydrophilic groups due to PICS grafting on wool [28,32]. The dyeability of all samples with reactive dye was studied. In the case of PICS-grafted samples, the K/S values
Figure 11. Effect of the RH of wetting pretreatment on the contact angle of the PICS-grafted wool fabrics.
Plasma Induced Chitosan Grafted Wool Fabric
Figure 12. Effect of the RH of wetting pretreatment on the K/S value of the PICS-grafted wool fabrics.
Fibers and Polymers 2015, Vol.16, No.2
411
[3]. Though the area felting shrinkage of the PICS-grafted wool fabric wetted at 5 % RH was lower than that of the control, its shrink resistance did not impart a machinewashable finishing. However, the area felting shrinkage of the PICS-grafted wool fabrics wetted at 65 % and 95 % RH was below 8 % required for machine-washable wool fabric according to ISO standard [3]. Therefore, the shrink resistance of PICS-grafted wool fabric could be enhanced by wetting pretreatment in the higher RH, which promoted the spreading and adhesion of the hydrophilic CS on wool fiber, and produced a smaller physical cuticle surface change. The PICS-grafted wool fabric wetted at 95 % RH resulted in the lowest area felting shrinkage of 4.5 % in accordance with the wettability and dyeability results. The wettability, dyeability and shrink resistance change of PICS-grafted wool fabric likely resulted from the surface physical and chemical modification as observed in SEM and XPS analysis.
Conclusion
Figure 13. Effect of the RH of wetting pretreatment on the area felting shrinkage of the PICS-grafted wool fabrics.
increased due to the availability of extra amine and hydroxyl groups, which were provided by CS molecules [28,33]. PICS-grafted samples showed the increasing wettability and dyeability with the increasing RH of wetting pretreatment because more peroxides or polar functional groups formed on the wool fabric surfaces due to the more CS grafting. The wool fabric wetted at the lower RH was grafted by less CS and therefore relatively less polar functional groups were exposed [15]. The changes in wettability and dyeability with the RH of wetting pretreatment were consistent with the SEM observations and XPS analysis. The area felting shrinkage of all samples was measured as shown in Figure 13. Compared with the control, the other samples showed a certain anti-felting trend, which could be attributed to the increasing wettability and anionic character of wool fiber surface after PICS grafting. And the higher the hydrophilicity was, the higher the shrinkage resistance was
PICS grafting on wool was successfully exploited to modify wool fiber surface with a view to improve wettability, dyeability and shrinkage resistance of wool fabric. PICSgrafted wool fabric was prepared by grafting CS on the wool fabric after being wetted at a certain RH and then treated by O2 plasma. SEM images and XPS spectra confirmed PICS grafting on wool. Also the results of weight gain ratio, contact angle, K/S value and area felting shrinkage of PICS-grafted wool fabrics were in good agreement with XPS and SEM findings. It was found that the wetting pretreatment at the higher RH had a positive effect on PICS grafting on wool and greatly facilitated to improve wool fabric properties. The optimum conditions of PICS grafting on wool were achieved as the RH of wetting pretreatment of 95 %, the CS concentration of 2 g/l and the grafting time of 2 h. It was worth to mentioning that the findings in this research supported the potential production of new environmentally friendly textiles. In addition, PICS-grafted wool fabric had antibacterial activity due to the antibacterial property of CS molecules, which would be investigated in future research.
Acknowledgements The project was supported by National Natural Science Funds of China (No. 11305138), National Natural Science Funds of Jiangsu (No. BK20140431), Open Project Program of Key Laboratory of Eco-textiles, Ministry of Education, Jiangnan University (No. KLET1213, No. KLET1312), Research Fund of Key Laboratory for Advanced Technology in Environmental Protection of Jiangsu Province (No. AE201321) and Production, Education & Research Cooperative Innovation Fund Project of Jiangsu Province (No. BY2014108-07).
412
Fibers and Polymers 2015, Vol.16, No.2
References 1. A. P. Negri, H. J. Cornell, and D. E. Rivett, Text. Res. J., 62, 381 (1992). 2. A. P. Negri, H. J. Cornell, and D. E. Rivett, Text. Res. J., 63, 109 (1993). 3. H. L. Xu, S. J. Peng, C. X. Wang, L. Yao, J. Sun, F. Ji, and Y. P. Qiu, J. Appl. Polym. Sci., 113, 3687 (2009). 4. S. Shahidi, A. Rashidi, M. Ghoranneviss, A. Anvari, and J. Wiener, Surf. Coat. Technol., 205, S349 (2010). 5. F. Osenberg, D. Theirich, A. Decker, and J. Engemann, Surf. Coat. Technol., 116-119, 808 (1999). 6. J. Shen, M. Rushforth, A. Cavaco-Paulo, G. Guebitz, and H. Lenting, Enzyme Microb. Technol., 40, 1656 (2007). 7. G. Z. Ke, W. D. Yu, W. L. Xua, W. G. Cui, and X. L. Shen, J. Mater. Process. Technol., 207, 125 (2008). 8. S. Eom, AATCC Rev., 3, 57 (2001). 9. C. X. Wang and Y. P. Qiu, Surf. Coat. Technol., 201, 6237 (2007). 10. E. S. Abdou, S. S. Elkholy, M. Z. Elsabee, and E. Mohamed, J. Appl. Polym. Sci., 108, 2290 (2008). 11. E. Pascual and M. R. Julià, J. Biotechnol., 89, 289 (2001). 12. M. W. Huh, I. K. Kang, D. H. Lee, W. S. Kim, D. H. Lee, L. S. Park, K. E. Min, and K. H. Seo, J. Appl. Polym. Sci., 81, 2769 (2001). 13. A. M. Ferreira, I. Carmagnola, V. Chiono, P. Gentile, L. Fracchia, C. Ceresa, G. Georgiev, and G. Ciardelli, Surf. Coat. Technol., 223, 92 (2013). 14. C. H. Jou, S. M. Lin, L. Yun, M. C. Hwang, D. G. Yu, W.L. Chou, J. S. Lee, and M. C. Yang, Polym. Advan. Technol., 18, 235 (2007). 15. Y. B. Chang, P. C. Tu, M. W. Wu, T. H. Hsueh, and S. H. Hsu, Fiber. Polym., 9, 307 (2008). 16. M. Z. Elsabee, E. S. Abdou, K. S. A. Nagy, and M. Eweis, Carbohydr. Polym., 71, 187 (2008).
C. X. Wang et al.
17. J. P. Chen, C. Y. Kuo, and W. L. Lee, Appl. Surf. Sci., 262, 95 (2012). 18. C. X. Wang, Y. Ren, and Y. P. Qiu, Surf. Coat. Technol., 202, 77 (2007). 19. C. X. Wang, M. Du, and Y. P. Qiu, Surf. Coat. Technol., 205, 909 (2010). 20. S. J. Park and J. S. Jin, J. Colloid Interface Sci., 236, 155 (2001). 21. Y. Qiu, C. Zhang, Y. J. Hwang, B. L. Bures, and M. Mccord, J. Adhes. Sci. Technol., 16, 99 (2002). 22. C. X. Wang, H. L. Xu, Y. Liu, and Y. P. Qiu, Surf. Coat. Technol., 202, 2775 (2008). 23. H. Krump, I. Hudec, M. Jasso, E. Dayss, and A. S. Luyt, Appl. Surf. Sci., 252, 4264 (2006). 24. C. Cheng, L. Y. Zhang, and R. J. Zhan, Surf. Coat. Technol., 200, 6659 (2006). 25. C. X. Wang, Y. Liu, H. L. Xu, Y. Ren, and Y. P. Qiu, Appl. Surf. Sci., 254, 2499 (2008). 26. P. Erra, R. Molina, D. Jocic, and M. R. Julia, Text. Res. J., 69, 811 (1999). 27. A. J. W. Moore, Wear, 65, 274 (1980). 28. S. Davarpanah, N. M. Mahmoodi, M. Arami, H. Bahrami, and F. Mazaheri, Appl. Surf. Sci., 255, 4171 (2009). 29. A. Hesse, H. Thomas, and H. Hocker, Text. Res. J., 65, 355 (1995). 30. R. J. Ward, H. A. Willis, G. A. George, G. B. Guise, R. J. Denning, D. J. Evans, and R. D. Short, Text. Res. J., 63, 362 (1993). 31. R. Molina, J. P. Espinos, F. Yubero, P. Erra, and A. R. Gonzalez-Elipe, Appl. Surf. Sci., 252, 1417 (2005). 32. T. Arai, G. Freddi, R. Innocenti, D. L. Kaplan, and M. Tsukada, J. Appl. Polym. Sci., 82, 2832 (2001). 33. D. Jocic, S. Vílchez, T. Topalovic, R. Molina, A. Navarro, P. Jovancic, M. R. Julià, and P. Erra, J. Appl. Polym. Sci., 97, 2204 (2005).