International Journal of Software Engineering & Applications (IJSEA), Vol.3, No.4, July 2012
EFFECTIVE IMPLEMENTATION OF AGILE PRACTICES – OBJECT ORIENTED METRICS TOOL TO IMPROVE SOFTWARE QUALITY Veerapaneni Esther Jyothi1, Kaitepalli Srikanth2 and K. Nageswara Rao3 1
Assistant Professor, Department of Computer Applications, V.R.Siddhartha Engineering College, Vijayawada – 7, Andhra Pradesh, India
[email protected] 2
Assistant System Engineer, Tata Consultancy Services, Hyderabad, India
[email protected] 3
Professor & Head, Department of Computer Science and Engineering, P.V.P.Siddhartha Institute of Technology, Vijayawada – 7, Andhra Pradesh, India
[email protected]
ABSTRACT Maintaining the quality of the software is the major challenge in the process of software development. Software inspections which use the methods like structured walkthroughs and formal code reviews involve careful examination of each and every aspect/stage of software development. In Agile software development, refactoring helps to improve software quality. This refactoring is a technique to improve software internal structure without changing its behaviour. After much study regarding the ways to improve software quality, our research proposes an object oriented software metric tool called “MetricAnalyzer”. This tool is tested on different codebases and is proven to be much useful.
KEYWORDS Agile, Refactoring, Metrics, Interpretation, Advice
1. INTRODUCTION Based on the developments in the business Software frequently undergoes changes. These changes in the software generally made under the demand of time and budget. Obviously the developer have to compromise on quality if he does any changes not taking into account the impact of the changes on the software. Though a solitary change may not have a negative impact, multiple changes with their interplay might affect severe troubles in the long run. Lehman’s law states some important characteristics of software system: Law I: continuous change is necessary to preserve satisfaction and Law II: says that the complexity of the system increase with the number of changes if it is not reduced with additional work [1]. Eventually we are left with a software design, which is complex and entangled. To improve the quality of the software the design problems must be identified and eradicated otherwise they may cause the system to display low maintainability, low reuse, high complexity and flawed behaviour. Software inspection involves a vigilant assessment of the code, the design, and the certification of the software and checking for the features that are notorious to be potentially challenging based on the past occurrence. It is normally acknowledged that the cost of fixing a DOI : 10.5121/ijsea.2012.3402
13
International Journal of Software Engineering & Applications (IJSEA), Vol.3, No.4, July 2012
bug is much lower when that bug is found earlier in the development cycle. Refactoring is a technique to improve software internal structure without changing its behaviour [2]. We tried to detect the code smells [3] in the codebase of a java project by using our tool called “MetricAnalyzer”. This tool examined the code and has come up with an advice to refactor in order code to improve the software quality. This process involves different phases. This research paper is organised into different phases systematically as follows: Section 2: Decide upon Metrics [IDENTIFYING PHASE] Section 3: Apply metrics on codebase [EVALUATION PHASE] Section 4: Result analysis [INTERPRETATION AND ADVISING PHASE] Section 5: Refactoring the codebase [APPLICATION PHASE]
2. IDENTIFYING PHASE Object-oriented design and development is becoming very popular in today’s software development environment. It entails not only a special approach to design and implementation; it requires different software metrics. Since object oriented technology exploits objects and not algorithms as its elemental building blocks, the approach to software metrics for object oriented programs must be different from the standard metrics set. Some metrics, such as lines of code and cyclomatic complexity, have become accepted as "standard" for traditional functional/ procedural programs, but for object-oriented, there are many proposed object oriented metrics in the literature. Object oriented metrics was to focus on the primary, critical constructs of object orienteddesign and to select metrics that apply to those areas. The suggested metrics aresupported by most literature and some object oriented tools. The metrics evaluate theobject oriented concepts: methods, classes, complexity and inheritance. The metrics focuson internal object structure that reflects the complexity of each individual entity andon external complexity that measures the interactions among entities. The metricsmeasure computational complexity that affects the efficiency of an algorithm andthe use of machine resources, as well as psychological complexity factors that affect the ability of a programmer to create, comprehend, modify, and maintain software. Table 1 presents an overview of the metrics applied he “MetricAnalyzer” tool for object oriented systems. Table 1. Metrics applies on code base Metric
Object Oriented Concept
TNOA Number of Attributes WMPC Weighted Methods per Class NOCP Number of Classes MIT Maximum Inheritance Tree CCIM Cyclomatic Complexity SIZE Lines of Code
Class
Both Static and Instance Variables
Class
Both Static and Instance Methods
Package Class Method Class
Measurement Method
All the classes in a Package Maximum length from class to Root node Number of linearly independent paths in the Method Non Comment and Non Blank Lines
14
International Journal of Software Engineering & Applications (IJSEA), Vol.3, No.4, July 2012
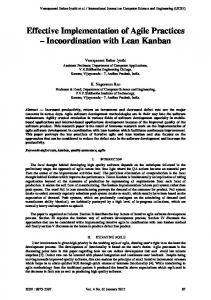
Figure 1. DFD of the MetricsAnalyzer tool
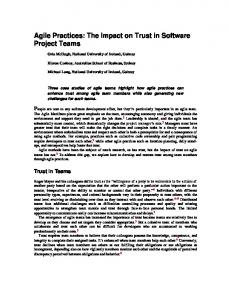
3. EVALUATION PHASE The Metrics part of the MetricAnalyzer tool applies and extracts information from the development environment. As Figure 2 illustrates, this information may deal with artifacts in the repository (R) or with the Projects themselves (P1, P2, P3).
Figure 2. Process involved in MetricsAnalyzer tool
The following are the code snippets for four metrics TNOA (Total Number of Attributes), WMPC (Weighted Methods per Class), MIT (Max Inheritance Tree), NOCP (Number of classes Per Package) written as a part of “MetricAnalyzer” tool development which are provided for examination.
15
International Journal of Software Engineering & Applications (IJSEA), Vol.3, No.4, July 2012
TNOA (Total Number of Attributes)
Figure 3. Code snippet for the metric TNOA
WMPC (Weighted Methods per Class)
Figure 4. Code snippet for the metric WMPC
MIT (Max Inheritance Tree)
Figure 5. Code snippet for the metric MIT
16
International Journal of Software Engineering & Applications (IJSEA), Vol.3, No.4, July 2012
NOCP (Number of classes Per Package)
Figure 6. Code snippet for the metric NOCP
4. INTERPRETATION AND ADVISING PHASE As we can see in Figure 1 and Figure 2, the interpretation part of the MetricAnalyzer takes the extracted metric values in Metric Evaluation Phase from the source code and compare these values with the threshold values of the corresponding metric values. If the extracted metric values lies below the corresponding metric threshold value means that no occurrence of the issue that is being observed and extracted metric values lies above the corresponding metric threshold value means maximum occurrence of the observed issue. The crucial step in defining the interpretation for the extracted metrics lies in defining the thresholds for metrics. This should preferably be done based on historical data and experience from earlier projects [4]. Industry bench- marks can also be used for this purpose. The thresholds should be monitored and updated as the team learns and its process evolves. The Metrics and the threshold values of these metrics are shown in Table 2. Table 2. Metric values of Version1 TNOA
Version1
WMPC
Avg
Max
Avg
Max
Avg
Max
35
95
11.56
15
3
3
MIT
Version1
NOCP
CCIM
TLOC
Avg
Max
Avg
Max
Total
Avg
Max
2.57
6
3.36
56
2500
500
1800 17
International Journal of Software Engineering & Applications (IJSEA), Vol.3, No.4, July 2012
The following are the screenshots of the “MetricAnalyzer” tool for all the six metrics TNOA (Total Number of Attributes), WMPC (Weighted Methods per Class), MIT (Max Inheritance Tree), NOCP (Number of classes Per Package), CCIM (Cyclomatic Complexity), SIZE (Total Lines of Code). The red highlighter shows that the value exceeded the metric threshold value.
Figure 7. Screen shot for selection of project in the “MetricAnalyzer” tool
4.1. TNOA (Total Number of Attributes) • It Count the total number of attributes for a class. • The attributes of a class include the number of static variables and number of instance variables. Threshold value: A high number of attributes (> 10) probably indicate poor design. Problem: A class with too many attributes may indicate the presence of coincidental cohesion. Solution: The class requires ecomposition, in order to better manage the complexity of the model.
18
International Journal of Software Engineering & Applications (IJSEA), Vol.3, No.4, July 2012
Figure 8. Screen shot for TNOA metric in the “MetricAnalyzer” tool
4.2. WMPC (Weighted Methods Per Class):• It counts all class operations (methods) per class. • The methods of a class include the number of static methods and number of instance methods. Threshold value: Between 3 and 7. This indicate that a class has operations, but not too many. Problem: Lack of primitiveness in class operations (inhibiting re-use). Solution: Decompose the class having more methods.
Figure 9. Screen shot for WMPC metric in the “MetricAnalyzer” tool
19
International Journal of Software Engineering & Applications (IJSEA), Vol.3, No.4, July 2012
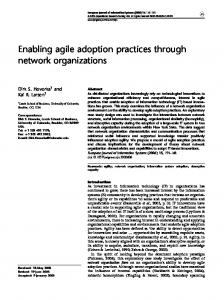
4.3. NOCP (Number of classes Per Package):• It Count the Number of classes in a package p. More classes means more complex, because the number of potential interactions between objects is higher. Threshold value: Maximum 12. Problem: Reduces the comprehensibility of the system, which in turn makes it harder to test, debug and maintain. Solution: Extract the classes that are co-related and create the new package.
Figure 10. Screen shot for NOCP metric in the “MetricAnalyzer” tool
4.4. MIT (Max Inheritance Tree) • It calculates the longest path from the class to the root of the inheritance tree. • Threshold value: The value of DIT must be between 0 and 4 Problem: Classes with high DIT indicate that It Compromise encapsulation and increase complexity Solution: Decompose the class that having the high depth of inheritance tree.
Figure 11. Screen shot for MIT metric in the “MetricAnalyzer” tool 20
International Journal of Software Engineering & Applications (IJSEA), Vol.3, No.4, July 2012
4.5. CCIM (Cyclomatic Complexity):• It measures the number of linearly independent paths through a program module. i.e, the amount of decision logic in a single software module. It is calculated per class. • Counts the number of flows through a piece of code. Each time a branch occurs (if, for, while, do, case, catch and the ?: ternary operator, as well as the && and || conditional logic operators in expressions) this metric is incremented by one Threshold value: The acceptable range must be between 1and10 Problem: A method with a CC value greater than 10 indicates the high code complexity. Solution: Extract the Class or Extract Method
Figure 12. Screen shot for CCIM metric in the “MetricAnalyzer” tool
4.6. SIZE (Total Lines of Code):There are two variants of size metric they are function points (fp) and Total Lines of code (TLOC) metric. TLOC is considered in our paper. • •
TLOC metric will count the non-blank and non-comment lines in a class. This is the simplest way to measure the size of the system.
Threshold value: The acceptable range is between Max 750 Problem: A class with TLOC value greater than 750 increases overall size of the system and reduces the comprehensibility. Solution: Split up the class and delegate its responsibilities.
21
International Journal of Software Engineering & Applications (IJSEA), Vol.3, No.4, July 2012
Figure 13. Screen shot for SIZE metric in the “MetricAnalyzer” tool
5. APPLICATION PHASE Software Refactoring is the process of changing a software system in such a way that it does not alter the external behavior of the code yet improves the internal structure [6]. It improves the design of the software by eliminating redundancy and reducing complexity. The resulting software is easier to understand and maintain. Software refactoring is a technique to enhance the maintainability of software, improve reusability and understandability of the software. Our tool “MetricAnlyzer” applies the Object Oriented metrics on the code base and these metric values are then interpreted. Then various refactoring techniques were used to improve the code design and along with that we also studied the impact of refactoring on the software quality through various metrics [5]. The red highlighter showed the values which exceeded the metric threshold value and this made us to refactor those parts of the code base and improve the quality of software. In the refactoring process the metric values are improved by moving close to the threshold values. Version1 values are the metric values before refactoring and Version2 and Version3 values are the metric values after refactoring which are given in the following tables for the six metrics taken. Table 3. Comparison of Metric values of Version1, Version2 and Version3 for the first three metrics TNOA
WMPC
NOCP
Avg
Max
Avg
Max
Avg
Max
Version1
35
95
11.56
15
3
3
Version2
16.1
39
5.89
15
9
9
Version3
11.3
41
5.5
15
12
12
22
International Journal of Software Engineering & Applications (IJSEA), Vol.3, No.4, July 2012 Table 4. Comparison of Metric values of Version1, Version2 and Version3 MIT
CCIM
TLOC
Avg
Max
Avg
Max
Total
Avg
Max
Version1
2.57
6
3.36
56
2500
500
1800
Version2
4.11
6
2.53
26
2300
290
900
Version3
4.5
6
2.43
13
1524
127
508
100 80
Version1
60
Version2
40
Version3
20
TNOA WMPC NOCP
MIT
Max
Avg
Max
Avg
Max
Avg
Max
Avg
Max
0
Avg
METRIC VALUES
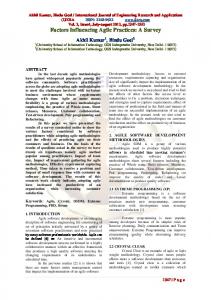
Comparison of Metric values of Version1, Version2 and Version3
CCIM
METRICS
Figure 13. Graph depicting the Metric values of Version1, Version2 and Version3
23
International Journal of Software Engineering & Applications (IJSEA), Vol.3, No.4, July 2012
6. CONCLUSIONS In Agile software development, refactoring helps to improve software quality. Our object oriented software metric tool “MetricAnalyzer” proposed in this paper showed us great results after refactoring the code compared to the original code base of different projects. As we have shown the graphical result, this tool was very much useful in eliminating code smells from the code and maintains threshold values of the considered object oriented metrics.
REFERENCES [1]
[2] [3] [4] [5] [6]
M.M Lehman, D.e Perry, J.F.Ramil, W.M Turksi, and P.Wernick, “ Metrics and Laws of Software Evolutionthe nineties view.” In Proceedings of the 4th International Symposium on Software Metrics, Metrics, Albuquerque, New Mexico,2000. IEEE Markuz Pizka, ”Straightening Spaghetti-Code with Refactoring” Eva van Emden , Leon Moonden, “Java Quality Assurance by Detecting Code Smell” R.S. Arnold, “An Introduction to Software Restructuring,” Tutorial on Software Restructuring, R.S. Arnold, ed., 1986. D.M. Coleman, D. Ash, B. Lowther, and P.W. Oman, “Using Metrics to Evaluate Software System Maintainability,” Computer, vol. 27, no. 8, pp. 44-49, Aug. 1994. N. Van Eetvelde and D. Janssens, “A Hierarchical Program Representation for Refactoring,” Proc. UniGra’03 Workshop, 2003.
Authors Mrs. Veerapaneni Esther Jyothi is a Microsoft certified professional, currently pursuing Ph.D. She is working as an Asst. Professor in the department of Computer Applications, Velagapudi Siddhartha Engineering College since 2008 and also has Industrial experience. She has published papers in reputed international conferences recently. Her areas of interest include Software Engineering, Object Oriented Analysis and Design and DOT NET. Dr. K. Nageswara Rao is currently working as Professor and Head in the department of Computer Science Engineering, Prasad V. Potluri Siddhartha Institute of Technology, Kanuru, Vijayawada-7. He has an excellent academic and research experience. He has contributed various research papers in the journals, conferences of International/national.
Mr. Kaitepalli Srikanth is Asst. System Engineer in TCS (Tata Consultancy Services). He was recruited as a part of campus placements from Velagapudi Ramakrishna Siddhartha Engineering College, Vijayawada and is going to complete his master’s degree from the department of Computer Applications.
24