Effective Web Service Loadbalancing through Statistical Monitoring George Porter Computer Science Division Univ. of California Berkeley Berkeley, CA 94720
[email protected]
A BSTRACT Multi-tier web services enable efficient, scalable, and composable Internet services. But, as they become increasingly complex, so too does the underlying middleware layer. During high demand periods, some components, such as persistent storage, become overloaded. This leads to long response times that make the site unusable. Formulating admission control policies for web services is a daunting and error-prone task, because even modest-sized web sites can consist of dozens to hundreds of request types. There is a lack of system tools and instrumentation for operators to identify connections between requests and their effects. Thus, we need more self-adaptive web services that can expose these effects to the operator and give he or she the tools to appropriately respond to overload. We propose an approach to designing such self-adaptive web services by relying on 1) simple statistical techniques for uncovering request effects in multi-tier systems, 2) a blackbox approach to component monitoring, 3) a visualization tool summarizing statistical results to facilitate human decision making, and 4) efficient techniques for operators to invoke admission control based on those statistical findings. We argue that including humans in the loop compliments, rather than detracts, from self-adaptive design goals. Additionally, we describe ongoing work on an implementation of a web service that embodies these mechanisms. Our approach leads to a web service that can serve approximately 70% more requests, while lowering the maximum request latency by over 78%. I. I NTRODUCTION AND M OTIVATION “Web Services” are increasingly used for deploying webbased application portals such as eBay[10] and Amazon.com[1]. They are commonly built using middleware, that is, composable building blocks such as Http containers, Javabased application “beans”, and persistent state management. These components are distributed across tiers of servers–web, application, and database. As web services offer newer and more sophisticated functionality, the underlying realization of those services in the middleware become more complicated. Today’s web services can consist of dozens or hundreds of request types and middleware components. The separation and replication of components allows web services to scale in response to new resource demand. They do
Randy H. Katz Computer Science Division Univ. of California Berkeley Berkeley, CA 94720
[email protected]
this by introducing new servers hosting the particular component in need. Despite this scalability, flash traffic patterns can drive a web system’s middleware component (or components) into overload. This leads to poor performance as the system is unable to keep up with the demands placed on it and users see increased response times for their requests (See Figure 3(a)). Experiments have indicated that users can tolerate roughly eight seconds of delay before they either retry their request or leave the site[4]. While the need for an admission control scheme is clear, formulating an effective system is daunting and error-prone. This is due to the large number of request types and middleware components. Different requests to a web service stress different middleware components[2], [5], [6]. It is advantageous to preferentially throttle those requests most correlated to the bottleneck. To do that, better visibility into the relationship between requests and their effects is necessary. Unfortunately, current system software and site monitoring tools do not provide the operator with this visibility. For web services to be more self-adaptive, they need to be more introspective, identifying correlated effects between internal components, so that the operator can act to shed load from overloaded components without penalizing all users to the site. To design such self-adaptive web services able to gracefully respond to overload, we propose four design mechanisms: 1) simple statistical techniques for uncovering request effects in multi-tier systems, 2) a black-box approach to middleware component monitoring, 3) a visualization tool summarizing statistical findings to facilitate human decision making, and 4) efficient techniques for operators to invoke admission control decisions based on those findings. We will also argue that including humans in the loop compliments, rather than detracts, from self-adaptive design goals. We present ongoing work on a web service based on the open-source RUBiS auction site[17] that embodies these mechanisms. RUBiS is a web-service benchmark designed to profile the performance of an auction site like eBay. Our approach leads to a web service which is able to serve 70% more requests per second. Additionally, the maximum request latency seen by the user is reduced over 78%. These initial results show promise that middleware-based web services can greatly benefit from more self-adaptive design.
II. R ELATED W ORK Recent large Internet sites such as Amazon.com[1] and eBay.com[10] have adopted a 3-tier approach to designing their sites. Examples of middleware layers include Sun’s J2EE system[13] and BEA Logic’s WebLogic[3]. Several open source web middleware systems have also been developed, such as JONAS[15] and JBoss[14]. We can study the performance and operation of Java-based middleware systems using the RUBiS system[17], a publicly available workload generator patterned on eBay. The authors of RUBiS showed that the mixture of requests–the workload– plays a large role in determining system bottlenecks[2], [5], [6]. This differs from some previous attempts to apply control theory to operating systems and 3-tier systems, which has assumed that requests to the system are homogeneous, that is, affect the system in the same way. The SWIFT system[11], [12] is a systematic approach to introducing input/output interfaces to operating system components, which matches well with the well defined interfaces between middleware components. The ControlWare system[21] is a toolkit for automatically mapping QoS requirements into simple control loops in 3-tier systems. Considerable work has been applied to correlation analysis of web services both in research literature and in the form industrial best practices. The SLIC project at HP Labs[7] attempts to identify which components are responsible for web service SLO violations by fine-grained monitoring and instrumentation. Our work is complementary. We differentiate requests so that control theory controllers have finer grained actuation opportunities with macro-level observations. The Performance Management project at IBM has explored using control theory and statistical monitoring to detect and adapt to unexpected traffic surges[16], [8]. Our work has focused on black-box approaches to middleware systems that avoids fine-grained instrumentation code. However if additional information is available, our system would benefit from the above mentioned techniques. The visualization of structured data, including web data, has been studied in [9], [19], [20]. Our work attempts to use visualization techniques to show the weight of various requests in terms of their correlation with bottlenecks with little system or component knowledge. III. OVERLOAD AVOIDANCE IN S ELF -A DAPTIVE W EB S ERVICES Overload occurs when the load placed on a web service exceeds its ability to serve requests. Flash traffic and sudden load spikes operate at timescales faster than operators can upgrade their system. Overload mitigation strategies can be used, at least temporarily, during this time. Load shedding often takes the form of HTTP-level admission control, in the form of status code 503 TOO BUSY responses to the user. However, this adversely affects all traffic to the site, even when the bottleneck is driven by a small population of requests
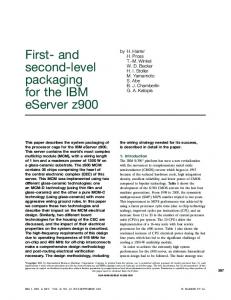
(about 15%, in our RUBiS emulation). This motivates the need for selective admission control. In selective admission control, we first throttle back requests contributing to the overload, while leaving all other requests unaffected. In our implementation, the bottleneck was the database’s CPU, and the two contributing requests involved searching for items. Problem statement: Given a system bottleneck component C, identify those requests correlated with C. The data used for that purpose should be collected with minimal disruption to the system. Once identified, reduce the number of correlated requests until the system is no longer overloaded. We now outline the four mechanisms of our approach in more detail. A. Uncovering Request Effect through Correlations When a request arrives to the web server, it may invoke processing in one or more Java components in an application tier. In turn, these either access the database, or return a result directly to the user. While logging and status information is available on each of the servers hosting these tasks, there are no good system tools for understanding crosscuts through the layers. Given the large number of possible crosscuts, we need a more sophisticated way of looking through the large amount of data collected at each point to discern correlations between components. To find which requests are correlated with our bottleneck, we make use of 1) the Apache web logs collected from the web tier, and 2) the CPU load average as reported by the sysstat[18] tool. Our choice of these systems-level metrics is explained in Section III-B. We chose to use Pearson’s Correlation Coefficient to find the relationship between request type and CPU load, because it is efficient and simple to calculate. For that statistical technique, we processed the logs as follows: 1) Divide the Apache web log into time intervals tint . (We chose tint = 1s) 2) For each interval, count the number of each request type. 3) Form an n by m matrix M where n is the number of time intervals, and m is the number of request types. Element (i,j) of M represents the number of requests of type j that arrived in time period i. We then find the correlation between columns of this matrix and the vector of CPU load from the database (This technique can be used for other bottlenecks such as disk I/O). The result is shown in Figure 1. The request types highlighted in bold are those significant (to the α = 0.05 level) and positive. These are the candidate request types that should undergo admission control. We found the results surprising, since before performing the analysis we expected more of the requests to be correlated with database CPU load, for example BrowseCategories.php (which returns more results than SearchItemsByCategory.php). In fact, the requests identified by our algorithm represent a small fraction of the total requests, yet account for a large load on the database. We have studied more complicated statistical modeling techniques, such as stepwise regression, however
Request Type BrowseCategories.php BrowseRegions.php SearchItemsByCategory.php SearchItemsByRegion.php AboutMe.php RegisterUser.php SellItemForm.php RegisterItem.php ViewItem.php PutComment.php ViewUserInfo.php PutBidAuth.php PutBid.php BuyNowAuth.php BuyNow.php ViewBidHistory.php
P-value 0.1747 0.0926 0.0000 0.0034 0.7702 0.4876 0.4891 0.8767 0.0953 0.5157 0.4646 0.8641 0.2566 0.9710 0.1206 0.9741
Coefficient -0.0350 -0.0434 0.5654 0.0756 0.0075 -0.0179 0.0179 0.0040 -0.0431 -0.0168 -0.0189 -0.0044 -0.0293 -0.0009 0.0401 -0.0008
Fig. 1. Request effects on the system bottleneck as discovered by Pearson’s correlation coefficient. Highlighted entries are statistically significant and have positive correlations. We choose these requests as candidates for selective admission control.
simple pairwise correlation are sufficient to uncover request effect in our system. B. Black-box Component Monitoring Self-adaptive systems rely on sufficient self-monitoring to drive statistical inference algorithms, however that monitoring should be as minimally invasive as possible. There are at least three motivations driving this requirement: 1) Fear of disrupting a running service. When we discussed implementing our approach on a large, political web log, the operator responded by saying: “My concern, obviously, is that (the site) isn’t a laboratory project, but a real world application that must maintain as high an up-time as possible. So I’d be wary of experimenting in a way that would potentially compromise service.” Thus, we base our statistical analysis on data that is easily accessible and routinely collected (web logs and sysstat measurements). Additionally, instrumenting operating systems components like file systems and system call interfaces is very system-specific, and requires expert knowledge. Since hardware and software changes are often frequent events, such low-level instrumentation code would need to be rewritten each time a component is upgraded or changed. 2) Rapidly changing services. A fact of the web today is that it undergoes rapid change. Both the capabilities of the site change, as well as the traffic patterns arriving to it. A large web site likely upgrades hardware and software components on a regular basis. Operators will resist invasive monitoring and instrumentation that has to be replicated whenever system components are upgraded. By treating each component as a black box, we do not modify individual system components (such as the
Correlated vs Uncorrelated Requests
11% 85%
15%
4%
Uncorrelated SearchItemsByRegion.php
SearchItemsByCategory.php
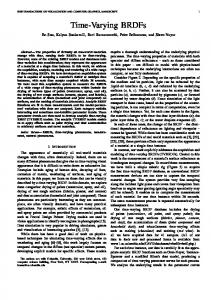
Fig. 2. This visualization shows the requests identified by our system as candidates for selective admission control. Additionally, the graph shows their percentage of the total number of requests. Operators can use this information to judge how proposed changes will affect the system.
filesystem, O/S system calls, or other hooks). This makes our approach more portable as well as less invasive. 3) Distributed ownership of components. Depending on the nature of the service, responsibility for the site might be partitioned between several system operators. For example, a content group might write enterprise Java beans for a new service, while a different group maintains the application container. Coordinating monitoring operations between these can be difficult. By focusing on high-level component monitoring, different groups do not have to coordinate software upgrades and system modifications. Additionally, it may be impossible to instrument components that are not open-source. As our results in Section IV, high-level measurements are often sufficient for identifying correlations and request effect that can greatly improve running systems. C. A Visualization Tool for Automatic Overload Mitigation We advocate an approach for building self-adaptive web services in which the operator plays an important role, and remains “in the loop”. By better visualizing underlying connections between components and load, operators become better decision makers than they would become otherwise. We revisit the three motivations from the previous section and show how better visualization addresses them: 1) Fear of disrupting a running service. Like all large systems, web sites are built up and tweaked over time. Operators are resistant (to put it mildly!) to turning control over their sites to automatic systems. Instead, we see that systems can become self-adaptive by presenting operators with relevant information needed to diagnose and pinpoint performance problems as well as suggestions for how to proceed. This allows operators to incorporate
these observations in planning and managing the service. In addition to acting as a useful systems management tool, taking this approach increases the likelihood of adoption. Once operators feel more comfortable with the tool, it can be made more automatic. 2) Rapidly changing services. A fully-automatic approach to system optimization would have to capture information about which requests are important, which parts of the web service have preference over other parts, and so on. In dynamic systems, these factors change rapidly. Sometimes important customers or products should get priority over others (e.g., those that pay more get more). Rather than formalizing these relationships in our algorithm, we use the visualization tool as a way for operators to make decisions that respect these site-specific preferences. If they want to implement the recommendations, or just part of the recommendations, they can choose to do so. Again, as the tool is used more often, some admission control decisions might be programmed to take effect automatically without operator involvement. 3) Distributed ownership of components. Because modern web services are distributed across middleware components and servers, identifying the effect of requests on resources can not be done at a single point, or within one administrative group (in multi-group management environments). So while the database manager might know that the CPU becomes overloaded weekday afternoons, it is the web site operator who realizes that load to a particular Java component peaks at that time. By visualizing request effect through the system, these observations can be correlated into one display that gives more insight to the system’s operation. In our system, the visualization capability is still under development. However Figure 2 gives an example of the type of information we expect it to convey. The pie chart shows the percent of traffic that is correlated to our bottleneck. Within the correlated slice, specific request types are enumerated. From this simple graph, an operator can see which requests would be affected by selective admission control, as well as what percent of the total traffic they represent. The operator might choose to implement the policy as given, or they might choose a subset of the correlated requests. The next section outlines how their decision would be implemented in the network itself. D. Effective Actuators for Admissions Control Once a subset of the requests are identified as candidates for selective admission control, the operator needs a way to reduce the rate at which they arrive. This can be done at the HTTP level through 503 TOO BUSY status messages, or at the network level through bandwidth shaping. We chose to implement the throttling at the network level, since that did not involve modifying the web tier. The specific actions taken in our system are described in Section IV. To tie together the visualization tool and the actuators for admission control, we envision an interface in which each request type is listed, along with its likelihood of relieving
the noticed bottleneck based on our statistical findings. Such a display resembles a ”top talkers” graph. In Figure 2, they would be able to select requests identified by the bar graph. Once selected, new filters could be sent to the webserver (in the case of HTTP-based throttling), or to the network appliance (for network-level throttling). In either case, the operator would have a tactile way to see the effect of their choice on both the bottleneck and the arriving traffic. Extending the visualization capabilities of our system to include this interface is ongoing work. IV. I NITIAL R ESULTS We have deployed a web service based on the RUBiS auction site that embodies the four mechanisms outlined in this paper. Our testbed consists of an IBM BladeCenter populated with twelve HS20 server blades. Each blade has two 3.06 GHz Xeon processors, 1.5 GB of RAM, and two 40 GB IDE hard drives. Additionally, each blade has two BroadCom gigabit Ethernet adapters connected via passive backplane to two Nortel Layer 2-7 Gigabit Switches. The Nortel switches can perform deep packet inspection to identify HTTP request types (based on URL pattern matching) at gigabit rates and assign VLAN tags to packets that should be subject to admission control. To perform the bandwidth throttling, we use the Linux Traffic Control (tc) extensions to reduce the rate of correlated requests from 3.5 Mbits/sec to 1.0 Mbit/sec. As Figures 4 and 3(b) show, performing this selective admission control greatly improves the performance of the web service for users who are not causing bottlenecks. In our deployment, the number of requests per second went from 462 to 782. This gain is possible because the number of heavy requests (those correlated with the bottleneck) allowed per unit time is reduced. Therefore, it will take longer to search for a series of several items. This is highlighted in the longer average session time (872 seconds vs 670 seconds), since each session consists of a set of subsequent searches, among other operations. As the positive effect on number of requests per second as well as the maximum request time show, such a reduction provides a great benefit to the user experience seen by many of the visitors to the site. V. C ONCLUSION AND F UTURE W ORK We have proposed an approach to building self-adaptive web services based on four design mechanisms: 1) simple statistical techniques for uncovering request effects in multi-tier systems, 2) a black-box approach to component monitoring, 3) a visualization tool for summarizing statistical findings, and 4) efficient techniques for invoking admission control decisions. We are in the process of building an auction web service embodying these mechanisms, and the results are promising: over a 70% increase in pages served per second, and over a 78% decrease in the maximum latency seen by users to the site. We are encouraged by these results, as they show the promise in building and deploying more self-adaptive web services.
Request Time Distribution (stat adm cntl, 3500 clients) 1
0.9
0.9
0.8
0.8
CDF (percent of requests)
CDF (percent of requests)
Request Time Distribution (stock, 3500 clients) 1
0.7 0.6 0.5 0.4 0.3
0.7 0.6 0.5 0.4 0.3
0.2
0.2
0.1
0.1
0