European Journal of Science and Mathematics Education Vol. 2, No. 2, 2014
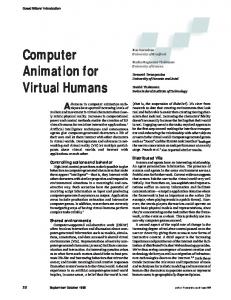
Effectiveness of computer animation and geometrical instructional model on mathematics achievement and retention among junior secondary school students Gambari, A. I. (Ph.D)1, Falode, C. O. & Adegbenro, D. A. Science Education Department Federal University of Technology, Minna For correspondence:
[email protected] Abstract: This study investigated the effectiveness of computer animation and geometry instructional model on mathematics achievement and retention on Junior Secondary School Students in Minna, Nigeria. It also examined the influence of gender on students’ achievement and retention. The research was a pre‐test post‐test experimental and control group design. 40 junior secondary school students were drawn from two secondary schools within Minna metropolis. Stratified random sampling technique was used to select 40 students (20 males and 20 females). The Geometry Achievement Test (GAT) was used for data collection. The reliability coefficient of 0.87 was obtained using Kuder‐Richardson (KR‐20). GAT was administered to students as pre‐test and post‐test. The students’ pre‐ test and post‐test scores were analyzed using t‐test statistics. The results indicated that the students taught geometry using computer animation performed significantly better in posttest and retention test than their counterparts taught geometry using instructional model and conventional method respectively. However, there was no significant difference reported in the post‐test performance scores of male and female students taught geometry using computer animation and instructional model respectively. These findings indicated that geometry concept in mathematics could be taught and learnt meaningfully through the use of computer animation. Keywords: Computer Animation, Instructional Models; Geometry; Gender; Retention
Introduction Mathematics has become the central intellectual discipline of all technological societies and it is indispensable in helping the individual to think more clearly about the values involved in this fast changing world (Abimbade & Udousor, 1997). Fapohunda (2002) sees mathematics as an essential tool in the formation of the educated man. Its application in other disciplines, mostly in the sciences is appreciative and without it, knowledge of the sciences often remains superficial. In Nigeria, mathematics is taught as a core subject to all students at the primary and secondary school levels in order to give a sound basis for scientific and reflective thinking, and prepare them for the next level of education (FRN, 2004). In spite of the importance and popularity of mathematics among Nigerian students, performance at junior secondary school level had been poor (Iwendi, 2012; NECO, 2012). Studies have shown that Nigerian students’ achievement in secondary school mathematics has been relatively low over the years (Agwagah, 2000; Obodo, 2004; Osemwinyen, 2008; WAEC, 2011; & Gimba, 2013). Several factors have been attributed to the poor performance in secondary school mathematics, among which are: poor methods of teaching (Harbour‐Peters, 2001), poor interest in mathematics (Badmus, 2002 & Obodo, 2004), gender difference (Agwagah, 2000) and lack of appropriate instructional materials for teaching mathematics at all levels of education in Nigeria (Gambari, 2010). Various attempts have been made towards improving the low achievement and retention level of
127
128
European Journal of Science and Mathematics Education Vol. 2, No. 2, 2014
secondary school students in mathematics without any remarkable success (Gimba, 2006; Iwendi, 2009) Poor teaching method is one of the major factors influencing poor achievement and retention (Osemwinyen, 2009; Tolu, 2009). Mathematics has several branches and some of these branches are more difficult for teachers to teach and students to learn than others. The basic geometry at junior secondary level serves as a background for understanding all branches of geometry at higher level. Research findings have confirmed that geometry is one of the topics among the abstract and complex aspects of mathematics, which students find difficult to learn, and some teachers find difficult to teach without the use of instructional materials (Akinlade, 2004 & WAEC, 2011). Instructional materials such as mathematical models have potentials in the teaching of abstract concepts such as geometry (Gambari & Gana, 2005). Abimbade (1997) concluded that instructional models enhance visual imagery, stimulates learning and assists the teacher to properly convey the topic content to the learner, in order to achieve better understanding and performance. In the review of empirical studies on instructional models, Shih, Kuo and Liu (2012) developed and evaluated the instructional model and learning system and found that the model enhanced mathematical achievement. Aboderin (1997) found that the use of Pythagoras model for mathematics instruction had positive effect on students’ achievement. Joshua (2007) reported that using geometrical globe model for teaching mathematics at senior secondary schools enhanced students’ performance. Also, Gimba (2006) and Gambari (2010) in different studies reported that using 3‐ dimensional instructional model to supplement conventional teaching method produced higher achievement than the use of conventional instruction alone. Computer has been used in the developed countries to tackle most of the teaching and learning challenges since 1980s. It has potential for arousing students’ interest, motivation and achievement (Yusuf & Afolabi, 2010). It can influence students’ attitudes and interest towards mathematics which may positively affect their achievements and retention (Golden, McCrone, Walker & Rudd, 2006). Computer‐Assisted Instructional (CAI) package can be used to teach all subjects including sciences. According to Scott (2004) CAI can be used to provide opportunities for students to learn using drill and practice, tutorial, games and simulation activities, animation, and many others. Animation is processed as a part of the visual information. There were two versions of the illustration mode, static and animated. The static version consisted of a graphic depicting the scientific process with no visual movement to show the process in operation, while the animated version showed the process with visual movement to demonstrate the process in operation. Animations have been defined as images in motion (Dwyer & Dwyer, 2003). The capable features of Animation can enliven the learning experience. Animation which promotes flexibility of learning allowed a wider range of stimuli thus increased the student engagement in learning. Animation seems to attract learners’ attention and increase their motivation to learn. Many students get stimulated on a daily basis by computer animation then our instruction needs to contain computer animation (Martindale, 2007). Animation as an attention gaining strategy helps to reduce the processing demands in science, technology and mathematics (STM). As an elaboration strategy, it also facilitates encoding and retrieval processes by connecting information and providing alternative retrieval pathways (Gagne, 1985). Pavio’s (1986) dual coding theory identified two separate information processing systems which is a visual system that processes visual knowledge, and a verbal system for processing verbal knowledge. According to Paivio (1986) and Riber (1994) animation that combines visual and verbal knowledge may store information into long‐term memory thus facilitates encoding and retrieval process.
European Journal of Science and Mathematics Education Vol. 2, No. 2, 2014
Previous studies revealed that animation had facilitated the learner encoding process than static visuals (Lin, 2001). Rieber, Boyce and Assad (1990) suggested that animation helped decrease the time to retrieve information from long‐term memory and then subsequently reconstruct it in short‐term memory. Kearsley (2002) studies show that students who learn from animation have greater self‐ esteem and motivation. His studies also show that students may retain information and sustain the learning process increases. Mayer (1994) in his study showed that computer based animations can be used to promote scientific understanding. Finding also revealed that students performed better on recall and problem solving test when both the verbal and visual systems were utilized. Similarly, Westhoff, Bergman and Carroll (2010) reported that computer animations accompanied with traditional teaching increases the performance of high school biology students. In another study, Karacop and Doymus (2013) found that the teaching of chemical bonding via the animation and jigsaw techniques was more effective than the traditional teaching method in increasing academic achievement. In mathematics, Aktas, Bulut and Yuksel (2011) reported that academic performance of the students increased by using computer animations and activities about patterns. Similarly, Wang, Vaughn, and Liu (2011) found that animation interactivity improved studentsʹ performance in statistics. However, Palmiter and Elkerton (1993) studied the use of animation to aid computer authoring tasks, in their findings, Animation initially assisted both accuracy and speed, but after one week had elapsed, the subjects exposed to animations actually had regressed behind the non‐ animation subjects. Gender issues have been linked with performance of students in academic tasks in several studies but without any definite conclusion. Some studies revealed that male students performed better than females in science (Njoku, 2000). In a similar report, WAEC (1996‐2011) chief examiners’ reports confirmed that boys performed better than girls in mathematics. However, Spencer (2004), Osemmwinyen (2009) and Iwendi, (2012) found no gender difference in the performance of male and female students in school mathematics. Contrary to these reports, Kuruma (2004) and Gimba (2006) found that female students performed better than male students while exposed to geometry, mensuration and 3‐dimensional mathematics instructional materials respectively. Retention which is the ability to reproduce the learnt concept when the need arises has been researched by many researchers. However, Osemmwinyen (2009) found that students’ interests and retention could be aroused and retained through the use of an appropriate instructional media like e‐ learning. Bottge, Rueda, Serlin, Hung, Kwon (2007) found that students with learning disabilities retained what they had learned in mathematics several weeks after instruction, when exposed to Enhanced Anchored Instruction (EAI). Generally, the relevance of geometry and subsequent difficulties experienced by students at junior secondary schools in Nigeria made a study on it pertinent. Moreover only few studies on computer‐ animation in mathematics and related areas at secondary education level were conducted in Nigeria. Especially, using computer animation with special features that enabled learners to visualize the 3D object, receive immediate feedback, self‐paced learning, positive reinforcements, principles of mastery learning, associate learning and step by step learning among others. On these bases, this study examined the effectiveness of computer animation package and geometrical instructional model on the performance of junior secondary school students in mathematics. Purpose of the Study This study investigated the effectiveness of computer animation package and geometry instructional model on the achievement and retention of junior secondary schools students in mathematics. Specifically, the study examined the:
129
130
European Journal of Science and Mathematics Education Vol. 2, No. 2, 2014
(i) (ii)
effectiveness of computer animation package (CAP), geometry instructional models (GIM) and traditional teaching method (TTM) on students’ posttest and retention test, influence of gender on the achievement of students taught geometry with computer animation package and geometry instructional model respectively,
Research Hypotheses (i) There is no significant difference in the mean achievement scores of students exposed to geometry with CAP, GIM and TTM. (ii) There is no significant difference in the mean achievement scores of male and female students taught geometry with CAP. (iii) There is no significant difference in the mean achievement scores of male and female students taught geometry with GIM. (iv) There is no significant difference in the mean retention scores of geometry students taught with CAP, GIM and TTM. Methodology This study adopted a pretest, posttest and delayed posttest design. Three levels of independent variable (two treatments and a control), two levels of gender (male and female) were investigated on students’ achievements and retention in mathematics. Pretest was administered before the treatment and posttest, after four weeks of treatment, delayed posttest (retention test) was administered using Geometry Achievement Test (GAT). The sample for the study was made up of 60 students, 30 male and 30 female students from three public co‐educational junior secondary schools. The schools with common features (equivalent, composition, facilities, exposure) were sampled. The schools were randomly assigned to each of the experimental groups [computer animation package (CAP), geometric instructional model (GIM)] and control group (Traditional Teaching Method) (TTM). A stratified random sample of 60 students (10 males and 10 females) from each of the three schools was employed. Two treatments (CAP and GIM instruments) and one testing instrument (GAT) were employed for this study: Computer Animation Package (CAP) consists of six topics in geometry: Cube; Cuboid; Cylinder; Cone; Sphere & Hemisphere; and Pyramid. The necessity for researcher‐made computer package was based on the fact that the commercially produced computer‐animation packages are not common. Even, if they were available, they may not be directly relevant to the topic or objectives to be achieved in this study. As a result of this, developing a computer package for use by the researcher was inevitable. The CAP was written in “Macromedia Dreamweaver 8” as the overall platform. Macromedia Flash utilizes the script symbolic instructional code (language) and animation that accommodates the interactive instructional process. Other computer programme and applications that were also utilized during the development process were Microsoft Word and Macromedia Fireworks 8. Macromedia Flash 8 was used for texts and graphics, Macromedia Fireworks also used for specific texts, graphics, and for buttons while Macromedia Flash was used for the Animation. The package consists of Introduction to the Package, General Preamble on Solid Geometry, Students’ Registration, List of module as in 1,2,3,4,5 & 6 and Click to Continue (Next Button) & Click to go back (Previous Button). Each Module starts with objectives of the lesson. The interactivity features of CAP allowed students to navigate from one link to another. There are Home, Next, Back, click Animation, and Exit buttons in the contents and quiz pages.
European Journal of Science and Mathematics Education Vol. 2, No. 2, 2014
Fig. 1: General Introduction to Geometry
Fig. 2: List of Module The production of the package was effected through a team of professionals and specialists including the programmer, computer operator, and the instructional designers (the researchers). ADDIE instructional development model was adapted in developing the package. This involves Analysis, Design, Development, Implementation and Evaluation stages of CAP.
Fig. 3: ADDIE Model
131
132
European Journal of Science and Mathematics Education Vol. 2, No. 2, 2014
In the analysis stage, the instructional problem is clarified, the instructional goals and objectives are defined; the learning environment is identified; and a clear understanding of the “gaps” between the desired outcomes or behaviours and the learner’s existing knowledge and skills is identified. At Design stage, the instructional designer deals with the selection of an instructional approach, learning objectives, assessment instruments, exercises, content, subject matter analysis, lesson planning and media selection. The design stage is systematic and specific. The development stage is where the Instructional Designers create and assemble the content assets (materials, resources, technologies, tests, etc.) that were created in the design stage. At this stage, CAP was developed and integrated. It was reviewed and revised according to the feedback given. Evaluation stage was conducted in two stages, formative was carried out in each stage of the ADDIE process, while, the summative evaluation determines the adequacy of the distributed materials in achieving the course objectives and provides opportunities for feedback from the users. The CAP was validated by computer programmers and educational technology experts; subject content (mathematics) specialists; and finally field tested on sample representative similar to the students used for the final study. The corrected version of CAP with the geometry content was installed in the school computers. The computer presents information and displays animation to the learner on each of the units after which the students assessed themselves with objective questions at the end of each unit. The students could only proceed to the next unit, if they satisfactorily answered the questions. When a student fails a question, the computer package will give a remedial lesson on that particular concept or question until the student is able to master the concept, then he/she moves to the next unit. CAP displays each student scores and monitors his/her progress.
Fig. 4: Cube with Animation Display
Fig. 5: Cube with worked example and Animation Display
European Journal of Science and Mathematics Education Vol. 2, No. 2, 2014
Fig. 6: Quiz Section The GIM was designed to provide visual information covering the same topics and content in CAP specifically for junior secondary class II curriculum. The GIM was constructed using plywood to carve out the shapes of various geometrical objects. It was a three dimensional objects. The lesson was structured in such a way that students were allowed to touch and feel the objects. The instructional contents were taught followed by questions and answers related to instructional content. The GIM was validated by experts from educational technology and mathematics to determine the appropriateness of the materials. Their suggestions were used to improve the models. Geometrical Achievement Test (GAT) was used in collecting data for this study. It consists of 40 multiple choice objective items with four options adopted from past examination of West African Examination Council (WAEC, May/June, 1988‐2011) and National Examination Council (NECO, June/July, 2000‐2011). The GAT was based on the contents of the CAP and GIM. Students were required to indicate their correct answers by ticking one of the letters (A ‐ D) that corresponds to the correct option in each item. GAT was administered to the experimental and control groups as pre‐test, posttest and again for the delayed posttest (retention test) after it had been reshuffled. On the scoring of the multiple‐choice items, ‘1’ mark was awarded for each correct answer and ‘0’ for each wrong answer. The scores were converted to percentage. The test items were validated by experts in mathematics education and tested for reliability using 20 randomly selected JSII students outside the study area but within the population. The test was administered once on the pilot samples. A reliability test using the Kudar‐Richardson (KR‐20) revealed a reliability coefficient of 0.82 which was considered adequate for the research study. Results Geometry Achievement Test (GAT) was used as a pre‐test for determining the academic levels of both experimental and control groups. Pre‐test data for the groups were analyzed using One‐way Analysis of Variance. The results of the analysis are presented in Table 1. Table 1: ANOVA results of experimental and control groups Sources of Sum of df Mean Square F‐value p‐value Variation Square Between groups Within Group Total
11.433 381.150 392.583
ns = not significant P>0.05
2 57 59
5.717 6.687
0.855ns
0.431
133
134
European Journal of Science and Mathematics Education Vol. 2, No. 2, 2014
Table 1 shows one‐way ANOVA results of students taught geometry using geometry instructional model, computer animation package and traditional teaching method. From table 1, the results revealed that there was no significant difference in the mean achievement scores of students in the three groups (Fcal = 0.855; df = 59, p = 0.431). This indicates the three groups are academically equivalent before the experiment started. Hypothesis One: There is no significant difference in the achievement scores of students exposed to geometry with CAP, GIM and TTM. To test this hypothesis, one‐way ANOVA was employed as shown in Table 2A. Table 2A: ANOVA results of experimental groups and control group Sources of Sum of df Mean F‐Calculated p‐Value Variation Square Square 1674.467 2 3348.933 Between groups 26.154 64.022* 0.000 57 1490.800 Within Group 59 4839.733 Total *Significant at P0.05 Table 3 revealed that the mean achievement scores for male and female students taught geometry with CAP (Group I) are 73.20 and 71.80 respectively. The mean achievement scores for male did not differ significantly from that of the female counterparts when both groups were exposed to geometry using computer simulation package (tcal = 1.216, df = 18, p = 0.240). On this basis, hypothesis 2 is not rejected. Therefore, there was no significant difference between the mean achievement scores of male and female students taught geometry with CAP. Hypothesis Three: There is no significant difference in the mean achievement scores of male and female students taught geometry with GIM. To test this hypothesis, t‐test statistic was employed. The result is presented in table 4. Table 4: t‐test results on gender (GIM) Variable
Number of df sample
10 Male 10 Female ns = not significant P>0.05
18
Mean (x)
SD
t‐value
P‐value
64.60 62.60
6.240 6.204
0.719ns
0.482
Table 4 shows t‐test results of male and female students taught with geometric instructional model (GIM). The mean achievement scores for male and female students are 64.60 and 62.60 respectively. The mean achievement scores for male did not differ significantly from the female (tcal = 0.719, df = 18, p = 0.482). On this basis, hypothesis three was not rejected. Therefore, there is no significant difference between the mean achievement scores of male and female students taught geometry with GIM. Hypothesis Four: There is no significant difference in the mean retention scores of geometry students taught with CAP, GIM and TTM. Table 5: ANOVA results on CAP, GIM and TTM Sources of Sum of Square df Mean F‐value P‐value Variation Square Between groups Within Group Total *Significant at P