study, Sander [17] investigated more deeply the effect of the base-line loading. ..... [17] M. Sander and H.A. Richard, âFatigue crack growth under variable ...
EFFECTS OF VARIABLE AMPLITUDE LOADING ON FATIGUE LIFE N. Laseure1, I. Schepens1, N. Micone1 and W. De Waele1 1
Ghent University, Labo Soete, Belgium
Abstract: This paper is a review of published research on variable amplitude loading of steels. The use of service spectra for different industrial sectors and specifically for offshore applications is first considered. Constant amplitude fatigue failure models are not representative for these applications. The JONSWAP spectrum shows potential to be used as service spectrum for offshore structures. Further investigation of variable amplitude fatigue is needed to get insight in the various phenomena linked to the variable amplitude. Observed trends in fatigue crack growth rate in variable amplitude fatigue tests on steels, such as the effects of overloads and underloads (occurring as single events, sequential events or block loadings), are discussed. Furthermore, suggestions of the underlying physical phenomena behind the load interaction effects due to variable amplitude loading are presented. It can be concluded that the plasticity induced crack closure mechanism is the most profound explanation for the acceleration effect in overloads and the retardation effect observed in underloads. Keywords: Variable Amplitude; Overload; Underload; Offshore; Fatigue; Steel LIST OF SYMBOLS a
crack size
KOL
overload stress intensity factor
aD
delay distance
∆Kth
threshold cyclic stress intensity factor
∆aOL
the OL-affected crack growth increment
N
number of cycles
BL
Base Load
ND
number of delay cycles
CA
Constant Amplitude
OL
Over Load
da/dN Fatigue Crack Growth Rate
OLR
Over Load Ratio
FCGR Fatigue Crack Growth Rate
PICC
Plasticity-Induced Crack Closure
K
Stress Intensity Factor
R
stress ratio Kmin/Kmax
∆K
cyclic stress intensity factor
RBL
baseline stress ratio
∆KBL
baseline cyclic stress intensity factor
Rblock
block stress ratio
∆KIC
critical cyclic stress intensity factor
SIF
Stress Intensity Factor
Kmax,BL baseline maximum stress intensity factor
UL
Under Load
Kmin
ULR
Under Load Ratio
VA
Variable Amplitude
minimum stress intensity factor
Kmin,BL baseline minimum stress intensity factor 1
INTRODUCTION
Fatigue has been widely recognised by engineers as an important element in mechanical design. Due to the high unpredictability and stochastic nature of fatigue failure, the fatigue and fracture engineering disciplines have been investigated for several years but they are still developing and of high interest. Offshore structures are subjected to a dynamic spectrum of loads due to waves, currents and wind. Therefore they are subjected to variable loading histories. Although ships, offshore structures and a lot more engineering structures are subjected to variable loading, the majority of fatigue failure data are obtained from experiments with constant amplitude loading. The linear damage approach (Miner’s rule) is included in design codes and is widely used because of its simplicity. However, the sequence and interaction of events (loading blocks with different amplitudes) may have major influence on the rate of damage accumulation. Ideally, it should be possible to predict variable amplitude crack growth with experimental data from constant amplitude testing. This idea has been addressed by several researchers but a unified crack growth prediction method at variable amplitude is still lacking.
The aim of this paper is to review the research that has been done on variable amplitude loading and to describe the effects of variable amplitude loading on crack propagation. The focus in this paper lies on steel specimens, since it is the main offshore building material in competition with composites. Also the fatigue loadings are narrowed down to the effects in the tensile-tensile region (load ratio R ≥ 0). The paper is organised as follows. In section 2, an overview of the different variable amplitude load types and their interaction effects are characterized. Section 3 handles spectrum loads and how they can be determined for offshore applications. Furthermore, the effects of all types of simple loadings are described in section 4. These simple loadings are single and periodic overloads, single and periodic underloads and combinations of these load types. Block loadings are considered in the last section. Here, a difference is made between low-high cycles, high-low cycles and low-high-low cycles. 2
CATEGORIES OF VARIABLE AMPLITUDE LOADING
In general, variable amplitude (VA) loading can be split up in three main categories: simple VA load histories, block load histories and random, service-simulating load histories. It is interesting to investigate the load interaction effects for these different categories. The term load interaction effect is used to describe the difference in behaviour of VA loading with respect to constant amplitude (CA) loading. In 1998 Skorupa [1,2] has made an extensive survey with respect to the prediction of crack growth under VA loading. What follows is an overview and update of Skorupa’s work with more recent findings and more specifications towards offshore applications. The various types of loadings which have been investigated over the years are summarised in Fig. 1.
Figure 1. Overview of VA loading histories. 3
RANDOM LOADING
In the next sections, the term spectrum is used as a generalisation for the power spectral density (PSD). The PSD describes how the power of a signal or time series is distributed over the different frequencies. The power is defined as the squared value of the signal. The integral of the PSD over a given frequency band computes the average power in the signal over that frequency band. In order to describe a function uniquely in the frequency domain, the amplitude and the phase versus the frequency are needed. By using only the PSD, the information of the phase is lost. A given time history has a unique power spectral density. On the other hand, a given power spectral density does not have a unique time history. The reason is that the phase angles are discarded in the power spectral density calculation. However in fatigue analysis, the phase of the signal is not of importance. Therefore, the PSD is a good and compact way to describe a certain characteristic load signal. 3.1 Service spectra in different sectors A lot of research is performed towards what simplifications might be done to complex measured spectrums, without affecting the experimentally predicted fatigue life. Several standardised spectra have been
developed or proposed for different industrial sectors. Several tests have been performed for metal components under standard flight-simulating load histories. Schijve [3-5] has done extensive research to the effect of a change in a flight-simulation load spectrum on the fatigue crack growth rate (FCGR). In these studies, the gust dominated spectrum TWIST and the manoeuvre-dominated spectrum FALSTAFF have been investigated. The conclusion is that the effect is strongly related to the spectrum used and often depends on the design load, material characteristics and geometry of the specimen. Another important conclusion is the fact that large compressive cycles can be a decisive factor in shortening the fatigue life. Additionally it has been found that the sequence of loads in a spectrum has only a small effect on the FCGR. Another standardised load spectrum called CARLOS describes the loadtime history for several automotive parts. FELIX is a standard used for the load spectrum of helicopter blades. FELIX/28 serves the same purpose, but the spectrum has been reduced for a more beneficial testing time. WISPER has been designed to describe the load spectrum of wind turbine blades. A summary of standardised spectra for multiple purposes can be found in [6]. Load spectra are often counted by different methods, such as the level crossing counting method or the rainflow method [7,8] to evaluate linear damage accumulation or to execute data reduction. 3.2 Offshore related spectra Estimates of sea conditions are required by engineers during the design stage of offshore structures. Most commonly these conditions are described by the significant wave height and the wave period, such as the zero-up-crossing period. Values obtained from wave measurements, visual estimations or knowledge of the wind fields, can be used to define values for these parameters [9]. One spectrum, recommended by the International Ship and Offshore Structures Congress (ISSC) in 1976 for open ocean conditions is the Bretschneider spectrum. Another spectrum, used for a fully-developed sea is the Pierson-Moskowitz spectrum. In 1973 a cooperative venture by a group of scientists from England, The Netherlands, The United States and Germany called the Joint North Sea Wave Project (JONSWAP), has obtained wave spectral data of sufficient extent and density to determine the structure of the source function empirically [10]. The JONSWAP spectrum has been obtained by multiplying the Bretschneider formula by a peak enhancement function and it has been suggested by ISSC (1976) for use in conditions of limited fetch [9]. All these spectra are single peaked. In practice, wave spectra rarely have two or more peaks. In a study of Houmb and Due, it was found that only about 4% of spectra from measurements in the sea north of Norway were multi-peaked [9]. A method of modelling double-peaked spectra is given by Ochi and Hubble [11]. More recent studies use the JONSWAP to create more accurate spectra. In [12] a multivariate statistical technique is presented for the description of the spectral wave climate using the North Sea data as a methodological example. A simplified version of the double peak spectral model has been described in [13]. Det Norske Veritas (DNV) has played an important role over the years in determining standards for sea and offshore applications. In their recommended practice DNV-RP-C205 [14] models for wind load spectra and wave and current induced load spectra are given. They include most of the above mentioned models. The Centre for Mathematical Sciences at Lund University in Sweden has developed a toolbox of MATLAB routines for statistical analysis and simulation of random waves and random loads [15]. Model spectra such as JONSWAP, Torsethaugen, Bretschneider and Pierson-Moskowitz are included in the software as methods for fatigue life prediction for random loads. Fig. 2 [15] has been created using this toolbox. In (a) the JONSWAP spectrum for a significant wave height Hm0 of 7m and a peak period Tp of 11s is represented. In (b), the time signal corresponding to the spectrum is generated. In (c), a visualisation of the sea state corresponding to the spectrum is represented.
Figure 2. JONSWAP representation with a significant wave height Hm0 of 7m and a peak period Tp of 11s, [15]. S(ω) is the wave density spectrum (Power Spectral Density) in [m²/(rad/s)].
3.3
Discussion
Regarding practical validity of the experimental tests, spectrum loads are the most relevant as they represent the actual offshore loads and for this reason they are described in the offshore standards. However, implementing spectra in fatigue tests is difficult. Besides this problem, it is also not straightforward to calculate the local stresses from these spectra. Fatigue tests using spectrum loads do not allow to evaluate the influence of the load interaction effects, so tests using simple loadings and block loadings are as well required. 4
SIMPLE LOADING
Elber [16] was one of the first to investigate the effect of an overload on crack propagation. He found out there was a significant effect on the crack growth rate when applying an overload. Later on, his work was continued by various scientists and several conclusions have been made about whether the crack growth will accelerate, retard or continue to grow at the rate predicted by CA loading. This will be further elaborated in the next paragraphs. The different parameters used to define a simple loading scheme can be seen in Fig. 3 [17]. The following formulas are based on these parameters and are also useful for describing loadings: ∆KBL = Kmax,BL − Kmin,BL R = Kmin,BL/Kmax,BL OLR = (KOL − Kmin,BL) / ∆KBL ULR = (Kmax,BL − KUL) / ∆KBL
Figure 3. Load parameters for a simple loading scheme, [17]. 4.1
Overload events
Single OL A single overload causes a retardation of crack growth as a load interaction effect. The retardation effect is characterised by the following parameters: the number of delay cycles ND, the delay distance aD and the OL-affected crack growth increment ∆aOL as can be seen in Fig. 4 [1]. Remark that there are 2 different definitions of the number of delay cycles ND. In Fig. 4 [1] they are denoted by ND1 and ND2. ND1 is also called the real number of delay cycles.
Figure 4. Schematic of delayed retardation of crack growth following a single OL in a K-controlled test, [1]. The main parameter influencing the FCGR (or da/dN) is the Over Load Ratio (OLR). Increasing the OLR value will result in an increase of ND, aD and ∆aOL, and in a lower minimum da/dN level as reported in [1,1729]. A second parameter influencing the FCGR is the R-ratio. When the R-ratio is increased, the retardation effect will diminish [1,17-25]. The influence of the ∆KBL level was found inconsistent [1]. However in a later study, Sander [17] investigated more deeply the effect of the base-line loading. He discovered that with an increasing baseline-level loading the retardation effect decreased.
Figure 5. Influence of single overloads (OL) on the crack growth rate depending on the baseline level loading with (a) R = 0.1 and (b) R = 0.5 as well as (c) isolines for R = 0.1, [17]. The effect of most of the different parameters for a single OL event is summarised on the diagram represented in Fig. 5 [17]. First of all, the limit of the FCGR is represented by the threshold value ∆Kth. When the baseline-level loading drops below ∆Kth, no crack growth is observed. An unstable crack growth occurs when the OL exceeds the fracture toughness ∆KIC leading to overload failure. Depending on the Rratio and the OLR, either crack arrest (crack stops growing) or retarded crack growth (crack growth rate is lower than predicted for the CA case) is observed. The curve which separates these two regions is strongly
influenced by R-ratio. Below this limit, isolines can be drawn to show different combinations of KBL and OLR which lead to the same number of real delay cycles ND. In general it can be stated that the retardation effect due to an overload is a beneficial effect regarding the lifetime of structures. This has also been proven by more recent studies [17,19, 21-25]. The retardation effect occurs in three stages as can be seen in Fig. 4 [1]. First, there is a small acceleration in fatigue crack growth rate. This acceleration is however swiftly followed by the main effect, the retardation. After the minimum crack growth rate has been obtained, thus the maximum retardation, the crack growth rate starts to accelerate again and becomes equal to the rate which would have been obtained if no overload would have been present. Crack tip blunting is one of the phenomena to explain the retardation [2]. Due to an overload, the crack tip is blunted, creating a new initiation site. Before the crack can propagate further at a normal ratio, it has to be reinitiated which causes retardation. According to [2], an OL induces compressive residual stresses ahead of the crack tip. By superimposing these stresses on the applied stresses, the local stress ratio reduces. Thus the compressive residual stresses induced by an OL can also be seen as a reason for FCGR retardation due to an OL. Elber [16] identified the phenomenon of plasticity-induced crack closure (PICC) and was able to fully explain all stages of retardation. Due to the OL, large tensile deformations are induced in the material ahead of the crack tip. This zone affected by the OL, is called the OL plastic zone. An increase in residual wake of plastic deformation is left on the crack flanks when the crack advances through this zone. This increase causes the crack to stop at high tensile loads. The PICC models predict delayed retardation. If the OL caused direct crack branching, immediate retardation is to be expected. However when the crack after the OL first starts to grow in a normal way and branches afterwards, delayed retardation occurs. This study was later confirmed by [24]. Jones [30] made a suggestion that the high plastic strains induced by the OL harden the region ahead of the crack tip and cause the retardation. In general, the PICC phenomenon has been most prominent to account for crack retardation in a single OL. It has been confirmed by several researchers [31-34] and numerical analysis [18,35]. Also the effect of the OLR and the R-ratio are in accordance with the PICC arguments [18]. Table 1. Overview of crack propagation mechanisms.
Sequence of OLs The difference between a sequence of OLs and block loading is the amount of OLs. In a sequence, only a few OLs are present, whereas in a block loading the amount of OLs is so large they are in a regime state and thus called a high cycle. The retardation effect is more pronounced for a sequence of OLs than for a single overload [1, 20, 34]. Just as with a single OL, the retardation becomes more severe when increasing the OLR value [1]. An increase in the amount of OLs within the sequence will increase the retardation effect. However, the ∆aOL remains the same as for a single OL [1, 26]. The higher the R-ratio, the less the retardation [1, 17] which is also observed for a single OL. The PICC mechanism has been consistent with the relations found between a sequence of OLs and the retardation effects [2, 26, 33, 34]. Periodic sequence of OLs A periodic sequence of OLs can result in either a retardation or either an acceleration. The result depends on the combination of the amount of overloads and number of base load cycles. With frequently applying periodic single OLs, an accelerated FCGR has been observed for structural steels [1]. This is in contrast to the observations for a single OL and a sequence of OLs. There are also several studies where the observations are in line with the ones of single OL and sequence of OLs [1, 36]. Here the main parameter controlling the retardation is the number of base cycles between the OLs. A longer interval between OLs results in a more extreme retardation [1, 34, 36] and sometimes discontinuities can be observed in the curve illustrating crack growth versus number of fatigue cycles [1, 37]. 4.2
Underload events
Single UL When applying a single UL, several authors agree an acceleration in the FCGR takes place [1, 23, 24, 28, 38] but the rate at which the acceleration occurs is highly scattered [1].
The residual stress concept has been used to prove the acceleration effect upon a single UL [2, 24, 31-34] as the UL induces tensile residual stresses ahead of the crack tip. Also the PICC mechanism is able to prove the acceleration. An UL reduces the height of plastically deformed material in the area behind the crack by compressive yielding [2]. Sequence of UL According to [38], a loading change from a sequence of ULs to a BL block causes a retardation transient. Periodic Sequence UL It has been observed by [1, 23, 39] that the FCGR under periodic ULs goes significantly faster than the results obtained from a CA test. Yet for single periodic ULs there is some disagreement whether or not the acceleration factor reaches a maximum or not when plotted in function of NBL [36]. The acceleration factor is defined as the ratio of the measured crack growth rate per sequence onto the predicted growth rate per sequence by a linear summation of the constant amplitude crack growth response, or in symbols: 𝑑𝑎 𝑑𝑁 acceleration factor = 𝑑𝑎 𝑑𝑁
!" !"
The FCGR response to single periodic ULs depends on the material and is strongly affected by the R-ratio [1, 40]. The ULR value however has no effect at all [1]. Whilst mostly the acceleration effect of the FCGR has been noted for periodic UL sequences, some researchers found some interaction effects [39, 41] and even retardation induced by the UL [1]. 4.3
Combined overload/underload events
OL-UL or UL-OL There is in both cases (OL followed by UL and UL followed by OL) a retardation effect. When an UL is applied immediately after an OL, it reduces the post-OL retardation more significantly than when an UL immediately precedes an OL. The retardation effect increases with increasing length of the OL sequence. Yet it has a smaller retardation effect than a pure OL sequence. The difference in effect of the UL compared to an OL-UL and OL-UL block is very small [1, 24]. In more recent studies [42], it has also been concluded that the retardation effect of an OL is very sensitive to the subsequent UL. When the UL becomes bigger, the number of delay cycles ND decrease. The crack length affected by the delay is not dependent on the magnitude of the UL. The minimum crack length associated to the minimum FCGR varies with the UL. When the UL becomes bigger, the minimum FCGR occurs later [42]. In [24] it has been concluded that the influence of an UL can make the retardation effect due to an OL go away. Periodic OL-UL or Periodic UL-OL A periodic behaviour of an OL immediately followed by an UL or vice versa will most likely cause a retardation in crack growth rate. There exists a maximum in retardation for a certain period of applied BLs and the effect of change in FCGR eventually disappears when the period becomes very large [24]. 5
BLOCK LOADING
In general, block loadings can be categorised in low-high, high-low or combinations of these sequences. In [17], the following three types of low-high-low sequences were tested, as illustrated in Fig. 6 [17]: 1. Kmin = constant: the minimum stress intensity factor (SIF) was kept constant, i.e. the R-ratio during the block loading was defined by R = RBL/Rblock. 2. R = constant: the R-ratio was kept constant, i.e. R = RBL. 3. ∆K = constant: the cyclic SIF was kept constant, i.e. R = (Rblock + RBL − 1)/Rblock. Where: RBL = KBL,min/KBL,max Rblock = Kblock/KBL,max
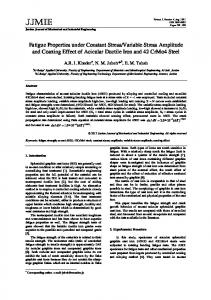
Figure 6. Definition of the characteristic parameters of a low-high low block loading, [17]. In Fig. 7 [17] the lifetime normalized to the CA fatigue life is illustrated depending on the block loading ratio and the block loading category. The CA reference fatigue loading corresponds to the base loading. The lifetime due to high-low block loading increases exponentially with increasing block loading ratio [17].
Figure 7. Ratio of total lifetime (ND + NBlock) to the number of CA cycles NCA depending on block loading ratio and block categories. ND represents the number of delay cycles, [17]. In [43], high-low and low-high blocks were tested with constant ∆K. The effect of a high-low block has the same trend as a single OL (see Fig. 1). However, for a high-low load block, the retardation always occurs immediate and is not preceded by the acceleration phase [18, 26]. The effect of crack retardation is much higher for the high-low block than for an equivalent single tensile overload [19, 34, 43]. The low-high block results in an acceleration of FCGR. This behaviour is identical to that generally observed following an UL [1]. Other literature have reported the same trends [20, 34]. Also the effect of the R-ratio has been investigated by Borrego [43]. A significant reduction in delay cycles when R is increased has been observed. This is a similar behaviour as in single OL [18,19,22]. 6
CONCLUSION
There has been done a lot of research to describe load spectra of different applications. In the case of offshore, the wave spectrum JONSWAP is most commonly used. Notwithstanding numerous research efforts, the effects of VA loads are still not fully understood. Most research has been done on the effect of a single OL. It can be concluded that an OL and all of its variations have a retardation of the crack growth as a consequence. The plasticity induced crack closure (PICC) mechanism has been proven useful to explain this effect. ULs however have an acceleration of crack growth as a consequence. When an OL and an UL are applied after each other, retardation is most likely to occur, but the UL has a strong influence on the amount of retardation. For block loading, the effect highly depends on the parameters defining the shape of the block.
7
REFERENCES [1] M. Skorupa, “Load interaction effects during fatigue crack growth under variable amplitude loading a literature review. Part I: empirical trends,” Fatigue & Fracture of Engineering Materials & Structures, vol. 21, no. 8, pp. 987–1006, 1998. [2] M. Skorupa, “Load interaction effects during fatigue crack growth under variable amplitude loading a literature review. Part II: qualitative interpretation,” Fatigue & Fracture of Engineering Materials & Structures, vol. 22, no. 10, pp. 905–926, 1999. [3] J. Schijve, “The significance of flight simulation fatigue tests.,” Durability and Damage Tolerance in Aircraft Design, Proc. 13th ICAF Symp., Pisa (Edited by A. Salvetti and G. Cavallini), EMAS, Warley, pp. 71 – 170, 1985. [4] J. Schijve, “Effect of load sequences on crack propagation under random and program loading.,” Engng Fracture Mech., vol. 5, pp. 269 – 280., 1973. [5] J. Siegl and J. J. Schijve, “Fractographic observations on fatigue crack growth under minitwist flight simulation-loading.,” LR-631, Delft University of Technology, The Netherlands., 1990. [6] P. Heuler, T. Bruder, and H. Klätschke, “Standardised load-time histories – a contribution to durability issues under spectrum loading.” Mat.-wiss. u. Werkstofftech., vol. 36, no. 11, 2005. [7] J.P. Amzallag, C. Gerey, J.L. Robert, and J. Bahuaud, “Standardization of the rainflow counting method for fatigue analysis,” Fatigue, vol. 16, pp. 287 – 293, 1994. [8] A. K. Khosrovaneh, “Fatigue loading history reconstruction based on the rainflow technique.,” International Journal of Fatigue, vol. 12, pp. 99 – 106, 1990. [9] D.J.T. Carter, “Estimation of wave spectra from wave height and period,” Institution of oceanographic sciences, I.O.S. Report No. 135, 1982. [10] K. Hasselmann, T.P. Barnett, H. Bouws, E.and Carlson, D.E. Cartwright, K. Enke, J.A. Ewing, H. Gienapp, D.E. Hasselmann, P. Kruseman, A. Meerburg, P. Muller, D.J. Olbers, K. Richter, W. Sell, and H. Walden, “Measurements of wind-wave growth and swell decay during the Joint North Sea Wave Project (JONSWAP),” Ergnzungsheft zur Deutschen Hydro- graphischen Zeitschrift Reihe, 1973. [11] M.K. Ochi and E.N. Hubble, “Six-parameter wave spectra,” Proc. 15th Coastal Engineering Conference, pp. 301–328, 1976. [12] A.V. Boukhanovsky, L.J. Lopatoukhin, and C. Guedes Soares, “Spectra wave climate of the north sea,” Applied Ocean Res., vol. 29, pp. 146 – 154, 2007. [13] K. Torsethaugen and S. Haver, “Simplified double peak spectral model for ocean waves.,” Proc. 14th International Offshore and Polar Engineering Conference, Toulon, France, 2004. [14] DNV-RP-C205, “Environmental conditions and environmental loads,” Det Norske Veritas, 2010. [15] WAFO-group, WAFO - A Matlab Toolbox for Analysis of Random Waves and Loads - A Tutorial, Math. Stat., Center for Math. Sci., Lund Univ., Lund, Sweden, 2000. [16] W. Elber, “Fatigue crack closure under cyclic tension,” Engineering Fracture Mechanics, vol. 2, pp. 37–45, 1970. [17] M. Sander and H.A. Richard, “Fatigue crack growth under variable amplitude loading. part I: Experimental investigations.,” Institute of Applied Mechanics (FAM), University of Paderborn, Pohlweg 47-49, D-33098 Paderborn, Germany, 2005. [18] C. S. Shin and S. H. Hsu, “On the mechanisms and behaviour of overload retardation in AISI 304 stainless steel.,” Int. J. Fatigue, vol. 15, pp. 181– 192, 1993. [19] L.P. Borrego, J.M. Ferreira, and J.M. Costa, “Evaluation of overload effects on fatigue crack growth and closure.,” Eng Fract Mech, vol. 70, pp. 1379– 1397, 2003. [20] C. M. Ward-Close, A. F. Blom, and R.O. Ritchie, “Mechanisms associated with transient fatigue crack growth under variable-amplitude loading: An experimental and numerical study.,” Engng Fracture Mech. 32, pp. 613– 638, 1989. [21] L.P. Borrego, J.M. Ferreira, and J.M. Costa, “Fatigue crack growth and crack closure in an AlMgSi alloy.,” Fatigue Fract Eng Mater Struct, vol. 24, pp. 255 – 266, 2001.
[22] X.P. Huang, J.B Zhang, W.C. Cui, and J.X. Leng, “Fatigue crack growth with overload under spectrum loading.,” Theor Appl Mech, vol. 44, pp. 105 – 115, 2005. [23] V. Tvergaard, “Effect of underloads or overloads in fatigue crack growth by crack tip blunting.,” Eng Fract Mech, vol. 73, pp. 869 – 879, 2006. [24] F. Romeiro and M. de Freitas, “The effect of overloads and underloads on fatigue crack growth,” Anales de Mecanica de la fractura, vol. 18, pp. 79 – 85, 2001. [25] R. Seifi, M. Eshraghi, “Effects of mixed-mode overloading on the mixed-mode I+II fatigue crack growth.”, Arch. Appl. Mech., Vol. 83, pp. 987–1000, 2013. [26] G. L. Chen and R. Roberts, “Delay effects in AISI 1035 steel.,” Engng Fracture Mech., vol. 22, pp. 201–212, 1985. [27] R.L. Carlson, G.A. Kardomateas and P.R. Bates, “The effects of overloads in fatigue crack growth.” International Journal of Fatigue, Vol. 13, No. 6, pp. 453 – 460, 1991. [28] K. Sadananda, A.K. Vasudevan, R.L. Holtz and E.U. Lee, “Analysis of overload effects and related phenomena.”, International Journal of Fatigue, Vol. 21, pp. 233 – 246, 1999 [29] B. B. Verma and R. K. Pandey, “The effects of loading variables on overload induced fatigue crack growth retardation parameters.” Journal of material science, Vol. 34, pp. 4867– 4871, 1999 [30] R. E. Jones, “Fatigue crack growth retardation after single cycle peak overload in Ti6Al4v titanium alloy.,” Engng Fracture Mech., vol. 5, pp. 585 – 604, 1973. [31] M. A. Meggiolaro and J. T. Pinho de Castro, “On the dominant role of crack closure on fatigue crack growth modeling”, International Journal of Fatigue, Vol. 25, pp 843 – 854, 2003. [32] P. Dai, S. Li and Z. Li, “The effects of overload on the fatigue crack growth in ductile materials predicted by plasticity-corrected stress intensity factor.”, Engineering fracture mechanics, Vol. 11, pp. 26 – 37, 2013 [33] T. Manson, H. Öberg and F. Nilsson, “Closure effects on fatigue crack growth rates at constant and variable amplitude loading.”, Engineering fracture mechanics, Vol. 71, pp. 1273 – 1288, 2004. [34] M. Skorupa, J. Schijve, A. Skorupa and T. Machniewicz, “Fatigue crack growth in a structural steel under single and multiple periodic overload cycles”, Fatigue Fract Engng Mater Struct, Vol. 22, pp. 879 – 887, 1999. [35] X. Zhang, A. S. L. Chan, and G. A. O. Davies, “Numerical simulation of fatigue crack growth under complex loading sequences.,” Engng Fracture Mech., vol. 42, pp. 305 – 321, 1992. [36] N. A. Fleck, “Fatigue crack growth due to periodic underloads and overloads.,” Acta Metall., vol. 33, pp. 1339 – 1354, 1985. [37] M. Skorupa and A. Skorupa, “Experimental results and predictions on fatigue crack growth in structural steel”, International Journal of Fatigue, vol. 27, pp. 1016 – 1028, 2005. [38] F.S. Silva, “Fatigue crack propagation after overloading and underloading at negative stress ratios”, International Journal of Fatigue, vol. 29, pp. 1757 – 1771, 2007. [39] R. L. Carlson and G. A. Kardomateas, “Effects of compressive load excursions on fatigue crack growth.,” Fatigue, vol. 16, pp. 141 – 146, 1994. [40] T.H. Topper and M.T.Yu, “The effect of overloads on threshold and crack closure.,” Int. J. Fatigue, vol. 3, pp. 159 – 164, 1985. [41] R. Yang, “Prediction of crack growth under complex loading cycles.,”Int. J. Fatigue, vol. 16, pp. 397 – 402, 1994. [42] A. Bacila, X. Decoopman, G. Mesmacque, M. Voda, and V.A. Serban, “Study of underload effects on the delay induced by an overload in fatigue crack propagation,” International Journal of Fatigue, vol. 29, pp. 1781 – 1787, 2007. [43] L.P. Borrego, J.M. Ferreira, and J.M. Costa, “Partial crack closure under block loading.,” International Journal of Fatigue, vol. 30, pp. 1787 – 1796, 2008.