Hindawi Publishing Corporation Mathematical Problems in Engineering Volume 2013, Article ID 173736, 8 pages http://dx.doi.org/10.1155/2013/173736
Research Article Efficiency Optimization for Disassembly Tools via Using NN-GA Approach Guangdong Tian,1 Tianggang Qiang,1 Jiangwei Chu,1 Guan Xu,2 and Wei Zhou3 1
Transportation College, Northeast Forestry University, Harbin 150040, China Transportation College, Jilin University, Changchun 130020, China 3 Business College, Shandong University of Technology, Zibo 250012, China 2
Correspondence should be addressed to Tianggang Qiang;
[email protected] Received 16 September 2013; Accepted 29 October 2013 Academic Editor: Shuping He Copyright © 2013 Guangdong Tian et al. This is an open access article distributed under the Creative Commons Attribution License, which permits unrestricted use, distribution, and reproduction in any medium, provided the original work is properly cited. Disassembly issues have been widely attracted in today’s sustainable development context. One of them is the selection of disassembly tools and their efficiency comparison. To deal with such issue, taking the bolt as a removal object, this work designs their removal experiments for different removal tools considering some factors influencing its removal process. Moreover, based on the obtained experimental data, the removal efficiency for different removal tools is optimized by a hybrid algorithm integrating neural networks (NN) and genetic algorithm (GA). Their efficiency comparison is discussed. Some numerical examples are given to illustrate the proposed idea and the effectiveness of the proposed methods.
1. Introduction Rapidly growing mechanical and electrical waste has long been known to cause severe environmental problems. A major contributing factor of this is the rapid technological development of new products and an increasing demand for the latest technology by the consumers. The desire to obtain the latest technology often leads to premature purging of still functioning products. This, in turn, has led to a diminishing number of landfills and rapid depletion of virgin resources [1]. In order to the recycle them, it is necessary that the disassembly of end-of-life products should be implemented. Disassembly is defined by Brennan et al. [2] as “the process of systematic removal of desirable constituent parts from an assembly while ensuring that there is no impairment of the parts due to the process.” Disassembly is conductive and instructive to recycling of products. Only in this way can we achieve high purity of material recycling and realize good reuse of components [3]. For disassembly, one of the hot issues is the disassemblability evaluation and design. Gungor and Gupta present an evaluation and planning methodology to choose the best disassembly process among several alternative processes based on the total time for
disassembly [4]. Kroll et al. develop a method for quantifying the ease of disassembly. Its purpose is to advise designers to consider disassemblability for recycling from the beginning of design [5, 6]. Suga et al. propose a new method for the evaluation of disassemblability by introducing two parameters describing product disassemblability, namely, disassembly energy and entropy for disassembly [7]. Mok et al. present a disassemblability analysis method on the recycling of mechanical parts in automobiles. The disassemblability analysis method includes some important influence factors on product disassembly, for example, ease of fixing ease of finding joining points, disassembly forces, and disassembly directions [8]. Desai and Mital present a methodology to enhance the disassemblability of products. They define disassemblability in terms of several influence factors on disassembly, that is, exertion of manual force for disassembly, degree of precision required for effective removal tool placement, weight, size, material and shape of components being disassembled, and the use of hand tools. Time-based numeric indices are assigned to each design factor. A higher score indicates anomalies in product design from the disassembly perspective [9, 10]. They develop
2 a methodology to design products for disassembly incorporating ergonomic factors [11]. Das et al. estimate disassembly cost and effort by calculating a disassembly effort index comprising seven factors: time, tools, fixture, access, instruct, hazard, and force requirements [12]. In addition, considering the impact of uncertainty factors dealing with the product disassembly, some disassemblability analysis methods on uncertainty management problem are presented. For example, Ilgin and Gupta present a sensor-embedded product approach to detect missing components in disassembly uncertainty [13, 14]. Tian et al. define some disassembility evaluation parameters from the perspective of probability theory and establish some probability evaluation models on the disassembly process [15, 16]. Tang and Zhou consider the uncertainty feature of disassembly time and quality of disassembled subassemblies in a disassembly process, and analyze the expected disassembly cost and the expected net profit of product disassembly based on the generic model for a human-in-the-loop disassembly system [17, 18]. They present disassemblability analysis method considering human factors. Gao et al. realize the intelligent decision making of a disassembly process based on fuzzy reasoning Petri nets [19]. Tang et al. discuss the uncertainty management issue based on the learning approach [20, 21]. Based on the above overview, the current research mainly focuses on the integrated disassemblability evaluation and design method incorporating one or multiple disassembly influence factors. In fact, to some extent, a factor has a significant impact on the disassembly decision making and design guideline of DFD (design for disassembly). Motivated by these, factor analysis issues on disassembly are discussed. For example, Tang and Zhou discuss the influence of operation fluency of human operators on disassembly using fuzzy logic [18]. Shu and Flowers investigate the selection issue of product life cycle fastening and joining methods from the perspective of design [22]. G¨ung¨or probes the evaluation issue of connection types in design for disassembly using analytic network process (ANP) method [23]. Youssif et al. analyze ergonomic factors in disassembly planning. The aim of this study is to investigate the level of involvement of ergonomic aspects in the disassembly workplace with the effect of their absence on the human performance which, in turn, may reflect on the losses in the disassembly outcomes and modeling an optimum disassembly plan incorporating the ergonomic factors within the model [24]. Tseng et al. present the influence of modular design on disassembly economy [25]. Although some researchers have addressed some influence factors on disassembly, that is, the fluency of human operators, connection type, and ergonomic factor, they pay little attention to the tool type, which is one of the key factors of product disassembly. This work addresses disassembly efficiency optimization and their comparison for different disassembly tools using experiment and simulation methods. The rest of this paper is organized as follows. Section 2 designs the removal experiments for different removal tools. Section 3 introduces the optimization algorithm for removal efficiency. Section 4 presents the optimization and comparison of removal efficiency on different removal tools. Finally,
Mathematical Problems in Engineering Section 5 concludes this paper and describes future research issues.
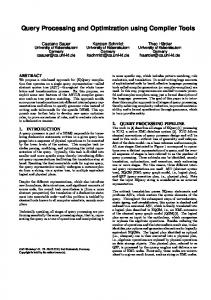
2. Removal Experiment By taking the specified bolt of a transmission as an objective, this work obtains its removal times of different removal tools as presented hereinafter. 2.1. Experimental Objective and Tools 2.1.1. Experimental Objective. In this work, the M17 bolt of a transmission is taken as an objective to be removed. Its basic parameters are presented as follows: the bolt type is hexagonal, the maximum nominal diameter is 12 mm, the number of pitches is 12, and the thread pitch is 1.82 mm. 2.1.2. Experimental Equipment for Removal. There are four types of equipment used in this experiment, that is, wrench for tightening, dynamometer for removing, stopwatch, and removal tools. Wrench for tightening is used to fasten the bolt and demarcate the tightening torque of the bolt. Dynamometer for removing is applied to measure the maximum tension of operators. Stopwatch is used to measure the removal operation time of the bolt. Removal tools are composed of two types of tools, which are used to remove the bolt. One is a ratchet wrench, as shown in Figure 1(a), and the other is a general wrench (round end), as shown in Figure 1(b). 2.2. Experiment Design and Data Acquisition 2.2.1. Experiment Design. In the removal experiment, we consider only two factors, that is, the removal condition of the bolt and the quality of removal operators. In terms of the removal condition of the bolt, it is simulated by the tightening torque of the bolt. It is demarcated by three levels, that is, 25 Nm, 50 Nm, and 75 Nm. Note that Nm is the unit of torque, that is, Newton metre. In terms of the quality of operators, during the removal experiment, since 5 skilled ones are selected, their operation fluency is considered as being high. Based on this premise, the quality of operators is determined by their maximum tension used. Usually, the larger of the maximum tension an operator, the better their ability of disassembly, and the smaller the needed disassembly time of disassembling a product. In this experiment, it is demarcated by five levels, respectively, that is, 28 kgf, 24 kgf, 20 kgf, 15 kgf, and 12 kgf. Note that the kgf (kilogram force) is the unit of tension (1 kgf = 9.8 N). 2.2.2. Data Acquisition. In this experiment, based on different tightening torque levels of the bolt and quality levels of removal operators, the corresponding 15 data points of removal standard time for two types of tools are obtained, as shown in Table 1. Note that, at a specified corresponding level, the same 6 bolts are removed each time and they are removed four times; that is, 24 data points of removal time of the bolt are obtained. Note that the standard time is mean value of 24 removal time data.
Mathematical Problems in Engineering
3
Round end
Open end
(a)
(b)
Figure 1: Removal tools. (a) Tool I: ratchet wrench; (b) tool II: general wrench (round end).
Table 1: Removal experimental data table. Exp. no. 1 2 3 4 5 6 7 8 9 10 11 12 13 14 15
Tightening Maximum tension Standard time (second) torque (Nm) (kgf/9.8 N) Tool I Tool II 25 50 75 25 50 75 25 50 75 25 50 75 25 50 75
28 28 28 24 24 24 20 20 20 15 15 15 12 12 12
18.07 18.12 22.34 18.06 18.56 22.38 18.25 18.94 23.17 18.21 18.80 23.65 19.05 20.17 24.63
29.56 30.49 34.37 30.77 31.02 35.73 29.18 30.86 37.04 33.41 34.71 39.92 34.05 34.87 40.39
3. Optimization Algorithm Although we obtain the experimental data, the smallest one is not optimal in certain conditions. To obtain the optimal one, thus it is essential to optimize them based on experimental data. NN-GA is a hybrid intelligent optimization algorithm integrating neural networks (NN) and genetic algorithm (GA). Since it makes full use of the nonlinear fitting ability of NN and the nonlinear fitting ability optimization ability of GA, it is proved to be effective and feasible to deal with nonlinear and discrete optimization issues, that is, nonlinear structural and creep feed grinding optimization problems [26–28]. It has not yet been used in the efficiency issue of the disassembly tool. Due to the fact that the efficiency of the disassembly tool is a discrete optimization one, this work proposes a hybrid algorithm integrating NN and GA to optimize the efficiency (time) of a disassembly process. The details of the hybrid algorithm integrating NN and GA are presented as follows.
3.1. Neural Networks (NN). A neural network is treated as a nonlinear mapping system consisting of neurons (processing units), which are linked by weighted connections. It usually consists of three layers: input, hidden, and output layers [26, 29]. There is an activation function in the hidden layer. It is defined as a sigmoid function in this work. Firstly, the method to determine the number of neurons of the input, hidden, and output layers is presented as follows. The number of input neurons of the NN structure is the number of input variables, namely, two influence factors; thus the number of input neurons is 2. The number of output neurons is one representing one removal time function. In terms of the NN structure, the main problem is to determine the best number of hidden neurons. The number of hidden neurons can be infinite in theory but finite in practice due to two reasons. Too many hidden neurons increase the training time and response time of the trained NN. On the other hand, too few hidden neurons make the NN lack generalization ability [27, 28, 30, 31]. Therefore, it can usually be determined by the following formula, that is, 𝑠 = √𝑢 + V+𝑏, where 𝑢 and V are the number of input neurons and output neurons, respectively, and 𝑏 is a constant from 1 to 10 [28]. Based on it, the number of input neurons 𝑢 is set to be 2 since we need to consider two factors, V = 1; thus 𝑠 is a constant from 3 to 12, which is defined as 10 in this paper. Secondly, backpropagation is the most commonly used method to calculate values for the weight and bias terms of the neural network model. In the backpropagation method, all weights are adjusted according to the calculated error term using a gradient method. Learning in an NN, that is, the calculation of the weights of the connections, is achieved by minimizing the error between its output and the actual output over a number of available training data points. In this work, the error term is controlled by the following MATLAB function, namely, net.trainParam.goal. It denotes the mean squared error between the output of NN and the actual output over a number of available training data points. The NN algorithm is presented as follows. Step 1. Initialize the number of neurons of input, hidden, and output layers and initialize the weight vector 𝑤.
4
Mathematical Problems in Engineering
Step 2. Calculate the output of the hidden layer and the output of the output layer and adjust the corresponding weights 𝑤.
operation in position 𝑗 of the ℎth chromosome 𝑎ℎ and the 𝑙th chromosome 𝑎𝑙 is expressed as
Step 3. Calculate the error term, namely, training performance goal. If it is larger than the given error term value, go to Step 2; otherwise, end.
𝑎ℎ𝑗 = 𝑎ℎ𝑗 ⋅ (1 − 𝑧) + 𝑎𝑙𝑗 ⋅ 𝑧,
3.2. Genetic Algorithm (GA). Genetic algorithms (GA) form a class of adaptive heuristics based on principles derived from the dynamics of natural population genetics [28]. GA starts with a randomized population of parent chromosomes (numeric vectors) representing various possible solutions to a problem. The individual components (numeric values) within a chromosome are referred to as genes. New child chromosomes are generated by selection, crossover, and mutation operations. All chromosomes are then evaluated according to a fitness (or objective) function, with the fittest surviving into the next generation. Generally, when the given maximum generation is reached, the algorithm ends. The best chromosome is assigned to the optimal solution of the problem [30]. In this work, the main operation processes of GA are presented as follows. 3.2.1. Initialization Process. Produce randomly pop size initial population 𝐴 = {𝐴 1 , 𝐴 2 , . . . , 𝐴 pop size }, give a specified value range, and produce an individual randomly, namely, a chromosome. Note that 𝑎𝑖 is an influence factor of component removal in this work. 3.2.2. Determining the Fitness or Evaluation Function. Based on a chromosome obtained by the initialization process, weights and thresholds of the NN are assigned. If specified training data are input, forecast output of the trained NN can be obtained. The inversed function of the sum of absolute differences between forecast outputs of the trained NN and actual outputs is considered as the fitness value 𝐹𝑖 of a chromosome, namely [32], 𝐹𝑖 =
∑𝑚 𝑖
𝑘 , 𝑦𝑖 − 𝑜𝑖
(1)
where 𝑚 is the number of training data points, 𝑦𝑖 is the actual output of the 𝑖th data point, 𝑜𝑖 is the forecast output of the 𝑖th data point via the NN, and 𝑘 is a coefficient, set to be 10. 3.2.3. Selection Process. A selection operation is implemented by pinning the roulette wheel method; that is, a selection strategy is executed according to the fitness value. Thus, the selection probability 𝑝𝑖 of a chromosome is formulated as 𝑝𝑖 =
𝐹𝑖 pop size ∑𝑖=1
𝐹𝑖
.
(2)
3.2.4. Crossover Process. A crossover operation is implemented by a real number crossover method. The crossover
𝑎𝑙𝑗 = 𝑎𝑙𝑗 ⋅ (1 − 𝑧) + 𝑎ℎ𝑗 ⋅ 𝑧,
(3)
where 𝑧 is a random number and 𝑧 ∈ (0, 1). 3.2.5. Mutation Process. A mutation operation is implemented. The detailed mutation operation of the 𝑗th gene 𝑎𝑖𝑗 for ℎth chromosome is given as follows:
𝑎 + (𝑎ℎ𝑙 − 𝑎max ) ⋅ 𝑓 (𝑔) , 𝑟 ≥ 0.5, 𝑎ℎ𝑙 = { ℎ𝑙 𝑎ℎ𝑙 + (𝑤min − 𝑎ℎ𝑙 ) ⋅ 𝑓 (𝑔) , 𝑟 < 0.5,
(4)
where 𝑎max is the upper bound of 𝑤ℎ𝑙 , 𝑎min is the lower bound of 𝑎ℎ𝑙 , 𝑓(𝑔) = 𝑟2 (1 − 𝑔/𝐺max ), 𝑟2 is a random number, 𝑔 denotes the current number of generations, 𝐺max is the maximum number of generations and ensures that (1 − 𝑔/𝐺max ) is positive, and 𝑟 ∈ (0, 1) is a random number. The GA algorithm usually has the following steps. Step 1. Initialize pop size chromosomes, probability of mutation pr𝑚 , probability of crossover pr𝑐 , and maximum generation 𝑔max . Step 2. Calculate the objective value and fitness of all chromosomes. Step 3. Select the chromosomes by spinning the roulette wheel. Step 4. Update the chromosomes by crossover and mutation operations. Step 5. Repeat Steps 2–4 for a given number of cycles. Step 6. Report the best chromosome as the optimal solution. 3.3. Optimization Algorithm (NN-GA). NN-GA is a hybrid intelligent optimization algorithm integrating neural networks (NN) and genetic algorithm (GA). Its basic idea is described as follows. Firstly, based on the feature of actual problem and related knowledge of NN, an appropriate NN model is established and its prediction result is output. Additionally, the prediction output is considered as the fitness value of a chromosome of GA, and then its selection, crossover and mutation operations are executed accordingly. When the given maximum generation is reached, the algorithm ends. The best chromosome is assigned to the optimal solution of the corresponding problem. Its basic steps are presented hereinafter [33, 34].
Mathematical Problems in Engineering
5 Initialize chromosomes Calculate the fitness value Selection
Input neuron
Crossover Hidden neuron Mutation Output neuron
The maximum generation
No
Yes Output the optimal solution GA optimization
NN training
Figure 2: Flow chart of NN-GA algorithm.
Step 1. Initialize the parameters of NN and GA structures. Step 2. Determine or generate training input-output data of NN based on actual problem. Step 3. Train a neural network to approximate the fitness function of the actual problem. Step 4. Initialize pop size chromosomes of GA.
Table 2: Comparative analysis between experimental data and test result of NN for tool I. Data no. 1 2 3 4
Experiment data
Test result
Error
Relative error (%)
18.06 23.17 19.05 22.34
17.52 21.53 18.26 22.35
0.54 1.64 0.7888 0.01
3.00 7.07 4.15 0.05
Step 5. Calculate the fitness values for all chromosomes by the trained neural network. Step 6. Select the chromosomes by spinning the roulette wheel. Step 7. Update the chromosomes by crossover and mutation operations.
The parameter of NN-GA algorithm is set as follows: the population size pop size is 30, the probability of crossover pr𝑐 is 0.4, the probability of mutation pr𝑚 is 0.2, the maximum number of generations 𝑔max is 100, and the parameters of the NN structure are given in Section 3.1.
Step 8. Repeat steps 5–7 for a given number of cycles. Step 9. Report the best chromosome as the optimal solution of the according problem. In addition, its flow chart is presented, as shown in Figure 2. The above algorithms have been implemented in the MATLAB (R2009b) programming language.
4. Optimization and Comparison of Removal Efficiency on Different Removal Tools Based on the obtained experimental data with different removal tools, combined with the above-mentioned NN-GA algorithm, removal efficiency (time) optimization and their comparison for two types of removal tools are presented hereinafter.
4.1. Optimization of Removal Efficiency for Tool I 4.1.1. NN modeling and result of removal efficiency of tool I. First, the NN is trained using 11 groups of data randomly selected from Table 1, and then the remaining 4 groups of data are viewed as test samples. When they are output, their predicted results are obtained and listed in Table 2. In addition, the error and relative error between experimental data and test results are obtained, as shown in Table 2. Note that the error is defined as follows: error = |𝜉 − 𝜂| and relative error = |𝜉 − 𝜂|/𝜂 × 100%, where 𝜉 is the test result and 𝜂 is the experimental data. Based on the results of Table 2, it can be seen that the maximum absolute error between test result and experimental data are less than 9%. It reveals that the NN is accurate and effective when it is used to predict the removal time; That is,
6
Mathematical Problems in Engineering 27.34
17.12
Fitness of the best individual
Fitness of the best individual
17.14 17.1 17.08 17.06 17.04 17.02 17 16.98
0
20
40
60 Generation
80
100
120
Figure 3: The fitness curve of best individual of disassembly efficiency optimization for tool I. Table 3: Comparative analysis between experimental data and test result of NN for tool II. Data no. 1 2 3 4
Experiment data
Test result
Error
Relative error (%)
35.73 39.92 30.49 34.87
35.29 39.26 29.64 36.97
0.44 0.66 0.85 2.10
1.2 1.6 2.8 5.7
the predicted output can be approximately considered as the actual output. Initialize 30 chromosomes of GA and their fitness values are calculated by the trained NN, the fitness curve of the best individual can be obtained after the GA algorithm is executed, which is shown in Figure 3. Note that, in the initialization process, the length of a chromosome is 2; namely a chromosome {𝑎1 , 𝑎2 } denotes the influence factors of removal time. In this paper, 𝑎1 and 𝑎2 denote tightening torque and maximum tension of the operator, respectively. They can be randomly obtained from their feasible interval when they are initialized; that is, 𝑎1 ∈ [25, 75] and 𝑎2 ∈ [12, 28]. After the algorithm is run, the optimal solution, that is, 16.99, and the optimal individual, that is, {36.96, 18.56}, can be obtained. The results denote that the highest disassembly efficiency is 16.99 seconds when disassembly tool I is used to the remove the bolt. Compared with the best experimental result; that is, 18.06 seconds, the disassembly efficiency is improved by 5.92%, that is, (18.06 − 16.99)/18.06 × 100% = 5.92%. The obtained result can be conducted to the accrual disassembly process of the bolt. In a word, the disassembly efficiency of tool I is effectively improved by the optimization of integrated NN-GA algorithm, and the feasibility of the proposed algorithm is verified. 4.2. Optimization of Removal Efficiency for Tool II. Similarly, after the NN is trained, the test results of 4 test data of tool II are shown in Table 3. Based on the results of Table 3, it can be seen that the maximum absolute error between the test result and experimental data is less than 6%. It reveals that the NN is
27.32 27.3 27.28 27.26 27.24 27.22 27.2 27.18
0
10
20
30 40 Generation
50
60
70
Figure 4: The fitness curve of the best individual of disassembly efficiency optimization for disassembly tool II.
accurate and effective in the prediction of the removal time with enough satisfaction. According to the trained NN, after the algorithm is run, the optimal solution, namely, 27.15, and the optimal individual, namely, {40.37, 25.79}, can be obtained, as shown in Figure 4. The results denote that the highest disassembly efficiency is 27.15 seconds when disassembly tool II is used to remove the bolt. Compared with the best experiment result, that is, 29.18 seconds, the disassembly efficiency is improved by 6.96%; namely, (29.18 − 27.15)/29.18 × 100% = 6.96%. The results denote that the disassembly efficiency of tool II is effectively improved by the optimization of integrated NN-GA algorithm. In short, the proposed algorithm is feasible and effective when it is used to optimize disassembly efficiency for disassembly tool II. 4.3. Comparison Analysis of Removal Efficiency for Two Types of Removal Tools. In order to measure the removal efficiency of different removal tools, the removal efficiency ratio of one tool to another tool is defined in this paper. Definition 1. Removal efficiency ratio of one tool to another tool is defined as the increased or decreased ratio of removal efficiency of one tool to another tool. Mathematically, 𝑅 − 𝑅2 × 100%, 𝛽= 1 𝑅2
(5)
where 𝑅1 denotes the removal efficiency of one tool and 𝑅2 denotes the removal efficiency of another tool. Based on the defined removal efficiency ratio, combined with the optimal results of the removal efficiency of two different tools, the comparison of their removal efficiency is presented. According to the obtained optimal results of removal efficiency of two different tools in Section-A and Section-B, their removal efficiency ratio is obtained, namely |16.99 − 27.15|/27.15 × 100% = 37.42%. For removal efficiency, the small of the value, the better of it. Thus, the results denote that the removal efficiency of tool I to tool II is improved by 43.82% when they are used to remove the same bolt; that is,
Mathematical Problems in Engineering compared to removal tool II, removal I can faster complete the removal task and save time by 37.42%.
5. Conclusion Disassembly tools selection and their disassembly efficiency analysis play an important role in the product disassembly decision making. In order to guide decision makers in making better disassembly decisions, this work presents the optimization and comparison of removal efficiency for different removal tools for the first time. Firstly, taking the bolt as an object to be removed, this work designs removal experiments by considering some factors influencing the removal process for two types of removal tools. Secondly, based on the obtained experimental data, a NN-GA algorithm integrating neural networks (NN) and genetic algorithm (GA) is proposed to optimize the removal efficiency of two different removal tools. From the results, we can see that the efficiency of tools I and II is improved by 6.96% and 5.92%, respectively. It denotes that the disassembly efficiency of disassembly tool is effectively improved by the optimization of integrated NN-GA algorithm. The future work is to find and use actual industrial disassembly data to validate this method to provide the best decision support for disassembly practice. In addition, in the future we should study the control issue of disassembly process based on related theories [35, 36].
Acknowledgments This work is financially supported by the Postdoctoral Science Foundation Project of China under Grant no. 2013M541329, Youth Academic Backbone Project for University of Heilongjiang Province, and Student Research Training Project under Grant no. KY2013006.
References [1] E. Kongar and S. M. Gupta, “Disassembly to order system under uncertainty,” Omega, vol. 34, no. 6, pp. 550–561, 2006. [2] L. Brennan, S. M. Gupta, and K. N. Taleb, “Operations planning issues in an assembly/disassembly environment,” International Journal of Operations & Production Management, vol. 14, no. 9, pp. 57–67, 1994. [3] G. Tian, Y. Liu, H. Ke, and J. Chu, “Energy evaluation method and its optimization models for process planning with stochastic characteristics: a case study in disassembly decisionmaking,” Computers and Industrial Engineering, vol. 63, no. 3, pp. 553–563, 2011. [4] A. Gungor and S. M. Gupta, “An evaluation methodology for disassembly processes,” Computers and Industrial Engineering, vol. 33, no. 1-2, pp. 329–332, 1997. [5] E. Kroll, B. Beardsley, and A. Parulian, “A methodology to evaluate ease of disassembly for product recycling,” IIE Transactions, vol. 28, no. 10, pp. 837–845, 1996. [6] E. Kroll and B. S. Carver, “Disassembly analysis through time estimation and other metrics,” Robotics and Computer-Integrated Manufacturing, vol. 15, no. 3, pp. 191–200, 1999.
7 [7] T. Suga, K. Saneshige, and J. Fujimoto, “Quantitative disassembly evaluation,” in Proceedings of IEEE International Symposium on Electronics and the Environment (ISEE ’96), pp. 19–24, May 1996. [8] H. S. Mok, H. J. Kim, and K. S. Moon, “Disassemblability of mechanical parts in automobile for recycling,” Computers and Industrial Engineering, vol. 33, no. 3-4, pp. 621–624, 1997. [9] A. Desai and A. Mital, “Evaluation of disassemblability to enable design for disassembly in mass production,” International Journal of Industrial Ergonomics, vol. 32, no. 4, pp. 265–281, 2003. [10] A. Mital and A. Desai, “A structured approach to new product design, development and manufacture part II: putting the product together (assembly) and disposal (disassembly),” International Journal of Industrial Ergonomics, vol. 14, pp. 23– 32, 2007. [11] A. Desai and A. Mital, “Incorporating work factors in design for disassembly in product design,” Journal of Manufacturing Technology Management, vol. 16, no. 7, pp. 712–732, 2005. [12] S. K. Das, P. Yedlarajiah, and R. Narendra, “An approach for estimating the end-of-life product disassembly effort and cost,” International Journal of Production Research, vol. 38, no. 3, pp. 657–673, 2000. [13] M. A. Ilgin and S. M. Gupta, “Performance improvement potential of sensor embedded products in environmental supply chains,” Resources, Conservation and Recycling, vol. 55, no. 6, pp. 580–592, 2011. [14] M. A. Ilgin and S. M. Gupta, “Recovery of sensor embedded washing machines using a multi-kanban controlled disassembly line,” Robotics and Computer-Integrated Manufacturing, vol. 27, no. 2, pp. 318–334, 2011. [15] G. Tian, Y. Liu, Q. Tian, and J. Chu, “Evaluation model and algorithm of product disassembly process with stochastic feature,” Clean Technologies and Environmental Policy, pp. 1–12, 2011. [16] G. Tian, M. Zhou, J. Chu, and Y. Liu, “Probability evaluation models of product disassembly cost subject to random removal time and different removal labor cost,” IEEE Transactions on Automation Science and Engineering, vol. 9, no. 2, pp. 288–295, 2012. [17] Y. Tang and M. Zhou, “A systematic approach to design and operation of disassembly lines,” IEEE Transactions on Automation Science and Engineering, vol. 3, no. 3, pp. 324–330, 2006. [18] Y. Tang, M. Zhou, and M. Gao, “Fuzzy-petri-net-based disassembly planning considering human factors,” IEEE Transactions on Systems, Man, and Cybernetics, Part A, vol. 36, no. 4, pp. 718–725, 2006. [19] M. Gao, M. Zhou, and Y. Tang, “Intelligent decision making in disassembly process based on fuzzy reasoning Petri nets,” IEEE Transactions on Systems, Man, and Cybernetics, Part B, vol. 34, no. 5, pp. 2029–2034, 2004. [20] Y. Tang, “Learning-based disassembly process planner for uncertainty management,” IEEE Transactions on Systems Man and Cybernetics, Part A, vol. 39, no. 1, pp. 134–143, 2009. [21] Y. Tang, M. Zhou, E. Zussman, and R. Caudill, “Disassembly modeling, planning, and application,” Journal of Manufacturing Systems, vol. 21, no. 3, pp. 200–217, 2002. [22] L. H. Shu and W. C. Flowers, “Application of a design-for-remanufacture framework to the selection of product life-cycle fastening and joining methods,” Robotics and Computer-Integrated Manufacturing, vol. 15, no. 3, pp. 179–190, 1999.
8 [23] A. G¨ung¨or, “Evaluation of connection types in design for disassembly (DFD) using analytic network process,” Computers and Industrial Engineering, vol. 50, no. 1-2, pp. 35–54, 2006. [24] M. M. Youssif, R. A. Alkadeem, and M. A. El Dardiry, “Incorporating ergonomic factors in disassembly sequence planning,” Alexandria Engineering Journal, vol. 50, no. 3, pp. 213–217, 2011. [25] H.-E. Tseng, C.-C. Chang, and C.-J. Cheng, “Disassembly-oriented assessment methodology for product modularity,” International Journal of Production Research, vol. 48, no. 14, pp. 4297– 4320, 2010. [26] G. D. Tian, M. C. Zhou, and J. W. Chu, “A chance constrained programming approach to determine the optimal disassembly sequence,” IEEE Transactions on Automation Science and Engineering, vol. 10, pp. 1004–1013, 2013. [27] R. Singh, R. S. Bhoopal, and S. Kumar, “Prediction of effective thermal conductivity of moist porous materials using artificial neural network approach,” Building and Environment, vol. 46, no. 12, pp. 2603–2608, 2011. [28] T.-C. Chen and T.-T. Sheu, “Model reference robust speed control for induction-motor drive with time delay based on neural network,” IEEE Transactions on Systems, Man, and Cybernetics, Part A, vol. 31, no. 6, pp. 746–752, 2001. [29] G. D. Tian, J. W. Chu, and T. G. Qiang, “Influence factor analysis and prediction models for component removal time in manufacturing,” Proceedings of the Institution of Mechanical Engineers, Part B: Journal of Engineering Manufacture, vol. 227, pp. 1530–1537, 2013. [30] G. Tian, J. Chu, Y. Liu, H. Ke, X. Zhao, and G. Xu, “Expected energy analysis for industrial process planning problem with fuzzy time parameters,” Computers and Chemical Engineering, vol. 35, no. 12, pp. 2905–2912, 2011. [31] M. Sedighi and D. Afshari, “Creep feed grinding optimization by an integrated GA-NN system,” Journal of Intelligent Manufacturing, vol. 21, no. 6, pp. 657–663, 2010. [32] D. F. Cook, C. T. Ragsdale, and R. L. Major, “Combining a neural network with a genetic algorithm for process parameter optimization,” Engineering Applications of Artificial Intelligence, vol. 13, no. 4, pp. 391–396, 2000. [33] S. Erkaya and I. Uzmay, “A neural-genetic (NN-GA) approach for optimising mechanisms having joints with clearance,” Multibody System Dynamics, vol. 20, no. 1, pp. 69–83, 2008. [34] G.-R. Hua, X.-H. Zhou, and X.-Y. Ruan, “GA-based synthesis approach for machining scheme selection and operation sequencing optimization for prismatic parts,” International Journal of Advanced Manufacturing Technology, vol. 33, no. 5-6, pp. 594– 603, 2007. [35] S. He and F. Liu, “Robust stabilization of stochastic Markovian jumping systems via proportional-integral control,” Signal Processing, vol. 91, no. 11, pp. 2478–2486, 2011. [36] S. He and F. Liu, “Robust peak-to-peak filtering for Markov jump systems,” Signal Processing, vol. 90, no. 2, pp. 513–522, 2010.
Mathematical Problems in Engineering
Advances in
Operations Research Hindawi Publishing Corporation http://www.hindawi.com
Volume 2014
Advances in
Decision Sciences Hindawi Publishing Corporation http://www.hindawi.com
Volume 2014
Journal of
Applied Mathematics
Algebra
Hindawi Publishing Corporation http://www.hindawi.com
Hindawi Publishing Corporation http://www.hindawi.com
Volume 2014
Journal of
Probability and Statistics Volume 2014
The Scientific World Journal Hindawi Publishing Corporation http://www.hindawi.com
Hindawi Publishing Corporation http://www.hindawi.com
Volume 2014
International Journal of
Differential Equations Hindawi Publishing Corporation http://www.hindawi.com
Volume 2014
Volume 2014
Submit your manuscripts at http://www.hindawi.com International Journal of
Advances in
Combinatorics Hindawi Publishing Corporation http://www.hindawi.com
Mathematical Physics Hindawi Publishing Corporation http://www.hindawi.com
Volume 2014
Journal of
Complex Analysis Hindawi Publishing Corporation http://www.hindawi.com
Volume 2014
International Journal of Mathematics and Mathematical Sciences
Mathematical Problems in Engineering
Journal of
Mathematics Hindawi Publishing Corporation http://www.hindawi.com
Volume 2014
Hindawi Publishing Corporation http://www.hindawi.com
Volume 2014
Volume 2014
Hindawi Publishing Corporation http://www.hindawi.com
Volume 2014
Discrete Mathematics
Journal of
Volume 2014
Hindawi Publishing Corporation http://www.hindawi.com
Discrete Dynamics in Nature and Society
Journal of
Function Spaces Hindawi Publishing Corporation http://www.hindawi.com
Abstract and Applied Analysis
Volume 2014
Hindawi Publishing Corporation http://www.hindawi.com
Volume 2014
Hindawi Publishing Corporation http://www.hindawi.com
Volume 2014
International Journal of
Journal of
Stochastic Analysis
Optimization
Hindawi Publishing Corporation http://www.hindawi.com
Hindawi Publishing Corporation http://www.hindawi.com
Volume 2014
Volume 2014