communications Nanocarriers
Efficient Cytosolic Delivery of siRNA Using HDLMimicking Nanoparticles Mi Yang, Honglin Jin, Juan Chen, Lili Ding, Kenneth K. Ng, Qiaoya Lin, Jonathan F. Lovell, Zhihong Zhang, and Gang Zheng* Small interfering RNA (siRNA) is a powerful tool for specific gene suppression in vivo and more recently has reached human clinical trials as a potential therapeutic approach.[1] Due to their highly negative charge, naked siRNAs cannot readily penetrate through cell membranes and thus require delivery strategies. A variety of nonviral delivery approaches have been developed to efficiently traffic siRNA into cells, including chemical modification (e.g., cholesterol–siRNA),[2] conjugation to peptides,[3] antibodies[4] or nanoparticles,[5] electrostatic association with cationic delivery systems,[6] and encapsulation into lipid nanoparticles.[7] Therapeutic application of RNA interference (RNAi) requires delivery of siRNAs into the cytoplasm of targeted cells and tissues, where they are recognized and associated with RNA-induced silencing complex (RISC) to perform their function.[8] This rate-limiting delivery step has been dealt with by several approaches, such as co-encapsulation of fusogenic lipid[9] or fusogenic peptide,[10] liposomal bubbles and ultrasound,[11] laser-induced gene silencing via gold nanoshells,[12] and photochemical internalization (PCI).[13] However, these
Dr. M. Yang,[+] H. Jin,[+] Dr. J. Chen, L. Ding, K. K. Ng, Q. Lin, J. F. Lovell, Dr. Z. Zhang, Prof. G. Zheng Ontario Cancer Institute and Campbell Family Cancer Research Institute TMDT 5–363, 101 College Street, Toronto, ON, M5G 1L7, Canada E-mail:
[email protected] Dr. M. Yang, H. Jin, Q. Lin, Dr. Z. Zhang, Prof. G. Zheng Department of Medical Biophysics University of Toronto Toronto, Canada Dr. M. Yang Department of Oncology Drum Tower Hospital Affiliated to School of Medicine and Clinical Cancer Institute of Nanjing University Nanjing, China H. Jin, Q. Lin, Dr. Z. Zhang Britton Chance Center for Biomedical Photonics Wuhan National Laboratory for Optoelectronics Huazhong University of Science and Technology Wuhan 430074, China K. K. Ng, J. F. Lovell, Prof. G. Zheng Institute of Biomaterials and Biomedical Engineering University of Toronto Toronto, Canada [+] These authors contributed equally to this work. DOI: 10.1002/smll.201001589
568
wileyonlinelibrary.com
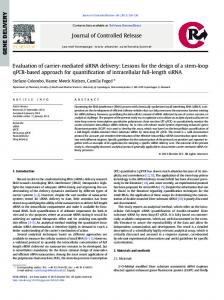
approaches generally disrupt the cytoplasmic membrane or require the uptake of siRNA through endocytosis before the siRNA can be released into the cytoplasm, and therefore improved approaches for cytosolic delivery of siRNA are required. We recently reported a high-density lipoprotein (HDL)-mimicking peptide–phospholipid scaffold (HPPS) nanocarrier for the direct cytosolic delivery of fluorescent dyes via the scavenger receptor class B type I (SRBI) pathway.[14] The central components of the HPPS are phospholipids, cholesteryl oleate, and amphipathic α-helical peptides, which mimic apolipoprotein A-I (ApoA-1), the major protein in HDL. The interaction between the self-assembled peptide network and the colloidal phospholipid monolayer enables the HPPS to mimic the behavior of plasma-derived HDL in both structural and functional properties, such as monodisperse size, long circulation half-life, excellent biocompatibility, and more importantly the ability to target SRBI-expressing cancer cells.[15] The SRBI pathway is particularly attractive for siRNA delivery because of its ability to directly transport payload into the cytosol of targeted cells, thus providing a viable alternative to prevent the intracellularly active siRNA from detrimental endo-lysosomal degradation.[16,17] To investigate the siRNA loading capability and delivery efficiency of HPPS, bcl-2 oncogene with anti-apoptotic activity was chosen as a cellular RNAi target. Cholesterolmodified bcl-2 siRNA (chol-si-bcl-2) was intercalated into the phospholipid monolayer of HPPS, which resulted in stable HPPS-chol-si-bcl-2 nanoparticles (Figure 1A). HPPSchol-si-bcl-2 was purified using fast protein liquid chromatography (FPLC). The final siRNA payload and recovery yield of HPPS-chol-si-bcl-2 were examined by varying the initial mixing ratio of chol-si-bcl-2 and HPPS. As shown in Figure 1B, the increase of the chol-si-bcl-2 to HPPS ratio led to an increase of the siRNA payload, which reached a maximum when the ratio exceeded 10:1. Meanwhile, the chol-sibcl-2 recovery yield continuously decreased with an increase in the chol-si-bcl-2 to HPPS ratio. Therefore, to achieve both high siRNA payload and good recovery yield, an initial ratio of 10:1 for chol-si-bcl-2/HPPS was selected. This led to a final payload of eight chol-si-bcl-2 molecules per HPPS with a 64% chol-si-bcl-2 recovery yield. Loading chol-si-bcl-2 on HPPS dramatically changed the surface charge of the nanoparticle, as evidenced by the zeta-potential shift from –2.7 ± 1.9 mV of HPPS to –15.2 ± 4.8 mV of HPPS-chol-si-bcl-2.
© 2011 Wiley-VCH Verlag GmbH & Co. KGaA, Weinheim
small 2011, 7, No. 5, 568–573
Cytosolic Delivery of siRNA Using HDL-Mimicking Nanoparticles
2000, and 3) HPPS-FITC-chol-si-bcl-2. Transferrin labeled with Alexa Fluor 633 was used as an early endosome marker. As shown in Figure 2A, most of the FITC-chol-si-bcl-2 remained on the outer cell membrane of KB cells. Lipofectamine 2000-transfected FITC-chol-si-bcl-2 accumulated into early endosomes based on the fluorescence co-localization between the FITC-chol-si-bcl-2 and Alexa Fluor 633-transferrin. In contrast, the HPPS nanoparticle effectively delivered FITCchol-si-bcl-2 into the cytoplasm of KB cells. To further quantify this cytosolic delivery of siRNA by the HPPS, a subcellular fractionation assay was used to determine the siRNA uptake in different cell organelles. The results showed that more than 90% of the total intracellular FITC-chol-si-bcl-2 signal was found in the cytosol (Figure 2B). In addition, both confocal imaging and flow cytometry studies showed that KB cells (SRBI+) Figure 1. Characterization of HPPS-chol-si-bcl-2 nanoparticles. A) Schematic of HPPS-cholhad much higher uptake of chol-si-bcl-2 siRNA. B) Optimization of HPPS-chol-si-bcl-2 formulations by adjusting the starting ratio of than HT1080 cells (SRBI−) after incubachol-si-bcl-2 and HPPS. C) TEM image of HPPS-chol-si-bcl-2 nanoparticles. D) Stability of tion with HPPS-FITC-chol-si-bcl-2 under HPPS-chol-si-bcl-2 in PBS, plasma, or FBS at 4 or 37 °C. the same conditions (see Figure S2 in the Supporting Information). These compleTransmission electron microscopy (TEM) and dynamic mentary results demonstrate that the HPPS selectively and light scattering (DLS) were used to examine the morphology directly delivered its siRNA payload into the cytoplasm of and size distribution of this HPPS-chol-si-bcl-2 formulation. target cells. The HPPS-chol-si-bcl-2 displayed a high level of monodisperWe next assessed the bcl-2 silencing efficacy of HPPSsity with a hydrodynamic diameter of 25.3 ± 1.2 nm (Figure 1C, FITC-chol-si-bcl-2. The bcl-2 oncogene regulates the and Supporting Information (SI), Figure S1). Next, the storage mitochondria-mediated apoptosis pathway, and knockdown of stability and serum stability of HPPS-chol-si-bcl-2 were bcl-2 is known to promote apoptosis.[17] KB cells were chosen examined, where chol-si-bcl-2 was used as control for both because of their high expression of SRBI as well as high stability studies to monitor whether there was free siRNA expression of Bcl-2 protein (see Figure S3 in the Supporting release from HPPS, as evidenced by the different gel shifts of HPPS-chol-si-bcl-2 and chol-si-bcl-2. As shown in Figure 1D, both stability studies showed no gel degradation or gel migration, thus indicating that HPPS-chol-siRNA nanoparticles were physically stable and intact after 4 weeks of storage at 4 °C in phosphatebuffered saline (PBS) as well as under coincubation with 10% fetal bovine serum (FBS) or 10% human plasma at 4 or 37 °C for 3 h. To confirm the cytosolic delivery of HPPS-chol-si-bcl-2, confocal microscopy was used to assess the intracellular uptake of fluorescein isothiocyanatelabeled chol-si-bcl-2 (FITC-chol-si-bcl-2) on SRBI high-expressing KB cells. Three Figure 2. Cytosolic delivery of siRNA using the HPPS. A) Confocal image of KB cells (SRBI experimental groups were included: receptor positive) incubated with HPPS-FITC-chol-si-bcl-2, FITC-chol-si-bcl-2 alone, and 1) FITC-chol-si-bcl-2 alone, 2) FITC- Lipofectamine-FITC-chol-si-bcl-2 (green: FITC-chol-si-bcl-2, red: Alexa Fluor 633-transferrin, chol-si-bcl-2 complexed with the cati- blue: Hoechst 33258). B) Uptake of FITC-chol-si-bcl-2 in different cell organelles (n = 3, onic transfection agent Lipofectamine ∗p < 0.05, ∗∗p < 0.01). small 2011, 7, No. 5, 568–573
© 2011 Wiley-VCH Verlag GmbH & Co. KGaA, Weinheim
wileyonlinelibrary.com
569
communications
M. Yang et al.
Figure 3. Functional knockdown using HPPS-chol-si-bcl-2 in KB cells (SRBI positive); n = 3. A) Detection of Bcl-2 protein expression level by Western blot. B) Quantification of the apoptotic and necrotic cells using chol-si-bcl-2, HPPS-chol-si-bcl-2, or HPPS alone relative to a saline control treatment group (n = 3).
Information). As shown in the Western blot study (Figure 3A), upon HPPS-chol-si-bcl-2 treatment, Bcl-2 protein expression in KB cells decreased in a dose-dependent manner. HPPSchol-si-bcl-2 at the dose of 400 nm reduced the Bcl-2 protein expression to 35 ± 9% of the untreated control. In comparison, chol-si-bcl-2 alone at the same siRNA concentration only reduced the Bcl-2 protein expression to 84 ± 8% of the untreated control. This Bcl-2 protein downregulation was consistent with the bcl-2 gene silencing effect observed at the mRNA level (see Figure S4A in the Supporting Information)
570
wileyonlinelibrary.com
and with an apoptosis assay showing that HPPS-chol-si-bcl-2 resulted in the increase of apoptosis by 2.5-fold over chol-sibcl-2 alone (Figure 3B). In addition, HPPS was more efficient than Lipofectamine in the delivery of chol-siRNA to reduce the mRNA expression (Figure S4B, Supporting Information). On the contrary, when HPPS-chol-si-bcl-2 was used to treat SRBI low-expressing HT1080 cells, no significant bcl-2 mRNA silencing and Bcl-2 protein downregulation were observed (see Figure S5 in the Supporting Information). The SRBI-specific RNAi effect of HPPS-chol-si-bcl-2 indicates that HPPS is an effective cytosolic delivery vehicle for targeting delivery of therapeutic siRNA. In this study, we introduced the HDL-mimicking HPPS nanoparticle as an efficient nanocarrier for the delivery of chol-si-bcl-2 to cancer cells for gene silencing. The chol-siRNA conjugates are well known for their “druglike” properties via systemic adminstration.[2] Recent studies demonstrated that the delivery mechanism of this strategy occurred through specific interactions between chol-siRNA and serum lipoproteins including HDL.[18] Furthermore, when chol-siRNA was preloaded onto mouse HDL at a 1:1 ratio, significant enhancement of gene silencing efficiency was observed. This development sheds light on the behavior of the HPPS nanoparticles in chol-siRNA delivery. HDL is an endogenous nanocarrier possessing many attractive features for drug delivery, such as ultrasmall size, favorable surface properties, and SRBImediated cytosolic delivery of cholesterol esters. One potential hurdle in developing HDL as a clinically viable nanocarrier lies in the fact that lipoproteins are isolated from fresh donor plasma, which might result in batch-to-batch variation and pose some scale-up challenges. By mimicking native HDL, the HPPS-based siRNA delivery platform adapts all the merits of HDL nanoparticles and possesses increased power in its flexibility and scalability.[14,15] Here, we have observed a SRBI-mediated direct cytosolic delivery of chol-siRNA using HPPS and we postulated that SRBI binds HPPS at the cell surface in such a way as to provide a “channel” along which cholesterol-modified siRNA molecules diffuse down the concentration gradient from HPPS particles to the cell plasma membrane, similar to the HDL-mediated cholesterol transport pathway.[17] Our previous data also indicate that HPPS is a safe delivery vehicle, as evidenced by the absence of adverse effects when 2000 mg kg−1 of HPPS was administered intravenously and HPPS core-loaded paclitaxel drugs only exerted cytotoxicity to SRBI-targeted tumors.[19] Several groups have demonstrated that co-delivery of bcl-2 siRNA and other anticancer drugs led to the enhancement of therapeutic efficacy in multidrug-resistant cancer cells.[20] Such a synergistic approach can be easily engrafted to the HPPS delivery system for combination therapy that takes advantage of the simultaneous core- and surface-loading capability of HPPS. In summary, a flexible and biocompatible siRNA delivery nanocarrier was developed by mimicking the structure and function of native HDL. The direct cytosolic delivery ability of cholesterol-modified siRNA displayed by the HPPS nanoparticle resulted in the selective and effective delivery of siRNA to targeted cells. This provides a promising strategy to bypass the challenge of endo-lysosomal trafficking, thus
© 2011 Wiley-VCH Verlag GmbH & Co. KGaA, Weinheim
small 2011, 7, No. 5, 568–573
Cytosolic Delivery of siRNA Using HDL-Mimicking Nanoparticles
making the HPPS a useful tool for therapeutic siRNA delivery.
Experimental Section Materials: 1,2-Dimyristoyl-sn-glycero-3-phosphocholine (DMPC) was obtained from Avanti Polar Lipids Inc. (USA). Cholesteryl oleate, anti-beta-actin antibody, and annexin V-FITC apoptosis detection kit were purchased from Sigma–Aldrich Co. (USA). The cell culture medium RPMI 1640, FBS, trypsin-EDTA solution, Lipofectamine 2000, Hoechst 33258, and transferrin (Alexa Fluor 633) were all purchased from Gibco-Invitrogen Co. (USA). The 18 amino acid apoA-1 mimetic peptide (AP), Ac-FAEKFKEAVKDYFAKFWD, was synthesized on a PS-3 peptide synthesizer (Protein Technologies). Anti-Bcl-2 antibody and anti-rabbit secondary antibody were purchased from Cell Signaling Technology (USA). All siRNAs were synthesized by Genepharma Co. (China). Cholesterol-conjugated siRNA-bcl-2 (chol-si-bcl-2) consisted of the sense strand 5’-cholGfUGAAGfUfCAAfCAfUGfCfCfUGfC-dTsdTs-3’ and antisense strand 5’-GfCAGGfCAfUGfUfUGAfCfUfUfCAfC-dTsdT-3’. The fluoresceinlabeled chol-si-bcl-2 (FITC-chol-si-bcl-2) had the same sense sequence as chol-si-bcl-2 and had the antisense labeled with fluorescein on the 5’ end: 5’-FITC-GfCAGGfCAfUGfUfUGAfCfUfUfCAfCdTsdT-3’. Abbreviations are as follows: chol, cholesterol; fC and fU, 2’-deoxy-2’-fluoro cytidine and uridine, respectively; “s”, phosphorothioate linkage. The human epidermoid carcinoma KB cell line and human fibrosarcoma cell line HT1080 were purchased from the American Type Culture Collection. Preparation of HPPS-chol-si-bcl-2 Nanoparticles: The HPPS was prepared as previously described[15] and was purified by gel filtration chromatography using the Akta FPLC system (HiLoad 16/60 Superdex 200 pg, GE Healthcare) with Tris-buffered saline (10 mM Tris-HCl, 0.15 M NaCl, 1 mM EDTA, pH 7.5) at a flow rate of 1 mL min−1. The HPPS fraction at the retention time from 55 to 65 min was collected and concentrated to 1 μM by using a centrifugal filter device (10 000 MW, Amicon, Millipore). Chol-si-bcl-2 (20 μM) was prepared in RNAse-free water. The chol-si-bcl-2 and HPPS were mixed at various molar ratios and incubated for 30 min at room temperature. The mixture was then purified by FPLC to remove free chol-sibcl-2 and acquire HPPS-chol-si-bcl-2 nanoparticles. Determination of Nanoparticle Composition and Optimization of Formulations: The HPPS concentration was determined using the previously reported method[15] and the concentration of siRNA was quantified by measuring its absorbance at 260 nm. To optimize the HPPS-chol-si-bcl-2 formulation, chol-si-bcl-2 and HPPS were mixed and incubated with various molar ratios of chol-si-bcl-2/HPPS from 5:1 to 30:1. After 30 min of incubation, the complexes were purified by FPLC to remove free chol-si-bcl-2. The resultant siRNA payload was calculated by dividing the molar concentration of siRNA by that of HPPS. Morphology and Size Measurement: The morphology and size of HPPS-chol-si-bcl-2 was determined by staining with 1% uranyl acetate and imaging by TEM using a modern H-7000 transmission electron microscope (Hitachi, Inc., Japan) equipped with a digital image acquisition system. The particle size distribution of HPPSchol-si-bcl-2 was measured by DLS (Zetasizer Nano-ZS90; Malvern Instruments, UK) using a 4.0 mW He–Ne laser operating at 633 nm and a detector angle of 90°. small 2011, 7, No. 5, 568–573
Stability of HPPS-chol-si-bcl-2 Nanoparticles: To evaluate the storage stability, HPPS-chol-si-bcl-2 was prepared and stored in PBS at 4 °C for 1, 7, 14, 21, and 28 days. The stored samples were then taken out to measure their size variation by DLS. In addition, the samples (10 μL) were analyzed by electrophoresis using 1.5% agarose gel to monitor gel migration of the particles. Chol-si-bcl-2 alone was used as control. To check the stability in serum, HPPSchol-si-bcl-2 was incubated with PBS containing 10% FBS or PBS containing 10% human plasma at 4 or 37 °C for 3 h. The samples were then analyzed by electrophoresis using 1.5% agarose gel to monitor the release or degradation of chol-si-bcl-2 from HPPS. Confocal Microscopy: KB and HT1080 cells were seeded into eight-well cover-glass-bottom chambers (Nunc Lab-Tek, Sigma– Aldrich; 2 × 10⁴ per well) and incubated for 24 h at 37 °C in an atmosphere of 5% CO2 in a humidified incubator for confocal microscopy imaging. Lipofectamine 2000 (1 μL) was diluted with cell culture medium (100 μL) and incubated for 5 min at room temperature. The Lipofectamine 2000 solution was then mixed with FITC-chol-si-bcl-2 (6 μL, 20 μM) at room temperature for 30 min to form Lipofectamine-FITC-chol-si-bcl-2. FITC-chol-si-bcl-2 alone, HPPS-FITC-chol-si-bcl-2, and Lipofectamine-FITC-chol-si-bcl-2 were added to the chamber wells at a siRNA concentration of 200 nM. After 3 h of incubation, the medium was replaced with fresh cell culture medium, and Alexa Fluor 633-transferrin (1 μL, 2 mM) and Hoechst 33258 (0.5 μL, 5 mM) were added to each well. Cells were continuously incubated for 3 h at 37 °C. After replacing the medium with fresh cell culture medium, the fluorescence signal of the cells was imaged using Olympus FV1000 laser confocal scanning microscopy (Olympus, Tokyo, Japan) with excitation wavelengths of 488 nm (exciting FITC), 405 nm (exciting Hoechst 33258), and 633 nm (exciting transferrin). Quantification of siRNA Uptake in Different Cell Organelles: Cell organelles were separated by ultracentrifugation using a Beckman TL100 ultracentrifuge (Beckman, Palo Alto, USA) according to standard methods.[21] The fractionation buffer contained 10 mM Tris/acetic acid (pH 7.0) and 250 mM sucrose. KB cells were seeded in a 75 cm2 flask at a density of 5 × 10⁶ cells per well and incubated for 24 h at 37 °C in an atmosphere of 5% CO2 in a humidified incubator. FITC-chol-si-bcl-2 (500 μL) alone, HPPS-FITC-chol-si-bcl-2, and Lipofectamine-FITC-chol-si-bcl-2 were added to the chamber wells at a siRNA concentration of 400 nM. After 3 h of incubation, the medium was removed and the cells were rinsed with PBS and continuously incubated with fresh medium for 3 h. Then 3.5 × 10⁶ cells were harvested, washed three times with ice-cold PBS, and suspended in fractionation buffer (1 mL). The cell suspensions were gently passed through a syringe needle (20 gauge) 30 times and transferred to an ice-cold Dounce homo-genizer. The cells were homogenized on ice and the homogenates were centrifuged at 2000 g for 2 min to pelletize debris and undestroyed cells. The supernatant was collected in a new tube and the pellet was washed with fractionation buffer and centrifuged again to collect the supernatant. The combined supernatants were then centrifuged at 4000 g for 2 min to pelletize the plasma membrane and nuclei. The supernatant was transferred to a new tube and the pellet was washed with fractionation buffer and centrifuged again. The combined supernatants were centrifuged at 55 000 g for 90 min to pelletize mitochondria, microsomes, endosomes, and lysosomes. The pellet was washed and centrifuged again with fractionation buffer. The final combined supernatant contained highly purified cytosol.
© 2011 Wiley-VCH Verlag GmbH & Co. KGaA, Weinheim
wileyonlinelibrary.com
571
communications
M. Yang et al.
The fluorescence signals of different organelles were quantified by fluorometer at an excitation wavelength of 488 nm (exciting fluorescein) and emission wavelength of 520 nm. Polymerase Chain Reaction (PCR) Study: To observe bcl-2 gene expression, a PCR study was performed after treatment. KB and HT1080 cells were seeded in a six-well plate (1.2 × 10⁵ cells per well). After 24 h, 400 nM chol-si-bcl-2 alone and 100, 200, and 400 nM HPPS-chol-si-bcl-2 were added to the cells; the siRNAfree cell culture medium was used as control. After 48 h of incubation, total RNA was isolated from each well by using an RNeasy Mini kit (Qiagen) and quantified by UV spectrophotometry. Complementary DNA (cDNA) was prepared from total cellular RNA (2 μg) using RevertAid H Minus M-MuLV Reverse Transcriptase (Fermentas, Canada) and oligo-dT18 as primers according to the manufacturer’s recommendations. The amplification of bcl-2 gene was conducted in PCR mix (12.5 μL, 2×), water (9.5 μL), oligonucleotide primer (1 μL), and cDNA (2 μL). Cycles of amplification were run as follows: denaturation at 94 °C for 0.5 min, annealing at 57 °C for 0.5 min, and extension at 72 °C for 0.5 min. The amplification of cDNA was 21 cycles for KB cells and 30 cycles for HT1080 cells using the primer: Bcl2, sense 5’- TTCTTTGAGTTCGGTGGGGTC-3’, antisense 5’-GTGCTTGGCAATTAGTGGTCG-3’; beta 2-microglobulin (B2M), sense 5’-AGCAGAGAATGGAAAGTCAAA-3’, antisense 5’-TGTTGATGTTGGATAAGAGAA-3’. After amplification by PCR, samples were subjected to electrophoresis in 1% agarose gel containing 0.002% (v/v) Gelred. Gels were photographed with UV illumination. Western Blotting: To detect Bcl2 protein expression, KB and HT1080 cells were seeded in a six-well plate at a density of 2 × 10 5 cells per well and grown for 24 h. The cells were treated with 400 nM chol-siRNA alone and 100, 200, and 400 nM HPPS-chol-siRNA for 48 h. The cells incubated with siRNAfree cell culture medium were used as control. The cells were then washed twice with PBS and lysed by lysis buffer (100 μL, 50 m M 4-(2-hydroxyethyl)-1-piperazineethanesulfonic acid (HEPES), pH 8.0, 10% glycerol, 0.5% Triton X-100, 150 mM NaCl, 2 mM ethylene glycol tetraacetic acid (EGTA), 1.5 mM MgCl2, supplemented with 10 μg mL−1 leupeptin, 10 μg mL−1 aprotinin, 100 μ g mL −1 phenylmethylsulfonyl fluoride, and 1 m M sodium orthovanadate) for 10 min. The whole cell lysate was centrifuged at 700 g for 10 min. The supernatant was transferred to a new tube to measure protein concentration using the bicinchoninic acid method. To perform immunoblotting, the cell lysates from KB cells (10 μ g protein) or HT1080 cells (20 μg protein) were loaded per lane on a 10% sodium dodecyl sulfate (SDS)–polyacrylamide gel at 120 V and transferred to nitrocellulose membranes by using standard methods. The blot was removed from the transfer apparatus and soaked in TTBS (Tween–Tris-buffered saline: 0.1% Tween-20 in 100 mM Tris–HCl of pH 7.5, 0.9% NaCl) for two rinses of 15 min each. The membranes were blocked for 3 h in a solution of 7% powdered nonfat milk in TTBS. After gently rinsing with TTBS, the membranes were probed with a rabbit polyclonal primary antibody against Bcl-2 at 4 °C overnight. After washing three times, the membranes were treated with goat anti-rabbit secondary antibody for 1 h. Proteins were visualized using enhanced chemiluminescence reagents ECL + Plus (Amersham Life Science, USA) and Typhoon 9410 variable-mode imager (Amersham).
572
wileyonlinelibrary.com
Apoptosis Study: An annexin V-FITC apoptosis detection kit was used to analyze cell apoptosis. KB cells were seeded in a sixwell plate at a density of 2 × 10⁵ cells per well and grown for 24 h. The media were removed and the cells were incubated with 400 nM chol-siRNA alone or HPPS-chol-siRNA for 48 h. All the media were centrifuged to collect floating cells. Cells in each well were harvested and combined with the floating cells. After washing twice with cold PBS, the cells were resuspended in binding buffer (500 μL) and stained with annexin V-FITC (5 μL) and propidium iodide (PI; 10 μL) 10 min before flow cytometric analysis. The flow cytometry was performed on a Cytomics FC 500 series flow cytometry system from Beckman Coulter (excitation 633 nm for PI and 488 nm for FITC). Autofluorescence from the untreated cells was minimal. The maximum cell number count was 10 000 for all samples. Cells early in the apoptotic process should show staining with the annexin V-FITC alone, necrotic cells should show staining by both PI and annexin V-FITC, and live cells should not be stained by either PI or annexin V-FITC.
Supporting Information Supporting Information is available from the Wiley Online Library or from the author.
Acknowledgements This study was conducted with the support of the Ontario Institute for Cancer Research through the Government of Ontario, the Canadian Institute of Health Research, the Natural Sciences and Engineering Research Council of Canada, the China–Canada Joint Health Research Initiative (CIHR CCI-102936, NSFC-30911120489), the Ontario Ministry of Health and Long Term Care, and the Joey and Toby Tanenbaum/Brazilian Ball Chair in Prostate Cancer Research.
[1] a) D. Bumcrot, M. Manoharan, V. Koteliansky, D. W. Sah, Nat. Chem. Biol. 2006, 2, 711; b) M. E. Davis, J. E. Zuckerman, C. H. Choi, D. Seligson, A. Tolcher, C. A. Alabi, Y. Yen, J. D. Heidel, A. Ribas, Nature 2010, 464, 1067; c) M. Frank-Kamenetsky, A. Grefhorst, N. N. Anderson, T. S. Racie, B. Bramlage, A. Akinc, D. Butler, K. Charisse, R. Dorkin, Y. Fan, C. Gamba-Vitalo, P. Hadwiger, M. Jayaraman, M. John, K. N. Jayaprakash, M. Maier, L. Nechev, K. G. Rajeev, T. Read, I. Rohl, J. Soutschek, P. Tan, J. Wong, G. Wang, T. Zimmermann, A. de Fougerolles, H. P. Vornlocher, R. Langer, D. G. Anderson, M. Manoharan, V. Koteliansky, J. D. Horton, K. Fitzgerald, Proc. Natl. Acad. Sci. USA 2008, 105, 11915; d) K. T. Love, K. P. Mahon, C. G. Levins, K. A. Whitehead, W. Querbes, J. R. Dorkin, J. Qin, W. Cantley, L. L. Qin, T. Racie, M. Frank-Kamenetsky, K. N. Yip, R. Alvarez, D. W. Sah, A. de Fougerolles, K. Fitzgerald, V. Koteliansky, A. Akinc, R. Langer, D. G. Anderson, Proc. Natl. Acad. Sci. USA 2010, 107, 1864; e) A. P. McCaffrey, L. Meuse, T. T. Pham, D. S. Conklin, G. J. Hannon, M. A. Kay, Nature 2002, 418, 38; f) S. I. Pai, Y. Y. Lin, B. Macaes, A. Meneshian, C. F. Hung, T. C. Wu, Gene Ther. 2006, 13, 464. [2] J. Soutschek, A. Akinc, B. Bramlage, K. Charisse, R. Constien, M. Donoghue, S. Elbashir, A. Geick, P. Hadwiger, J. Harborth,
© 2011 Wiley-VCH Verlag GmbH & Co. KGaA, Weinheim
small 2011, 7, No. 5, 568–573
Cytosolic Delivery of siRNA Using HDL-Mimicking Nanoparticles
[3] [4]
[5] [6]
[7]
[8]
[9] [10]
M. John, V. Kesavan, G. Lavine, R. K. Pandey, T. Racie, K. G. Rajeev, I. Rohl, I. Toudjarska, G. Wang, S. Wuschko, D. Bumcrot, V. Koteliansky, S. Limmer, M. Manoharan, H. P. Vornlocher, Nature 2004, 432, 173. B. R. Meade, S. F. Dowdy, Adv. Drug Deliv. Rev. 2007, 59, 134. E. Song, P. Zhu, S. K. Lee, D. Chowdhury, S. Kussman, D. M. Dykxhoorn, Y. Feng, D. Palliser, D. B. Weiner, P. Shankar, W. A. Marasco, J. Lieberman, Nat. Biotechnol. 2005, 23, 709. J. H. Lee, K. Lee, S. H. Moon, Y. Lee, T. G. Park, J. Cheon, Angew. Chem. Int. Ed. 2009, 48, 4174. a) S. H. Kim, J. H. Jeong, S. H. Lee, S. W. Kim, T. G. Park, J. Control. Release 2008, 129, 107; b) J. Y. Pille, H. Li, E. Blot, J. R. Bertrand, L. L. Pritchard, P. Opolon, A. Maksimenko, H. Lu, J. P. Vannier, J. Soria, C. Malvy, C. Soria, Hum. Gene Ther. 2006, 17, 1019; c) L. Qi, X. Gao, ACS Nano 2008, 2, 1403; d) W. J. Song, J. Z. Du, T. M. Sun, P. Z. Zhang, J. Wang, Small 2010, 6, 239. a) H. Lee, S. I. Kim, D. Shin, Y. Yoon, T. H. Choi, G. J. Cheon, M. Kim, Biochem. Biophys. Res. Commun. 2009, 378, 192; b) J. Yano, K. Hirabayashi, S. Nakagawa, T. Yamaguchi, M. Nogawa, I. Kashimori, H. Naito, H. Kitagawa, K. Ishiyama, T. Ohgi, T. Irimura, Clin. Cancer Res. 2004, 10, 7721. a) T. P. Chendrimada, R. I. Gregory, E. Kumaraswamy, J. Norman, N. Cooch, K. Nishikura, R. Shiekhattar, Nature 2005, 436, 740; b) C. Matranga, Y. Tomari, C. Shin, D. P. Bartel, P. D. Zamore, Cell 2005, 123, 607. J. Heyes, L. Palmer, K. Bremner, I. MacLachlan, J. Control. Release 2005, 107, 276. T. Endoh, T. Ohtsuki, Adv. Drug Deliv. Rev. 2009, 61, 704.
small 2011, 7, No. 5, 568–573
[11] R. Suzuki, T. Takizawa, Y. Negishi, K. Hagisawa, K. Tanaka, K. Sawamura, N. Utoguchi, T. Nishioka, K. Maruyama, J. Control. Release 2007, 117, 130. [12] G. B. Braun, A. Pallaoro, G. Wu, D. Missirlis, J. A. Zasadzinski, M. Tirrell, N. O. Reich, ACS Nano 2009, 3, 2007. [13] S. Oliveira, M. M. Fretz, A. Hogset, G. Storm, R. M. Schiffelers, Biochim. Biophys. Acta 2007, 1768, 1211. [14] Z. Zhang, W. Cao, H. Jin, J. F. Lovell, M. Yang, L. Ding, J. Chen, I. Corbin, Q. Luo, G. Zheng, Angew. Chem. Int. Ed. 2009, 48, 9171. [15] Z. Zhang, J. Chen, L. Ding, H. Jin, J. F. Lovell, I. R. Corbin, W. Cao, P. C. Lo, M. Yang, M. S. Tsao, Q. Luo, G. Zheng, Small 2010, 6, 430. [16] S. Acton, A. Rigotti, K. T. Landschulz, S. Xu, H. H. Hobbs, M. Krieger, Science 1996, 271, 518. [17] W. V. Rodrigueza, S. T. Thuahnai, R. E. Temel, S. Lund-Katz, M. C. Phillips, D. L. Williams, J. Biol. Chem. 1999, 274, 20344. [18] C. Wolfrum, S. Shi, K. N. Jayaprakash, M. Jayaraman, G. Wang, R. K. Pandey, K. G. Rajeev, T. Nakayama, K. Charrise, E. M. Ndungo, T. Zimmermann, V. Koteliansky, M. Manoharan, M. Stoffel, Nat. Biotechnol. 2007, 25, 1149. [19] M. Yang, J. Chen, W. Cao, L. Ding, K. K. Ng, H. Jin, Z. Zhang, G. Zheng, unpublished. [20] M. Saad, O. B. Garbuzenko, T. Minko, Nanomedicine (Lond.) 2008, 3, 761. [21] C. J. Schroter, M. Braun, J. Englert, H. Beck, H. Schmid, H. Kalbacher, J. Immunol. Methods 1999, 227, 161.
© 2011 Wiley-VCH Verlag GmbH & Co. KGaA, Weinheim
Received: September 8, 2010 Revised: November 5, 2010 Published online: January 27, 2011
wileyonlinelibrary.com
573