Efficient Rule Discovery in a Geo-spatial Decision Support System∗ Sherri Harms Computer Science & Information Systems University of Nebraska – Kearney Kearney, NE 68849
[email protected]
Dan Li Jitender Deogun Computer Science & Engineering University of Nebraska – Lincoln Lincoln, NE 68588 {dli, deogun}@cse.unl.edu
Tsegaye Tadesse National Drought Mitigation Center University of Nebraska – Lincoln Lincoln, NE 68588
[email protected]
Abstract This paper describes the application of data mining techniques in a Geo-spatial Decision Support System, which focuses on drought risk management. Association rule discovery is one of the widely used approaches in data mining. This paper highlights the rule discovery algorithms that we have developed and used for discovering useful patterns in ocean parameters and climatic indices to monitor drought.
1. Introduction The emergence of remote sensing, scientific simulation, telescope scanning, and other survey technologies has dramatically enhanced our capabilities to collect spatial-temporal data. However, this explosive growth in data makes the management, analysis and use of data much more difficult and expensive. At the same time, large quantities of valuable information are hidden in the data. This forces scientists to explore and analyze data by automatic or semi-automatic means for discovering the meaningful patterns and rules hidden in the data. Data mining techniques were developed to achieve these goals. It draws ideas from machine learning, pattern recognition, statistics, database systems, and data visualization. As part of an NSF supported Digital Government Research project, we are developing a Geospatial Decision Support System (GDSS), with an initial focus on drought risk management. One of our project objectives is to discover human-interpretable patterns and rules associated with ocean parameters, atmospheric indices and climatic data. As a major step in Knowledge Discovery in Database (KDD), data mining techniques are applied to meet our goal. The rest of this paper is organized as follows. In Section 2, we discuss the objectives of the project, and explain why data mining technique can be applied to our system. Some basic data ∗
This research was supported in part by NSF Digital Government Grant No. EIA-0091530 and NSF EPSCOR, Grant No. EPS-0091900.
mining concepts are introduced in Section 3. In Section 4, we discuss how data mining algorithms are applied to our project to find association rules. Experimental results are shown in Section 5. We mainly focus on the measures of interestingness of association rules and the efficiency of the algorithms. Finally, concluding remarks along with directions for future research are presented in Section 6.
2. Objectives Nationally, drought events are the dominant cause of crop loss. The Federal Emergency Management Agency reported the annual cost of drought as between $6 to 8 billion, which is much more than for any other natural hazard. Yet, the US does not have a comprehensive drought monitoring system or a national drought policy that emphasizes risk management by promoting the development of drought plans at all levels of government. Consequently, our overall goal is to develop a well-designed decision support system for effective management of drought risk. The system focuses on the information needs of the user, and provides users with critical ongoing information for drought management. Data mining provides an excellent tool for solving drought management problems. It uses sophisticated statistical analysis and modeling techniques to uncover predictive and descriptive patterns and relationships hidden in organizational databases. It can help us build abstract models to represent the reality and to support decision making. Therefore, the successful completion of this project will help the USDA Risk Management Agency (RMA) integrate advanced geospatial applications into their operations. As a result, our project will help a government agency become much more efficient and responsive to drought risk management.
3. Preliminaries 3.1
Events and Episodes
We view the drought-related data as event sequences. An event sequence is a collection of timeordered events that happen within a finite time period. For example, {1.24, 1.15, 0.91, 1.05, 1.46, 1.56, −0.18, 0.17, 0.04, −0.19, −0.54, −0.43} is an event sequence which presents the twelve-month Standardized Precipitation Index (SPI) value from January to December in 1999 at Clay Center, Nebraska. We are interested in finding events that occur close enough in time. The time interval within which the events occur is called a sliding window. The width of the sliding window determines the length of time interval. In our system, the value of window width is specified by the user so that the user can control the closeness of events. In the previous example, {1.24, 1.15, 0.91, 1.05} and {1.15, 0.91, 1.05, 1.46} are two event sequences with window width of 4 (months). An episode is a collection of events in a particular order occurring within a given window width (Mannila et al. 1997, Harms et al. 2001a). An episode is said to be serial if the predicates of each event have a fixed order. An episode is parallel if the order of events is not specified. The frequency of an episode is defined as the fraction of windows in which the episode occurs. By setting the frequency threshold, we can get a set of episodes which are interesting to users.
3.2
Association Rules
Given a set of episodes, each of which contain some number of events from a given dataset, association rule discovery is to produce dependency rules which will describe the occurrence of an episode based on occurrences of other episodes. Normally, the rules have the form of X ⇒ Y , where X is antecedent episode, Y is the consequent episode, and X ∩ Y = ∅. Support and confidence are two widely used metrics in measuring the interestingness of association rules. The support of a rule X ⇒ Y is denoted by sup(X ⇒ Y ). It indicates the percentage of episodes in the dataset that contain both X and Y . We can see that support is simply a measure of its statistical significance (Harms et al. 2001a). We use conf (X ⇒ Y ) to denote the possibility that an episode contains Y given that it contains X. It is defined as conf (X ⇒ Y ) = sup(X ⇒ Y )/sup(X).
3.3
Association Rules in Drought Risk Environment
As described in Section 2, our objective is to develop a decision support system for effective management of drought risk. Our goal, therefore, in this project is to find a set of association rules with a pre-specified support and confidence as applied to ocean and climatic data. We are looking for patterns where one episode in a time series is connected to another episode in that series, or patterns where one episode in a time series is connected to another episode in another series. The data that are used in this research are collected from a variety of sources: - Precipitation, temperature, and soil moisure data from High Plains Reginal Climate Center (HPRCC); - Standardized Precipitation Index (SPI) data from the National Drought Mitigation Center (NDMC); - Palmer Drought Severity Index (PDSI) values at a station level are calculated using station data from the HPRCC; - The Pacific Decadal Oscillation (PDO) Index and Pacific/North American (PNA) Index from the Joint Institute for the Study of the Atmosphere and Ocean (JISAO), NOAA and University of Washington; - The Southern Oscillation Index (SOI) and the Multivariate ENSO Index (MEI) from Climate Prediction Center, NOAA.
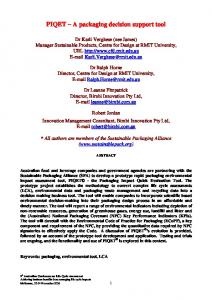
Figure 1 shows the association between the value of MEI and SPI12 for 1999 at Clay Center, Nebraska. As can be seen, MEI and SPI12 share the same trend of variation. Therefore, we could expect some association rules that indicate this relationship between ocean data and climatic data.
4. Methodologies The association rule discovery problem is still a topic of intense research, however, in recent years, many efficient algorithms have been developed. We developed new algorithms by introducing new features that are most beneficial to the application under consideration.
4.1
Representative Association Rules
Given a dataset with m events, the number of possible association rules can be O(m2m−1 ). The problem of analyzing and identifying interesting rules becomes difficult as the number of rules increases (Harms et al. 2001a). One approach to reduce the number of association rules is to set
Figure 1: Relationship between MEI and SPI12 data. tight thresholds for the frequency and confidence measures. Another approach is based on the development of representative association rules. This approach consists of generating a minimal set of association rules from which all association rules can be generated (Harms et al. 2001a). The guiding principle of our algorithm lies in the “downward-closed” property of support and confidence, which means every subepisode is at least as frequent as its superepisode (Mannila et al. 1995). Based on this idea, the candidate episodes having k events can be generated by joining frequent episodes having k − 1 events, and deleting those that contain any subset that is not frequent. This algorithm uses only a subset of the set of frequent episodes, called frequent closed episodes. This results in a reduction of the input size and in the faster generation of the representation association rules.
4.2
Constraint-based Association Rules
Since the overall goal of our system is to manage drought risk, drought-monitoring experts are particularly interested in drought-relevant rules. However, by nature, droughts occur infrequently. That means a huge number of rules are irrelevant to drought. Constraint-based data mining method is applied to our system to provide user specified target episodes quickly and without the distractions of the other non-interesting rules. As mentioned in (Harms et al. 2001b), the data for the oceanic and climatic indices are grouped into seven categories. To explore drought-relevant episodes, we set the constraints to the first three drought categories. Additionally, users are interested in rules which reflect the influence of ocean parameters (e.g. PDO, SOI, MEI) upon climatic and drought indices (e.g. SPI, PDSI). Therefore, we take ocean parameters as antecedent constraints, and take climatic and drought indices as consequent constraints.
4.3
Time Lag
Sometimes events that occur at one timestamp are associated with events that occur at future timestamps. For example, it may be several months after an El Nino episode before the impact is felt in the Northeastern United States. Therefore, it is meaningful to take the time lag into consideration when we explore association rules between ocean parameters and climatic indices.
To implement this, we use two sliding windows. One is for the events in the antecedent set, and the other is for the events in the consequent set. The offset between these two windows is user specified time lag value.
4.4
J-measure
Development of good measures of interestingness of discovered patterns is one of the significant problems in the field of knowledge discovery (Silberschatz and Tuzhilin 1995). As mentioned in the previous section, support and confidence are two typical objective measures in finding the interestingness of rules. By setting the threshold of these two measures high enough, we can prune association rules. However, the problem with this method is that such pruning can lose important information (Klemettine 1999), because they do not take into account the frequency of right-hand side of a rule. Another objective measure, named as J-measure, was introduced by Smyth in (Smyth and Goodman 1992). The formulation of the J-measure takes into consideration both frequencies of the left and right sides of a rule. Therefore, it not only favors rules that occur more frequently, but also provides a more complex metric for ranking rules in a manner such that the user can trade-off rule support and rule confidence.
5. Experimental Results Results shown in this section are based on the experiments on the dataset for Clay Center, Nebraska, from 1950 to 1999. The data has been normalized and discretized to user defined categories. Table 1 shows several sample constraint-based association rules.1 For example, we can explain the first rule as: If the SOI is moderately dry, PDO is moderately dry to severely dry, then within time lag period (2 months), the six-month SPI and one-month SPI is moderately dry with 65% confidence; The episode {(33, 44, 45) lag2 (10, 3)} appears 13 times in the whole dataset, while the episode {33, 44, 45} occurs 20 times. Rules 33, 44, 45 ⇒ 10, 3 33, 38, 45 ⇒ 10, 3 33, 38, 45 ⇒ 3 33, 38 ⇒ 17, 24 33 ⇒ 10
Confidence 0.65% 0.46% 0.64% 0.38% 0.52%
Support 13 13 18 20 49
Coverage 20 28 28 53 95
J-measure 0.06269 0.05210 0.07648 0.05725 0.10198
Table 1: Sample rules. Next, we want to show how the number of association rules can be influenced by input metrics. It is obvious that, the higher the value of frequency and confidence threshold, the fewer the number of rules. Also, the number of rules is proportional to the width of sliding window. Figure 22 shows these results in (a), (b), and (c). What is worth to mention is that, the frequency threshold has a much stronger effect than the confidence threshold. Therefore, to get a reasonable number of rules, we could apply frequency threshold first to sharply prune the number of episodes, then apply 1 The result shown in Table 1 is based on the following input parameters: frequency threshold = 12; confidence threshold = 0.25; antecedence window size = 3; consequence window size = 4; time lag = 2; episode type = parallel. 2 Input parameters for (a) and (b) are the same as parameters used in Table 1. Input parameters for (c) are: frequency threshold = 12; confidence threshold = 0.7; episode type = parallel. Input parameters for (d) are: frequency threshold = 12; window width = 3; episode type = parallel. Time lags were not used in (c) and (d).
confidence threshold to prune the number of rules for fine tuning. In Figure 2 (d), the solid line presents the number of all drought-relevant association rules, while the dashed line indicates the number of representative drought-relevant association rules.
Figure 2: Influence on the number of rules by the confidence threshold, the frequency threshold, the window width, and representative association rules
Figure 3 shows the comparison between confidence and J-measure for all the drought-relevant rules generated as in Table 1. One can see a similar, but fuzzier tendency between confidence and J-measure. The rule in the fifth tuple of Table 1 shows that sometimes the value of J-measure could be relatively high although the confidence is relatively low. This happens because the frequency of rule right-hand side adds to the value of J-measure, but it does not affect the value of confidence.
6. Conclusions and Future Work Knowledge discovery is one of the most active aspects in the information processing field. This paper mainly focuses on how data mining techniques have been applied and extended to our Geo-spatial Decision Support System. We have shown that the number of rules can be dramatically pruned by discovery of representative rules and by setting reasonable thresholds for different interestingness measures. The discovered rules could help us to predict user specified target episodes. This in turn helps decision makers to effectively analyze drought situations, and thus, to monitor the loss caused by drought. This research can be extended in several directions. Instead of using sliding window to find rules for the whole period, we plan to expand our work to discover specified seasonal rules. Also, interpolating existing rule sets to get rules for areas between weather stations can make our spatiotemporal data mining more interesting and meaningful to a broader geographical area.
Figure 3: A comparison between confidence and J-measure.
References S. Harms, J. Deogun, J. Saquer, and T. Tadesse. Discovering representative episodal association rules from event sequences using frequent closed episode sets and event constraints. In Proceedings of the 2001 IEEE International Conference on Data Mining, pages 603–606, San Jose, California, USA, November 29 - December 2 2001a. S. Harms, S. Goddard, S. E. Reichenbach, W. J. Waltman, and T. Tadesse. Data mining in a geospatial decision support system for drought risk management. In Proceedings of the 2001 National Conference on Digital Government Research, pages 9–16, Los Angelos, California, USA, May 2001b. M. Klemettine. A Knowledge Discovery Methodology for Telecommunication Network Alarm Databases. PhD thesis, Department of Computer Science, University of Helsinki Finland, January 1999. Series of Publications A, Report A-1999-1. H. Mannila, H. Toivonen, and A. I. Verkamo. Discovering frequent episodes in sequences. In Proceedings of the First International Conference on Knowledge Discovery and Data Mining [KDD 95], pages 210–215, Montreal, Canada, August 1995. H. Mannila, H. Toivonen, and A. I. Verkamo. Discovery of frequent episodes in event sequences. Technical report, Department of Computer Science, University of Helsinki, Finland, 1997. Report C-1997-15. A. Silberschatz and A. Tuzhilin. On subjective measures of interestingness in knowledge discovery. In Proceedings of the First International Conference on Knowledge Discovery and Data Mining [KDD 95], pages 275–281, Montreal, Canada, August 1995. P. Smyth and R. M. Goodman. An information theoretic approach to rule induction from databases. IEEE Transactions on Knowledge and Data Engineering, 4(4):301–316, August 1992.