electronic reprint Journal of
Applied Crystallography ISSN 0021-8898
Editor: Anke R. Pyzalla
Management of metadata and automation for mail-in measurements with the APS 11-BM high-throughput, high-resolution synchrotron powder diffractometer Brian H. Toby, Yu Huang, Don Dohan, David Carroll, Xuesong Jiao, Lynn Ribaud, Jennifer A. Doebbler, Matthew R. Suchomel, Jun Wang, Curt Preissner, David Kline and Tim M. Mooney
J. Appl. Cryst. (2009). 42, 990–993
c International Union of Crystallography Copyright !
Author(s) of this paper may load this reprint on their own web site or institutional repository provided that this cover page is retained. Republication of this article or its storage in electronic databases other than as specified above is not permitted without prior permission in writing from the IUCr. For further information see http://journals.iucr.org/services/authorrights.html
Many research topics in condensed matter research, materials science and the life sciences make use of crystallographic methods to study crystalline and non-crystalline matter with neutrons, X-rays and electrons. Articles published in the Journal of Applied Crystallography focus on these methods and their use in identifying structural and diffusioncontrolled phase transformations, structure–property relationships, structural changes of defects, interfaces and surfaces, etc. Developments of instrumentation and crystallographic apparatus, theory and interpretation, numerical analysis and other related subjects are also covered. The journal is the primary place where crystallographic computer program information is published.
Crystallography Journals Online is available from journals.iucr.org J. Appl. Cryst. (2009). 42, 990–993
Brian H. Toby et al. · Management and automation of APS 11-BM
research papers Journal of
Applied Crystallography ISSN 0021-8898
Received 13 May 2009 Accepted 3 September 2009
Management of metadata and automation for mail-in measurements with the APS 11-BM highthroughput, high-resolution synchrotron powder diffractometer Brian H. Toby,a* Yu Huang,a Don Dohan,b David Carroll,a,c Xuesong Jiao,a Lynn Ribaud,a Jennifer A. Doebbler,a Matthew R. Suchomel,a Jun Wang,d Curt Preissner,a David Klinea and Tim M. Mooneya a
Advanced Photon Source, Argonne National Laboratory, IL 60439, USA, bNational Synchrotron Light Source-II, Brookhaven National Laboratory, Upton, NY 11973, USA, cMaplebrook Elementary School and Madison Junior High School, District 203, Naperville, IL 60540, USA, and dNational Synchrotron Light Source, Brookhaven National Laboratory, Upton, NY 11973, USA. Correspondence e-mail:
[email protected]
# 2009 International Union of Crystallography Printed in Singapore – all rights reserved
A high-resolution and high-throughput synchrotron powder diffractometer has been automated for use with samples that are mailed in by Advanced Photon Source users. Implementation of a relational database with web interfaces for both outside users and beamline staff, which is integrated into the facility-wide proposal and safety system, allows all aspects of beamline management to be integrated. This system permits users to request kits for mounting samples, to provide sample safety information, to obtain their collected data and to provide usage information upon project completion in a quick and simple manner. Beamline staff use a separate interface to note receipt of samples, schedule and collect diffraction data, post-process and quality-check data, and dispose of samples. The design of the software and database are discussed in detail.
1. Introduction The 11-BM diffractometer at Argonne National Laboratory’s Advanced Photon Source (APS) provides routine access to the highest-resolution routine powder diffraction capabilities (!Q/Q < 2 ! 10"4) in the USA. Measurement of a complete high-resolution powder diffraction data set typically requires a scan of only one hour in length. Likewise, access to the instrument is intended to occur with minimal delay. To encourage broad use of the instrument and reach users who are not experienced with synchrotrons, the first deployment goal for the instrument has been to support mail-in access. This article describes the implementation developed to support a mail-in program that provides streamlined access to users with minimal demands on staff to support the program. This has required considerable attention towards computer automation for numerous routine sample and user support tasks, such as sample receipt, completion of safety forms, user correspondence, data reduction and consistency checking, sending and on occasion resending data to users, sample return/disposal, and tracking of publications. It is sobering to note that, at the intended operational throughput if all these tasks required on average only one hour per sample, approximately four full-time staff members would be required. Thus, management of samples and their associated information is a crucial aspect of the instrument design.
990
doi:10.1107/S0021889809035717
Robotically equipped synchrotron beamlines have become common in macromolecular crystallography (Hiraki et al., 2008; Miller et al., 2004; Shu et al., 2004; Wang et al., 2007) and are starting to be implemented for other types of measurements (Round et al., 2008). Robot-equipped high-resolution powder diffraction beamlines have also been implemented at the ESRF and Diamond facilities (Tang et al., 2007; Hodeau et al., 1998) and one is planned as an addition to the powder diffraction beamline in Australia (Wallwork et al., 2006). However, outside of macromolecular crystallography, we are not aware of any work to automate the tracking of samples, users’ files etc. for support of mail-in data collection (Okazaki et al., 2008; Ueno et al., 2004). 1.1. Instrumentation description
The 11-BM optics have been described elsewhere (Wang et al., 2008). Detection is performed using 12 perfect singlecrystal analyzers in a locally designed detector (Lee et al., 2008). A Mitsubishi robotic arm with a custom-designed finger set is used to mount and dismount samples on the diffractometer (Preissner et al., 2010). An Oxford Cryosystems Cryostream Plus (formerly model 700+) cooling device is integrated with the robot, so that sample temperatures can be controlled over the range 80–500 K. The diffractometer is controlled via the experimental physics industrial control
electronic reprint
J. Appl. Cryst. (2009). 42, 990–993
research papers system (EPICS; Dalesio et al., 1994) running in a VME crate dedicated to each radiation enclosure and an EPICS brick (http://www.aps.anl.gov/bcda/ebrick/) serving as a dedicated interface to the robotic system. 1.2. Sample mounting
To facilitate these high-throughput measurements, the diffractometer is equipped with a magnetic mount that accommodates a standard single-crystal mounting base supplied by Hampton Research (HT model CrystalCap). Slight customization is required for this application: the bases are usually supplied with a metal sleeve, which in turn holds a metal pin and cryoloop for single-crystal support, but we obtain bases with a hole matched to fit a 0.8 mm internal diameter polyimide capillary sample mounting tube. The magnetic mount can be spun with high velocity (typically 5400 r min"1 or greater), but there are no provisions for centering the sample should the capillary alignment be imperfect. Each base has a unique identification number, printed on the side of the base and as a dot matrix barcode underneath the base. Considering the small size of each sample, it is difficult to imagine labeling each with chemical, hazard and ownership information. Instead, a database tracks this information using the unique barcode number on each sample base.
2. Software design goals The APS already manages two key systems for tracking use of the experimental facilities: the general user proposal (GUP) system and the experiment safety approval form (ESAF) system. The GUP system requires potential users to provide demographic information about the experiment participants, as well as describe the measurement they want to perform. These proposals are reviewed and are prioritized by an external committee. The ESAF system is used to manage hazards associated with measurements. The information in each of these systems is maintained in separate Oracle data structures; users typically populate these databases via webbased interface forms. As will be described herein, a separate database and set of interfaces has been implemented for the management of sample and data collection information particular to 11-BM. Design goals for this system included the following: (1) Users interface with the sample management system via web browsers and e-mail. (2) Information about samples and experiments should be protected; to avoid use of passwords, nontrivial sample metadata will be reported only to users at their registered e-mail addresses. (3) Sample base barcode ID and e-mail address are used for database retrievals. (4) Users and staff should never input metadata more than once. (5) Protection of users and staff from hazards is the highest priority. J. Appl. Cryst. (2009). 42, 990–993
3. 11-BM sample workflow Access to 11-BM starts with the user submitting a proposal via the GUP system, as described above. The beamline-specific workflow then consists of the following steps: (1) request of sample mounting kits by users and subsequent cataloging of their barcode numbers to proposals and user e-mail addresses; (2) user input of sample information, including hazards; (3) receipt of samples; (4) collection of data; (5) instrument calibration; (6) data reduction; (7) data retrieval by users; (8) short-term sample storage; (9) disposal or return of samples; (10) tracking of user productivity. All of these tasks are highly automated and designed to require a minimum amount of both operator and user time. For example, sample receipt (step 3) is performed simply by scanning the sample’s barcode; the software then checks if the user has completed the previous step. If so, an e-mail noting sample receipt is automatically sent to the user. If not, a reminder e-mail is generated. Another novel aspect of this procedure is that users are able to provide data collection specifications in step 2, so that instrument operators are freed from the task of inputting this information to the instrument later. At present, users can select only the data collection temperature from the web interface, but we plan to offer more options at a later date. Reminders that prompt users to track the status of their data analysis will facilitate the collection of citation information necessary for documentation of the utility of the instrument. Further details on each step are included in document S1 in the supplementary material.1
4. Robot/instrument control implementation The automation of data collection on 11-BM was coded in Python, accessing sample metadata via mySQL and using channel access to drive the EPICS interface. When samples are loaded onto the instrument, a schedule for data collection is constructed by having the robot pick up and scan the barcode for each sample. The automation code queries the sample database to ensure that ESAF (safety) approval is complete and to determine the uncompleted data collection condition(s) for each sample. The schedule is displayed to the operator in a table, which includes the estimated time when measurement of each data set will be completed. Since all sample-related data collection parameters are obtained from the sample database, instrument scheduling is largely an automatic process. However, the operator can modify the data collection schedule and can insert additional data collection steps, including monochromator optimization and recalibration. Once the experimental schedule is acceptable, the operator initiates data collection. The steps used in data collection are summarized in document S2 in the supplementary material. The process of scanning barcodes for each sample before data collection potentially wastes some instrument time, since 1
Supplementary material is available from the IUCr electronic archives (Reference: HX5092). Services for accessing this material are described at the back of the journal. Brian H. Toby et al.
electronic reprint
#
Management and automation of APS 11-BM
991
research papers the robot loads each sample twice: once for scheduling and once for data collection. However, performing the barcode scan allows the schedule to be viewed and modified before initiating data collection, allowing schedule optimization. Furthermore, database access is required only for the short period of time when the experimental schedule is created. Should a database server fail, data collection can continue uninterrupted. It is even possible to collect data manually while the sample scan is in progress, so very little time need be wasted.
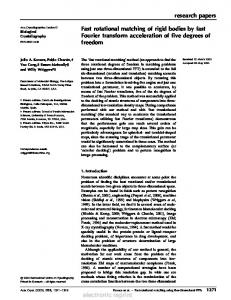
The database consists of a number of interconnected tables, as diagrammed in Fig. 1. The tables and their most significant fields are described below. A full list of all fields in each table is provided in supplementary Table S1. For greater clarity, table names in the database are displayed in bold face, while italics refer to field names within these tables.
links to the sample table using the field sample_id and to the user table with the field user_id. To track changes to the sample information, entries are placed in the sample_event table when significant changes are made to sample information. The field sample_id links entries between these tables. The proposal_request table is used to track the number of sample bases (field no_of_samples) requested for a particular proposal, specified in the field proposal_number. This field links again to the GUP database. The last_sample_event_type field in the samples table has a code that indicates the current status of a sample. This status tracks when a sample is first logged into the system, before any metadata has been entered. It then advances to registered, received, collected, processed etc. as it progresses through the workflow. This field can be used to record the final utility of the data (paper submitted, published, abandoned . . . ) and thus provide feedback on data and sample quality as well as instrument effectiveness.
5.1. Sample/user information
5.2. Data collection information
5. Database design
Sample information is contained in the sample table. It is expected that there will be an entry in this database for every specimen submitted for mail-in processing on 11-BM. The proposal_number and ESAF_number fields serve as links into the GUP and the ESAF databases, respectively. The bar_ code_id field holds the barcode number from a sample base. The user table tracks e-mail addresses for users. This means that all references to an e-mail address can be updated with a single edit. At present, e-mail addresses are the only information tracked for a user, with all other information (such as mailing address) found from within the GUP database. To allow a many-to-many relationship between sample entries and e-mail addresses, a cross-reference table, sample__user,
The run_request table tracks data collection parameters for each sample and links to the sample table using the sample_id field. The entries for data collection parameters define conditions such as scan range, speed and data collection temperature. A single run-request allows the sample to be scanned multiple times – optionally with a sample translation after each scan to present fresh material to the beam. This is valuable for some materials, typically organic chemicals, where beam exposure causes decay in the diffraction pattern. The database allows multiple run_request entries for a single sample, so that a particular sample may have data collected with multiple collection conditions. The status field is changed after data collection to indicate that a request has been satisfied and should not be repeated if the sample is returned to the diffractometer. The run_data table lists the data files that were collected for an entry in the run_request table. The run_data table links to the run_request table via the field run_request_id, which allows multiple files to be associated with a single run request. Multiple files will arise when multiple scans are requested for a datafile. An operator can initiate re-collection of data by reseting the run_request status flag should there be evidence for an instrument problem (such as sample icing). Alternatively, when the synchrotron beam fails during data collection, the measurement cannot be resumed at the point where the X-ray flux stopped. Such runs are Figure 1 automatically repeated once the X-ray Entity-relationship diagram for the 11-BM sample database. The diagram has been simplified by intensity returns. Fields in the run_data inclusion of only those fields that interlink tables. The shaded tables are included in the 11-BM mailtable record the start and stop time for in data collection process. The GUP and ESAF systems are implemented facility-wide within the APS. data collection, intended to track
992
Brian H. Toby et al.
#
Management and automation of APS 11-BM
electronic reprint
J. Appl. Cryst. (2009). 42, 990–993
research papers instrument usage. Finally, the names of processed files from calibrations are recorded in the run_data table. 5.3. Data processing/transmission information
As data are post-processed, an entry is created in the process_data table. This specifies the file name of the resulting data file (field data_file_name) as well as a code that specifies the type of file that is cataloged (for example, a pointer to the calibration data set or a merged GSAS file) in the field file_ type_code. The file creation time is time-stamped and the fields run_data_id and run_request_id serve to link records to the parent entries in the run_data and run_request tables. As described above, when a request is made to retrieve data, an entry is placed in the send_data_request table. A unique code is assigned to each request and is stored in the field send_hashcode. The send_type_code field documents how the user has requested that the files are to be made available (posted on an anonymous FTP site or sent via e-mail). The IP address from where the request was posted is stored in the field request_ip, for potential security use, and a status field, send_status, is initially set as 0. Files are not actually made available until a separate web page is retrieved using the unique code in the field send_hashcode. This causes send_ status to be set to 1, which indicates that the request is ready to be processed by an automatically scheduled task. Each file that is requested for transmission is listed in the send_data_files table. The field send_id links each entry to its parent request in the send_data_request table. In addition, the process_data_id field links the entry to a file listed in the process_data table and the run_data_id field links the processed file to the parent entry in the run_data table. 5.4. Publication information
The pubinfo table is used to store information on publications, which are stored in the citation field, and/or reported sample or instrumental problems, which are stored in the dataproblems field. Entries are time stamped using the pub_event_time field and submission IP addresses are stored in the pub_ip field. There is a many-to-many relation between pubinfo and sample records, supported by the pointer fields sample_id and pubinfo_id in table sample__pubinfo, since one publication notification may apply to many measurements. Likewise, users will probably provide new pubinfo records as their publications progress through the editorial process. 5.5. Sample disposal
The containers used for disposal of samples are tracked in the disposal_container table. The container_label field defines the name of the container and the container_type field defines the hazard classification for the contents. The container_status field is used to indicate if the container will be used for disposal of more samples. When closed, the software will not allow further additions to the inventory. Samples that are disposed of are tracked in the disposal_log table. This table consists of pointers to the sample and disposal_container tables, the fields sample_id and container_id, respectively, and a timestamp, disp_event_time. J. Appl. Cryst. (2009). 42, 990–993
6. Conclusions The relatively complex system of computer programs and database tables described here creates a diffraction automation environment that simplifies the process of mail-in powder diffraction measurements, from the perspective of both the users of these services and the staff who operate the facility. The extensive use of barcode scanners and database implementations allows information to flow though the experimental process, starting with experiment proposal, through data collection, data processing and exporting, to disposal of samples, and even tabulation of experimental impact. This flow of information reduces the administrative demands on everyone. The authors would like to thank a number of Argonne staff members who were responsible for the proposal, design, construction and commissioning of the diffractometer: Peter Lee, John Mitchell, Robert Von Dreele, Mark Beno, Deming Shu, Mohan Ramanthan and the late Jim Jorgensen. We also appreciate assistance and advice from APS staff members Pete Jemian, Steve Leatherman and John Quintana.
References Dalesio, L. R., Hill, J. O., Kraimer, M., Lewis, S., Murray, D., Hunt, S., Watson, W., Clausen, M. & Dalesio, J. (1994). Nucl. Instrum. Methods Phys. Res. Sect. A, 352, 179–184. Hiraki, M., Watanabe, S., pHonda, N., Yamada, Y., Matsugaki, N., Igarashi, N., Gaponov, Y. & Wakatsuki, S. (2008). J. Synchrotron Rad. 15, 300–303. Hodeau, J. L., Bordet, P., Anne, M., Prat, A., Fitch, A. N., Dooryhee, E., Vaughan, G. & Freund, A. (1998). Proc. SPIE Int. Soc. Opt. Eng. 3448, 353–361. Lee, P. L., Shu, D., Ramanathan, M., Preissner, C., Wang, J., Beno, M. A., Von Dreele, R. B., Ribaud, L., Kurtz, C., Antao, S. M., Jiao, X. & Toby, B. H. (2008). J. Synchrotron Rad. 15, 427–432. Miller, M. D., Brinen, L. S., Cohen, A., Deacon, A. M., Ellis, P., McPhillips, S. E., McPhillips, T. M., Phizackerley, R. P., Soltis, S. M., van den Bedem, H., Wolf, G., Qingping, X. & Zepu, Z. (2004). AIP Conf. Proc. 705, 1233–1236. Okazaki, N., Hasegawa, K., Ueno, G., Murakami, H., Kumasaka, T. & Yamamoto, M. (2008). J. Synchrotron Rad. 15, 288–291. Preissner, C., Shu, D., Toby, B. H., Lee, P., Wang, J., Kline, D. & Goetze, K. (2010). Nucl. Instrum. Methods Phys. Res. Sect. A. In the press. Round, A. R., Franke, D., Moritz, S., Huchler, R., Fritsche, M., Malthan, D., Klaering, R., Svergun, D. I. & Roessle, M. (2008). J. Appl. Cryst. 41, 913–917. Shu, D., Preissner, C., Nocher, D., Han, Y., Barraza, J., Lee, P., Lee, W. K., Cai, Z., Ginell, S., Alkire, R., Lazarski, K., Schuessler, R. & Joachimiak, A. (2004). AIP Conf. Proc. 705, 1201–1204. Tang, C. C., Thompson, S. P., Hill, T. P., Wilkin, G. R. & Wagner, U. H. (2007). Z. Kristallogr. Suppl. 26, 153–158. Ueno, G., Hirose, R., Ida, K., Kumasaka, T. & Yamamoto, M. (2004). J. Appl. Cryst. 37, 867–873. Wallwork, K. S., Kennedy, B. J. & Wang, D. (2006). AIP Conf. Proc. 879, 879–882. Wang, J., Ogata, C., Yang, X. C., Sukumar, N., Kourinov, I., Capel, M., Lynch, A. E., Rajashankar, K., Withrow, J. & Ealick, S. (2007). AIP Conf. Proc. 879, 832–835. Wang, J., Toby, B. H., Lee, P. L., Ribaud, L., Antao, S., Kurtz, C., Ramanathan, M., Von Dreele, R. B. & Beno, M. A. (2008). Rev. Sci. Instrum. 79, 085105. Brian H. Toby et al.
electronic reprint
#
Management and automation of APS 11-BM
993