Proceedings of International Joint Conference on Neural Networks, Atlanta, Georgia, USA, June 14-19, 2009
Emotion Recognition System Using Brain and Peripheral Signals: Using Correlation Dimension to Improve the Results of EEG z. Khalili 1, M. H. Moradi 1 IBiomedical Engineering Faculty, Amirkabir University of Technology, Tehran, Iran e-mail:
[email protected] Abstract- this paper proposed a multimodal fusion between brain and peripheral signals for emotion detection. The input signals were electroencephalogram, galvanic skin resistance, temperature, blood pressure and respiration, which can reflect the influence of emotion on the central nervous system and autonomic nervous system respectively. The acquisition protocol is based on a subset of pictures which correspond to three specific areas of valance-arousal emotional space (positively excited, negatively excited, and calm). The features extracted from input signals, and to improve the results, correlation dimension as a strong nonlinear feature is used for brain signals. The performance of the Quadratic Discriminant Classifier has been evaluated on different feature sets: peripheral signals, EEG's, and both. In comparison among the results of different feature sets, EEG signals seem to perform better than other physiological signals, and the results confirm the interest of using brain signals as peripherals in emotion assessment. According to the improvement in EEG results compare in each raw of the table, it seems that nonlinear features would lead to better understanding of how emotional activities work. Keywords:Emotion, EEG,p eriphera Isignals.feature, extraction, class ification, correlation dimension
I. INTRODUCTION
E
motions play a powerful role in social influence: certain emotional displays seem designed to elicit particular social responses from other individuals, and arguably, such responses can be difficult to suppress and the responding individual may not even be consciously aware of the manipulation [1]. Emotions also infuse our social relationships. Our interactions with each other are a source of many of our emotions and we have developed both a range of behaviors that communicate emotional information as well as an ability to recognize the emotional arousal in others [2]. A better understanding of this phenomenon would affect in HCI (Human Computer Interaction) field, like the applications that attempt to shape human behavior, such as psychotherapy applications, tutoring systems, and marketing applications. Giving the broad influence that emotions have over behavior, evaluating the effectiveness of such a general architecture presents some unique challenges. Emotional influences are manifested across a variety of levels and modalities. For instance, there are telltale physical signals:
978-1-4244-3553-1/09/$25.00 ©2009 IEEE
facial expressions, body language, and certain acoustic features of speech. There are also influences on cognitive processes, including coping behaviors such as wishful thinking, resignation, or blame-shifting. Unlike many phenomena studied by cognitive scientists, emotional responses are also highly variable, differing widely both within and across individuals depending on non-observable factors like goals, beliefs, cultural norms, etc [1, 2]. The goal of our research is to perform a multimodal fusion between EEG's and peripheral physiological signals for emotion detection. Due to the cognitive theory states that the brain is the centre of emotions. It particularly focuses on the "direct and non reflective" process, called appraisal by which the brain judges a situation or an event as good or bad [6], So to study the brain, we analyze EEG, because it is well known that the variation of the surface potential distribution on the scalp reflects functional and physiological activities emerging from the underlying brain. This surface potential variation can be recorded by affixing an array of electrodes to the scalp and since EEG is noninvasive, inexpensive, and has very high sensitivity to received information and to internal (endogenous) changes of brain state and offers a very high time resolution in the millisecond range, so it is particularly suited for studies on brain mechanisms of cognitive-emotional information processing which occurs in the millisecond range [3]. Peripheral signals which are related to autonomous nervous system and show the physiological changes in emotional states, is analyzed too. Physiological pattern recognition can potentially help in assessing and quantifying emotional states like stress and anger that influence health. Affective states of depression, anxiety, and chronic anger have been shown to impede the work of the immune system, making people more vulnerable to infections, and slowing healing from surgery or disease. Changes in physiological signals can also be examined for signs of stress arising while users interact with the technology, helping detect where the product causes unnecessary irritation or frustration [21]. So investigating Emotions through brain and peripheral signals would be a look at internal aspect of Emotions, since emotion is not just what is displayed. In psychology, an explicit separation is made between the physiological arousal, the behavioral expression (affect) and the conscious experience of an emotion (feeling). Facial expression and voice concern the second aspect of emotion
1571
(the expression) which is consciously adopted, however the physiological signals are spontaneous and less controllable [7]. Emotion recognition is an interesting but difficult task. Previous studies have investigated the use of peripheral and brain signals separately but little attention has been paid so far to fusion between brain and peripheral signals. Analyzing the results of previous works is a difficult task, because to compare the results of the works which attempt to introduce emotion recognition systems as a classification problem, it is important to consider the way that emotions are elicited and the number of participants, the latter is important especially to introduce a user independent system. Although Emotion is a phenomenon that seems completely user independent, the aim of HCI application is performing a user independent system. Good results in user independent systems usually are obtained of protocols which consist of enough participants, to introduce a model which is generalized for this purpose. The type of physiological signals and the time of data recordings, and using predefined labels or self assessment labels which is done by the participants is also important, because emotions are known to be very dependent on past experience, so that one can never be sure whether in data collection the expected emotion is elicited or not. Furthermore about the way to elicit emotions, the subjective stimuli usually have better results than the objective one, audio visual stimuli seems better than pictures too, especially the effect of music to elicit emotional state is well known. Picard and her group at MIT Media Laboratory developed pattern recognition algorithms which attained 78.4% classification accuracy for three categories of emotional states and using peripheral signals Galvanic Skin Resistance, Blood Pressure, Respiration, and Skin Temperature, the stimuli was a combination of music, story and showing images [8]. Kim in [9] also used the combination of music and story as stimuli and there were 50 participants, to introduce a userindependent system, so this good database results 78.4%, 61% for 3 and 4 categories respectively. Music is stimuli in [10] with best result of 88.64% for 6 classes. The database is recorded for one person in 25 sessions repeated. Takahashi in [11] obtained up to 41.7% of well defined patterns for 5 emotions, using film clips as stimuli and SVM as a classifier. Chanel and his cooperators in [12] asks the participants to recall past emotional events, and investigate two different feature sets and obtained the best result 79% using EEG and 53% using peripheral signal for 3 categories, 76% using EEG and 73% using peripheral signals for 2 categories. In [6] IAPS(lnternational Affective Picture System) have been used as stimuli and using self assessment labels for arousal assessment and obtained 55% and 54% for EEG, physiological and fused features respectively.
II. DATA ACQUISITION The database of this work is available on [14]. The eNTERFACE summer workshops, organized by the SIMILAR European Network of excellence. They aim at establishing a tradition of collaborative, localized research and development work by gathering, a group of senior project leaders, and researchers in a single place. Participants are organized in teams, attached to specific proj ects related to multimodal interfaces, working on free software. This data is the 7th project of enterface 2006. The aim of this project was developing techniques for multimodal emotion detection, first modality is brain signals via fNIRS(functional Near Infrared Spectroscopy), the second one is face video and the third modality is the scalp EEG signals. EEG and fNIRS provided us with an "internal" look at the emotion generation processes, while video sequence gave us an "external" look on the "same" phenomenon [15]. In this study we use the third modality that consists peripheral signals which are recorded synchronously with brain signals.
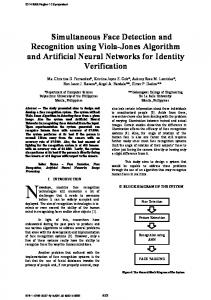
A. Stimuli The stimuli to elicit the target emotions (Calm(C), Positively Excited (PE), and Negatively Excited (NE)) were some images from the lAPS. The images are corresponded to the three emotional classes: calm, exciting positive and exciting negative. This was performed by first selecting pictures from lAPS values and then eliminating particular images based on redundancy or particularity of context (for example erotic images were removed). This selection resulted in 106, 71, and 150 pictures respectively for these classes. Each stimulus consists of a block of 5 pictures, which ensures stability of the emotion over time. Each picture is displayed in 2.5 second leading to a total 12.5 seconds per block. A dark screen precedes each block with a cross in the middle to attract user attention as a trigger for synchronization [15]. The data is acquired from 5 participants, and each participant has three sessions and each session consists of 30 trials. The detail of each trial is shown in figure 1. Dark screen with cross
J
3s
Block of5 images
DIID 12.5s
Dark screen
lOs
Selfassessment
?s
L.
Figure 1. Schedule of each trial
B. Subjects The data is recorded from five participants all male, and right handed, with age ranging from 22 to 38. For each subject data are divided in three repertories, one per session. For each session three file categories are obtained: one concerns EEG and peripheral information, another concerns fNIRS information and the last contains self-assessments of participants.
1572
c.
Procedure
IV PREPROCESSING AND FEATURE EXTRACTION
Due to occlusion from fNIRS sensor arrangement, we had to remove the following ten frontal electrodes: F5, F8, AF7, AF8, AFz, Fpl, Fp2, Fpz, F7, and F6, which left us with 54 channels [15]. So EEG is recorded using 54 electrodes and peripheral sensors are Galvanic Skin Resistance (GSR), Respiration and Temperature. All signals were sampled at 1024 hertz. III.
PHYSIOLOGICAL METRICS
In this section, the physiological measures are briefly introduced and it is described how these measures are collected, their inferred meaning is explained too. The peripheral signals, related to Autonomic Nervous System (ANS), are Galvanic Skin Resistance (GSR), Respiration (RESP), Blood Pressure (BP) and Temperature. The brain signal which is related to Central Nervous System (CNS) is EEG in our study. A. Galvanic Skin Resistance GSR is a measure of the conductivity of the skin. There are specific sweat glands that cause skin conductivity to change and result in the GSR. Located in the palms of the hands and soles of the feet, these sweat glands respond to psychological stimulation rather than simply to temperature changes in the body [16]. GSR was recorded by positioning two dedicated electrodes on the top of left index and middle fingers [15]. B. Respiration Respiration was recorded by using a respiration belt, providing the chest cavity expansion over time [15]. C. Blood Pressure
Blood Pressure is a cardiovascular measure. The cardiovascular system including the organs that regulate blood flow through the body. Measures of cardiovascular activity include Blood Pressure is concerned in this study [16]. A plethysmograph was placed on the thumb of the participant to record blood volume pressure [15]. D. Temperature Skin temperature simply describes the temperature as measured on the surface of the skin. Since muscles are tense under strain, the blood vessels will be contracted and therefore the temperature will decrease [17]. E. Electroencephalogram (EEG) Scalp potentials, measured by an electroencephalograph (EEG), are rich in information about brain activity, and proper signal processing would allow us to collect global information about mental activities and emotional states [18]. In this study, EEG is recorded using the Biosemi Active 2 acquisition system with 64 EEG channel. Due to occlusion from fNIRS sensor arrangement, we had to remove the following ten frontal electrodes: F5, F8, AF7, AF8, AFz, Fpl, Fp2, Fpz, F7, and F6, which left us with 54 channels [15].
Prior to analyze physiological, data it is necessary to preprocess signals and extract features that are known to be related to emotion activation. A. Peripheral signals All signals were first filtered by a moving average filter to remove noise. For this purpose we used filters of length 512 for GSR, 128 for blood pressure, and 256 for respiration. Those different lengths were chosen to remove high frequencies without corrupting oscillations of interest [19]. The features below are extracted from GSR: Mean, Mean of derivative, standard deviation, the features extracted due to consider the importance of average variation and deviation. The common features of temperature: Mean, Standard deviation, Minimum and Maximum of the whole trial. And for Blood Pressure: Mean value over the whole trial is the feature which extracted via this signal. At last to characterize the respiration, features below extracted from both the frequency and time domain; Mean, Mean of derivative, Standard deviation, Maximum values minus Minimum values and calculating the power in 10 frequency bands of .25 Hz to 2.75 Hz. B. Brain signals Prior to extracting features from EEG and performing classification, we need to pre-process signals to remove noise. Noise can originate from several sources: environment (mainly 50Hz), muscles activity and fNIRS noise. The environmental noise is the easiest to remove by applying a band pass filter in the 4-45 Hz range. This band is selected because the frequency intervals of interest in EEG are the () (4-8Hz), a (8-12Hz), fJ (12-30Hz) and y (30-45Hz) bands. Muscle activities such as eye-blinks or jaw clenching contaminate EEG signals with strong artifacts [15]. Then compute a local reference by applying a local Laplacian filter to obtain some better focalization on brain activity [6, 12]. First, we work on a common set of features, Mean, Standard deviation, Skew ness, Kurtosis, Mean of the absolute values of the first difference of raw signals, Mean of the absolute values of the first difference of normalized signal [3]. These 6 features are extracted for each electrode, so the total number of features by this method is 6*54=324, leading to the problem of dimensionality. In the next step, we tried to determine which features are most relevant to differentiate each affective state. Reducing the dimension of the feature space has two advantages, the computational costs are lowered and the removal of noisy information may lead to a better separation of the classes [10]. Genetic Algorithm is used to solve the problem of high dimensional feature space. Since the application of non-linear system theory to the EEG has been shown to offer information beyond that provided by traditional EEG measures, we calculate correlation dimension as a strong nonlinear feature for each electrode of 10-20 standard system, this is because the procedure is so time consuming to calculate for all 54 channels.
1573
To extract the feature above, first we should transform a onedimensional time series into a trajectory in a multidimensional phase space. The concept of phase space is central to nonlinear dynamical analyses. In a hypothetical system described by n state variables, the phase space is ndimensional. Each state of the system corresponds to a point in the phase space whose n coordinates are the values of the state variables for this specific state. To transform the raw signal to the embedded space, the r , which is the time delay between the points of the time series considered, and d is the embedding dimension should be calculated. Takens (1981) showed that an attractor reconstructed by using delay coordinates from a single time series and by performing an embedding procedure is topologically equivalent to the original system. The choice of an appropriate time delay r and embedding dimension d is important for the success of reconstructing the attractor with finite data. We used the first local minimum of the average mutual information between the sets of measurement x(t) and x(t+ r ) for the time delay r (Fraser b and Swinney, 1986). We estimated the minimum embedding dimension in the procedure calculating correlation dimension. The correlation dimension determines the number of independent variables that are necessary to describe the dynamics of the original system. It is a measure of complexity of the process being investigated and characterizes the distribution of points in the phase space. The Grassberger-Procaccia algorithm (GPA) was used to calculate the correlation dimension of the EEG attractors (Grassberger and Procaccia, 1983). The determination is based on calculating the relative number of pairs of points in the phase-space set that is separated by a distance less than r. For a self-similar (fractal) attractor, the local scaling exponent is constant, and this region is called a scaling region. This scaling exponent can be used as an estimate of the correlation dimension. If one plots C(N, r) vs. r on a loglog scale, the correlation dimension is given by the slope of the log C(r) vs. log r curve over a selected range of r, and the slope of this curve in the scaling region is estimated by leastsquares fitting [5, 19]. V.
CLASSIFICATION
We used the Quadratic Discriminant Analysis (QDA) pattern recognition techniques to classify emotion states of three categories. To use QDA for classifying data, we have used the 'diagquadratic' type, that fit a multivariate normal density to each group and the covariance matrices are assumed to be diagonal. Features used were either based on EEG alone, on peripheral signals alone, or on fusion of these two modalities by concatenation of the features vectors. Two different feature sets are analyzed for EEG, using correlation dimension as a nonlinear feature in combination with the features which are extracted from raw signal. The performance of the classifier is evaluated for investigating
and comparing the results of the common features and the combination of correlation dimension with them. Two evaluation measures are considered, first using half of the data for train and half for test, and second using Leave One Out method to get better results. VI.
RESULTS AND DISCUSSION
The results of the Quadratic Discriminant Classifier with the GA method as feature selection for three categories of emotional state are evaluated. The result of the classification accuracy for EEG, peripheral and both brain and peripheral signals of one participant is performed in table 1. TABLEI. THE QDA FOR EEG, PERIPHERAL AND BOTH EEG peripheral EEG+peripheral DiagQuadratic 61.8% Half: train, half: tes t 55% 63.33% LOO 51.66% 62.2% 66.66%
According to the tables and analyzing the results, we can conclude that on average, EEG's signals seem to perform better than other physiological signals. But the results of fusion between EEG and peripheral are more robust In compare to brain and peripheral signals separately. TABLE2. USING CORRELATION DIMENSION TO IMPROVE THE EEG'S RESULT Old Combination with correlation DiagQuadratic Feartures dimension Half: train, half: tes t 63.33% 66.66% LOO 66.66% 76.66%
Since the application of non-linear system theory to EEG has been shown to offer information beyond that provided by traditional EEG measures, so we used correlation dimension to improve the results of brain signals. The results show the improvement in compare in each raw of table. So it seems the nonlinear features would lead to know better how emotional activities work. VII.
CONCLUSION
In this paper, we explored automatic recogrntion of emotional states in physiological signals from the central and peripheral nervous systems, using pattern recognition technique the QDA classifier, in conjunction with feature selection and reduction method (Genetic Algorithm). The stimuli to elicit emotions is showing the images of lAPS pictures to classify emotion in the three main areas of the valance-arousal space by using both brain and peripheral signals separately and fusion of both. According to the results, EEG signals seem to perform better than other physiological signals, but the results of different methods in fusion between EEG and peripheral are more robust in compare to brain and peripheral signals separately. So we can conclude about the importance of EEG to develop a multimodal emotion understanding scheme. Analyzing the results of different feature sets confirms the interest of using brain signals in compare of peripheral signals in emotion assessment.
1574
To compare the results of the work which attempt to introduce emotion recognition systems as a classification problem, it is important to consider the points below 1. The way that emotions are elicited, the subjective stimuli usually have better results than the objective one, audio visual stimuli seems better than pictures too, especially the effect of music to elicit emotional state is well known. . 2. The number of participants, to introduce a user independent system, Good results in user independent systems usually are obtained of protocols which consists some participants, to introduce a model which is enough generalized for this purpose. 3.The type of physiological signals and the time of data recordings, and especially using predefined labels or self assessment labels which is done by the participants is also important, because emotions are known to be very dependent on past experience so that one can never be sure whether in data collection the expected emotion is elicited or not. Since the application of non-linear system theory to the EEG has been shown to offer information beyond that provided by traditional EEG measures, so we used correlation dimension to improve the results of brain signals. It seems the nonlinear features would lead to know better how emotion activities work. Using self-assessment labels would be our future work, that helps us to know more precisely about the real emotional states of the participants, we will work on other nonlinear features and other classifiers like SVM to improve the results reported.
[7] [8]
[9]
[10]
[11]
[12]
[13] [14]
[15]
[16]
[17]
[18] ACKNOWLEDGMENT
This work is supported by Iran Telecommunication Research Center, http://www.itrc.ac.ir.
REFERENCES [1]
[2]
[3]
[4]
[5]
[6]
J. Gratch , "Evaluating a Computational Model of Emotion" , 2005 Springer Science+Business Media, Inc. Manufactured in The Netherlands, Autonomous Agents and Multi-Agent Systems, 11, 2343. J. Gratch, S. Marsella, "A Domain-independent Framework for Modeling for Modeling Emotion ", Journal of Cognitive Systems Research, Volume 5, Issue 4,2004, Pages 269-306. M. Murugappan, M. Rizon, S. Yacoob, M. Karthigayan and M. Sugisaka, "Feature Extraction Methods for Human Emotion Recognition using EEG" A Study ,Malaysia-Japan International Symposium on Advanced Technology ,2007, accepted P. Bob, M. Kukleta, I. Riecansky, M. Susta, P. Ukumberg, G. F. Jagla "Chaotic EEG Patterns During Recall of Stressful Memory Related to Panic Attack" Physiol. Res. 55 (Suppl. 1): Sl13-Sll9, 2006. J. Chaea, J. Jeongb, B. S. Petersonc, D. Kima, W. M. Bahka, T. Y. Juna, S. Y. Kimd, K. S. Kima ,"Dimensional complexity of the EEG in patients with posttraumatic stress disorder", Psychiatry Research: Neuroimaging 131 (2004) 79-89. G. Chanel, J. Kronegg, D. Grandjean, T. Pun, "Emotion assessment: Arousal evaluation using EEG's and peripheral physiological signals", Proc. Int. Workshop Multimedia Content Representation, Classification and Security (MRCS), Sept. 11- 13, 2006, Istanbul, Turkey, B. Gunsel, A. K. Jain, A. M. Tekalp,B. Sankur, Eds., Lecture Notes in Computer Science, Vol. 4l05,Springer, 530-537.
[19]
[20]
[21]
D.O. Bos "EEG-based Emotion Recognition: the influence of visual and auditory stimuli" , Nederland, 11-16-2006. R. Cowie, E. Douglas-Cowie, N. Tsapatsoulis, G. otsis, S. Kollias, W. Fellenz and J. G. Taylor: "Emotion recognition in human computer interaction", IEEE Sinal Process. Mag., 18, pp. 32-80,2001. K. H. Kim, S.W. Bang, S.R. Kim, "Emotion recognition system using short-term monitoring of physiological signals "Medical & Biological ngineering & Computing, vol 42. pp 419-427, 2004. LWangncr, J. kim, E.Andre," From physiological signals to emotions: implementing and comparing selected methods for feature extraction and classification", HUMAINE FP6. K. Takahashi, A. tsukaguchi, "Remarks on emotion recognition from bio potential signals", 2nd International Conference on Automous Robots and Agents. Palmerton North, New Zealand, December 13-15, 2004. G.Chanel, K. Ansari-Asl, T. Pun," Valence-arousal evaluation using physiological signals in an emotion recall paradigm", IEEE trans, 14244-099l,pp 2662-2666. www.enterface.net A. Savran, K. Ciftci, G. Chanel, J. Cruz Mota, L Hong Viet, B.Sankur, L. Akarun, A. Caplier, M. Rombaut" Emotion Detection in the Loop from Brain Signals and Facial Images", eNTERFACE'06, July 17th - August 11th, Dubrovnik, Croatia.2006. R. L. Mandryk, M. S. Atkins," A Fuzzy physiological Approach for Continuously Modeling Emotion During Interaction with Play Technologies", International Journal of Human-Computer Studi es, Volume 65, Issue 4 ,es, Volume 65, Issue 4 . A. Haag, S. Goronzy, P. Schaich, and J. Williams, "Emotion Recognition Using Bio-Sensors: First Step Toward an Automatic System," Affective Dialog Systems: Tutorial And Research Workshop, Kloster Irsee, Germany, June 14-16,2004. L.i. Aftanas, N. V. Reva, A.A. Varlamov, S. V. Pavlov, and V. P. Makhnev, "Analysis of Evoked EEG Synchronization and Desynchronization in Conditions of Emotional Activation in Humans: Temporal and Topographic Charactristics", Neuroscience and Bahavioral physiology, Vol. 34. No.8, 2004. G.Chanel, C. Rebetez, M. Betrancourt, T.Pun, "Boredom, engagement and anxiety as indicators for Adaptation to difficulty in games",Proceedings of the 12th international conference on Entertainment media, Tampere,Finland,Games track,pp 13-17,2008. L. I. Aftanas, N. V. Lotova, V. I. Koshkarov, V. P. Maknev, Y. N. Mordvinstev, S. A. Popov, "Non-linear dynamic complexity of the human EEG during evoked emotions", International Journal of Psychophysiology 28(1998) 63-76. L. I. Aftanas, N. V. Lotova, V. I. Koshkarov, V. P. Maknev, Y. N. Mordvinstev, S. A. Popov, "Non-linear analysis of emotion EEG: calculation of Kolmogorov entropy and the principal Lyapunov exponent" Neuroscience Letters 226( 1997) 13-16. A. Sebe, I. Cohan, T. Gevers and T.S. Huang, "Multimodal Approaches for Emotion Recognition: A Survey", International Imaging VI. Proceedings of the SPIE, Volume 5670, pp. 56-67,2004.
1575