Radiology
Kirsten L. Boedeker, MS Michael F. McNitt-Gray, PhD Sarah R. Rogers, MS Dao A. Truong, BS Matthew S. Brown, PhD David W. Gjertson, PhD Jonathan G. Goldin, MD, PhD
Index terms: Computed tomography (CT), computer programs, 60.12115, 60.12118 Computed tomography (CT), electron beam, 60.12118 Computed tomography (CT), image processing, 60.12115, 60.12118 Emphysema, pulmonary, 60.751 Lung, CT, 60.12115, 60.12118 Published online 10.1148/radiol.2321030383 Radiology 2004; 232:295–301 Abbreviation: MTF ⫽ modulation transfer function 1
From the Department of Radiology, David Geffen School of Medicine, University of California at Los Angeles, 10833 Le Conte Ave, CHS B3–227U, Box 951721, Los Angeles, CA 900951721. Received March 10, 2003; revision requested May 28; revision received August 29; accepted October 8. Supported in part by National Heart, Lung, and Blood Institute grant N01-HR96143. Address correspondence to K.L.B. (e-mail:
[email protected]).
Emphysema: Effect of Reconstruction Algorithm on CT Imaging Measures1 In the current study, the effects of reconstruction algorithms on quantitative measures derived from computed tomographic (CT) lung images were assessed in patients with emphysema. CT image data sets were reconstructed with a standard algorithm and alternative algorithm(s) for 42 subjects. Algorithms were grouped as overenhancing, sharp, standard, or smooth. Density mask and volume measurements from the alternative algorithm data sets were compared with standard algorithm data sets. The overenhancing category yielded an average shift of 9.4% (ie, a shift in average score from 35.5% to 44.9%); the sharp category, a shift of 2.4%; and the smooth category, a shift of ⫺1.0%. Differences in total lung volume measurements were less than 1%. In conclusion, the CT reconstruction algorithm may strongly affect density mask results, especially for certain reconstruction algorithms. ©
Author contributions: Guarantors of integrity of entire study, K.L.B., M.F.M.G.; study concepts and design, all authors; literature research, K.L.B., M.F.M.G.; clinical studies, all authors; data acquisition and analysis/interpretation, all authors; statistical analysis, D.W.G.; manuscript preparation, definition of intellectual content, editing, revision/review, and final version approval, all authors ©
RSNA, 2004
RSNA, 2004
Computed tomography (CT) is used to visualize anatomy and to derive quantitative information about the size or attenuation of structures being imaged. Quantitative image analysis of thoracic CT scans is emerging as an increasingly valuable outcome measure that can be used to assess the effectiveness of therapies in diffuse lung disease clinical trials (1,2). Quantitative image analysis measurement accuracy and validity are dependent on optimal and reproducible imaging techniques; therefore, close attention to the imaging protocol is a prerequisite. The selection and variation of technical parameters (eg, section thickness, tube voltage, tube current–time product, reconstruction algorithm) are
important, often clinically overlooked, aspects of image acquisition that require serious attention. While many factors, such as patient size and lung volume, can affect the final image, the choice of technical parameters can also affect comparability of quantitative information extracted from image data sets and thus cannot be ignored. In drug trials where quantitative information is derived from follow-up studies, the influence of technical parameters on reproducibility must be considered for accurate assessment of therapeutic effects. Investigators in several studies of the effects of technical parameter variability on quantitative CT findings have focused on the reproducibility of average Hounsfield unit values in either homogeneous media or over large regions of interest in hetereogeneous media (3,4). In these scenarios, the mean value of the distribution has been demonstrated not to change (within 1 HU, maximum 2 HU) with section thickness or reconstruction algorithm, which help determine the spatial resolution and volume averaging per voxel. In many quantitative CT applications, however, the focus is on regional inhomogeneities and patterns of attenuation distribution in small regions of interest rather than on a mean value within a region. The amount of volume averaging per voxel may not affect the mean Hounsfield unit value over a large region but has been shown to affect the distribution of attenuation values and thus measures derived from this distribution (5). Such a distribution measure is the density mask score, which is used to quantify areas of low lung attenuation that reflect regions of lung destruction associated with emphysema. Density mask is a term introduced in conventional CT (9800 CT/T; GE Medical Systems, Milwaukee, Wis) that is defined as the percentage of voxels in the lung with a Hounsfield unit value below a certain threshold, which corresponds to the percentage of voxels 295
Radiology
below a certain lung attenuation (6). In a drug treatment trial or any application of the density mask technique, differences in density mask scores from different examinations should reflect solely on the improvement or deterioration of lung tissue. Technical parameter variability should not mask or distort true changes in density mask score. The choice of reconstruction algorithm influences both the in-plane spatial resolution and noise. Higher-resolution algorithms (eg, bone, sharp, very sharp) preserve the higher spatial frequencies, which results in better spatial resolution in an image, at the expense of greater noise. Softer algorithms (smooth, soft) reduce the higher-frequency contribution, which decreases noise but also degrades spatial resolution. When CT scan data are reconstructed with different algorithms, the mean Hounsfield unit value of a region is expected to stay the same, but the distribution of attenuation values and thus measures derived from this distribution will change. Thus, the purpose of our study was to assess the effects of reconstruction algorithm on quantitative measures extracted from CT lung images in patients with emphysema.
Materials and Methods Patient Selection Forty-two patients enrolled in an ongoing emphysema treatment trial, for which institutional review board approval had been obtained, underwent a thoracic CT imaging protocol as part of that study. Institutional review board approval and written informed consent were obtained at the time of enrollment in the treatment trial, which included an agreement for data to be used in studies with experimental computer-aided techniques, such as the current study. Five institutions and four models of CT scanners were involved. Patient inclusion criteria included age older than 45 years, no tobacco use for 6 months, no oral steroid use for 2 months, no myocardial infarction or surgery for 12 months, no history of lung cancer, and no history of lung transplantation, lung volume reduction surgery, or lung removal. Patient images were required to have a density mask of more than 10% with a standard reconstruction algorithm for the patient to be enrolled in the study. Data for the 42 patients who met the inclusion criteria were analyzed consecutively over a period of time for the current study (20 296
䡠
Radiology
䡠
July 2004
men [48%], 17 women [40%], and five patients [12%] without sex information; mean age, 65 years ⫾ 7 [SD]). Twelve patients underwent CT with an electronbeam scanner (XL-150; Imatron, South San Francisco, Calif); 19 patients (one group of nine patients and one group of 10), with a LightSpeed Qx/i scanner (GE Medical Systems) (one each at two institutions); five patients, with a Somatom Plus 4 scanner (Siemens Medical Systems, Iselin, NJ); and six patients, with a PQ5000 scanner (Philips Medical Systems, Cleveland, Ohio).
Imaging Protocol All subjects underwent a standardized imaging protocol, with careful attention to patient breathing instruction as part of the protocol. Each subject was in a supine position throughout scanning of the entire thorax at suspended full inspiration with use of thick sections (8 mm with the electron-beam CT scanner, 10 mm with all other scanners) without the use of intravenous contrast material. Thick sections were used because the clinically prevailing density mask threshold of ⫺910 HU in emphysema quantification was developed with 10-mm section thickness (6). Furthermore, thick sections are often used in clinical practice to achieve full coverage of the chest in one breath hold when multi– detector row CT technology is not available. While a contrast material injection was used in the original density mask study, later work by Coxson et al (7) showed that the introduction of contrast material does not substantially affect the distribution of Hounsfield unit values in lung parenchyma. We used a pitch of 1.4:1.0, except in the case of electron-beam CT, where continuous volume scan mode with 0.2second acquisition was used. Spirometric gating was not used, but scans were acquired in one breath hold at total lung capacity following careful coaching of the subjects. Each data set was reconstructed with the standard or equivalent nonenhancing-nonsmoothing reconstruction algorithm of the scanner. All identifying patient information (eg, name, medical record number) was removed from images prior to reconstruction. Image data were transferred between sites by means of file transfer protocol or digital imaging and communications in medicine, or DICOM, transfer. Because the data were made anonymous, we were unable to obtain all of the patient information about these subjects (eg, sex in-
formation was unavailable for all patients). Additional Image Reconstruction The raw (ie, projection) image data were reconstructed at the scanner with one or more additional reconstruction algorithms after initial reconstruction with the standard, or normal, algorithm. While some variation in standard algorithms exists between scanners, the behavior of these standard algorithms is very similar (modulation transfer function [MTF] is discussed later). Electron-beam CT scans (n ⫽ 12) were additionally reconstructed in smooth, sharp, and very sharp algorithms. LightSpeed CT scans (n ⫽ 19) were further reconstructed with the lung (n ⫽ 17) or bone (n ⫽ 2) algorithms. Somatom Plus 4 CT scans (n ⫽ 5) were reconstructed with the AB82 algorithm. Finally, the PQ5000 scans (n ⫽ 6) were reconstructed with the bone algorithm. Because reconstruction is performed at the scanner, the exact number and type of reconstructions depended on what data the participating sites were able to provide and transfer to us. Depending on the site, these extra reconstructions resulted in two or more image sets from the same patient, at the same breath-hold and image locations. It is important to emphasize that the only difference between image data sets was the algorithm employed to reconstruct the raw data, and thus no additional radiation was required to produce these additional data sets. Reconstruction Algorithm Characterization The MTF curves in the current study were measured on-site by a board certified physicist (M.F.M.G.) for each scanner by using the technique developed by Droege and Morin (8), which involves analysis of the square wave response form. The single-image Droege and Morin technique was chosen over other MTF estimation techniques (eg, the technique suggested by Boone [9]) because it can be applied directly at the scanner. The ability to transmit original image data between institutions, as is necessary to implment other MTF analysis techniques, was not available at the time the site visits took place. To accomplish the MTF measurements, a bar pattern phantom (Helios CT QA Phantom; GE Medical Systems) with 1.6-, 1.3-, 1.0-, 0.8-, 0.6-, and 0.5-mm bar spacing was used to obtain these curves from each scanner. All curves were generated for each scanner– Boedeker et al
Radiology
reconstruction algorithm combination used in the current study. These measurements were carried out as part of a quality assurance site visit to each site participating in the main study (ongoing trial). On the basis of results of these measurements, we classified the algorithm-scanner combinations into one of four categories. The standard category consisted of those algorithms that neither enhanced nor smoothed the image data. Algorithms with MTF values that strongly overenhanced the relative contrast (ie, with MTF values substantially greater than 1) at some spatial frequencies were classified into the overenhancing category. Other algorithms that resulted in either minimal or no overenhancement, but which did provide higher MTF values over a wider range of spatial frequencies than did the standard or normal reconstruction algorithms, formed the sharp category. Finally, the smooth reconstruction algorithm, with which the relative contrast decreases to zero more rapidly than with other algorithms, formed the smooth category. While there is, of course, some variation within groups, the groups are representative of algorithm type.
Quantitative Image Analysis For each image data set, the lungs were segmented by using a semiautomated approach. The lungs were first segmented with a model-based segmentation algorithm (10,11) and were then manually edited (K.L.B., S.R.R., D.A.T.) when necessary to ensure that structures such as the trachea and large airways (⬎5 mm in diameter) were excluded from the lung. As stated earlier, for each reconstruction, density masks were calculated with the scanner software, with a benchmark of ⫺910 HU as established by Muller et al (6). The threshold of ⫺910 HU was chosen because it is the benchmark most widely used in clinical practice. The difference in density mask (DM) score between the alternative (A) reconstruction algorithm and the standard (S) reconstruction algorithm (DMA ⫺ DMS) was calculated for each additional reconstruction algorithm. The volume of the lungs, calculated by summing the volumes of voxels classified by the segmentation algorithm as lung, was also recorded for each reconstruction algorithm (12). The difference in volume measurements between the alternative reconstruction algorithm and the standard algorithm was calculated for each additional reconstruction algorithm. Volume 232
䡠
Number 1
Statistical Analysis After each algorithm was assigned to its proper category on the basis of the MTF curve, the results were examined statistically with analysis of variance. To account for possible heterogeneity in variance caused by use of the same subject data for two or more reconstructions, a robust linear regression model (13,14) was used to test for the significance of differences. The variable listing algorithm was recoded as two indicator variables: one representing the difference between the overenhancing and standard algorithms and the second representing the difference between the smooth and standard algorithms. The difference between the sharp and standard algorithms was selected as the arbitrary baseline value. The distributions of differences in density mask scores were displayed with box plots in which the interquartile range (IQR) forms a box bisected at the median value, with lines extending to the upper and lower adjacent values (values within 1.5 ⫻ IQR from the 25th and 75th quartile values). Statistical analysis was performed with software (STATA, version 7; Stata, College Station, Tex). All P values were two sided, and differences with a P value less than .05 were considered to be significant. For completeness, we looked for differences in the distributions of sex, with the Fisher exact test, and age, with the Kruskal-Wallis test, across reconstruction algorithms.
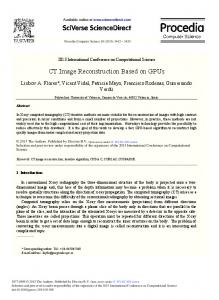
Results The measured MTF curves are presented in Figure 1. In each graph, the relative contrast, normalized to the zero frequency component of the spectrum, is plotted against spatial frequency (15). Each curve eventually goes to zero (total loss of relative contrast) as the spatial frequency increases, which corresponds to smaller objects and sharper edges. Because both the LightSpeed Qx/i lung and PQ5000 bone algorithms overenhanced at certain spatial frequencies (ie, contrast ratios greater than 1), we grouped image data sets reconstructed with either algorithm into the overenhancing category. The LightSpeed Qx/i bone algorithm, Somaton Plus 4 AB82 algorithm, and XL150 sharp and very sharp algorithms all provide higher MTF values over a wider range than do the standard or normal algorithms and were thus grouped into the sharp category. Finally, the XL-150 smooth algorithm clearly produces MTF
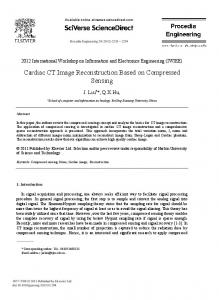
values that decrease to zero more quickly than does the normal algorithm and was thus grouped into the smooth category. For each patient, the result achieved with the alternative algorithm(s) was compared with that with the standard (or normal) algorithm. The average density mask score with the standard algorithms for all 42 patients was 37.7% ⫾ 11.7 (range, 13.6%–58.2%). No statistically significant differences based on age or sex were found for any reconstruction (or equivalent) algorithms. The number of patients with CT scans reconstructed with each scanneralgorithm combination according to category and the total number of patients with scans in a category are given in Table 1. The number of patients with CT scans in the sharp category exceeded the number of patients in the standard category for the XL-150 because the sharp category for this scanner contained the images reconstructed with sharp and very sharp algorithms. The total number of reconstructed image data sets exceeded the total number of patients (66 data sets vs 42 patients) because the CT scans obtained with the XL-150 scanner in 12 patients were reconstructed four times: once in standard, once in smooth, once in sharp, and once in very sharp algorithms. The difference in density mask score obtained with the alternative algorithm from that obtained with the standard algorithm for each category is depicted in Figure 2. The overenhancing category yielded an average increase in density mask score of 9.4% compared with the standard category score (ie, a shift in average score for the overenhancing category from 35.5% to 44.9%). This shift in score ranged from 3.8% to 15.3%. An example of an image data set reconstructed with standard and overenhancing algorithms, as well as of the resulting shift in density mask score, is shown in Figure 3. This figure illustrates how the density mask score can shift by 15% in one image as a result of use of an overenhancing algorithm. For the sharp category, an average increase of 2.4% with a range from 0.1% to 4.7% was observed, while the smooth category showed an average decrease of ⫺1.0% with a range from ⫺0.6% to ⫺1.5%. These differences were statistically significant (P ⬍ .001). The minimum, maximum, median, and average density mask difference values for each group are presented in Table 2. The differences in total lung volume, our second quantitative measure, be-
Emphysema at CT: Effect of Reconstruction Algorithm
䡠
297
Radiology Figure 1. MTF curve for each CT scanner and its reconstruction algorithms: (a) LightSpeed Qx/i, (b) XL-150, (c) PQ5000, (d) Somatom Plus 4. Y axis is modulation value, and x axis is spatial frequency. f ⫽ overenhancing algorithms, ⽧ ⫽ sharp algorithms, E ⫽ smooth algorithm. Standard algorithms are indicated with solid lines.
TABLE 1 Number of Patients Assigned to Imaging with Each Algorithm, according to Category CT Scanner
Standard (n ⫽ 42)
Smooth (n ⫽ 12)
Sharp (n ⫽ 31)
Overenhancing (n ⫽ 23)
LightSpeed Qx/i Somatom Plus 4 PQ5000 XL-150
Standard (n ⫽ 19) AB70 (n ⫽ 5) Standard (n ⫽ 6) Normal (n ⫽ 12)
NA NA NA Smooth (n ⫽ 12)
Bone (n ⫽ 2) AB82 (n ⫽ 5) NA Sharp (n ⫽ 12), very sharp (n ⫽ 12)
Lung (n ⫽ 17) NA Bone (n ⫽ 6) NA
Note.—NA ⫽ not applicable.
tween categories, although very small, were statistically significant (P ⬍ .001). Average volume changes were the following: 0.2% increase for the smooth category, 0.4% decrease for the sharp category, and 0.7% decrease for the overenhancing category. 298
䡠
Radiology
䡠
July 2004
Discussion Our results indicate a strong effect on density mask score when the reconstruction algorithm is switched between a the standard and the overenhancing algorithm. Shifts in density mask score as
large as 15.3%, from 28.6% with standard algorithm to 43.9% with overenhancing algorithm, were found. For this category, a statistically significant average shift in score of 9.4% (from standard) was observed. These results raise a question about the comparability of scan results Boedeker et al
Radiology
Figure 2. Box plot of change in density mask score (compared with that with standard algorithm) as a function of reconstruction algorithm category. Number of comparisons was 23, 31, and 12 for overenhancing, sharp, and smooth algorithms, respectively. P value was .001 for hypothesis that average differences across three alternatives are equal.
obtained with overenhancing reconstruction algorithms versus nonoverenhancing algorithms, even under ideal circumstances (ie, the same patient in the same breath hold). With the other algorithm categories (ie, sharp and smooth), there is a smaller though still statistically significant shift. These shifts, while fairly small, still raise comparability concerns in situations where a patient is being followed up for slight changes in density mask score and the reconstruction algorithm is changed from scan to scan. The shifts also suggest a limit on how fine a comparison between a patient’s CT scans obtained with different algorithms can ultimately be made. However, factors such as breath hold, section thickness, and other parameters may also be a strong influence on variability in results. This is an area for further investigation. The effect of reconstruction algorithm on total lung volume, our second quantitative measure, while statistically significant, does not appear to have a clinically important effect. The small differences were likely a result of the level of algorithm-induced blurring at the periphery of the lung (note that a fixed threshold was used to segment the lung parenchyma from the chest wall). The consistency of volume measurements in the current study indicate that any variability introduced by manual editing of the automated segmentation results is very Volume 232
䡠
Number 1
small and has little or no effect on the density mask scores. Reconstruction algorithms are characterized by their MTF. An MTF curve plots contrast modulation as a function of spatial frequency, normalized to the zero frequency component (ie, average intensity). The shape of the MTF curve reveals the level of fidelity in preservation of contrast at each spatial frequency. Although the MTF is affected by other factors (including detector width, focal spot size, geometric magnification, sampling density), reconstruction algorithm is a key component in each CT system MTF. Overenhancing algorithms are capable of producing MTF values at certain spatial frequencies that are larger than unity, which means that contrast is actually amplified. Other algorithms produce MTF values that are smaller than unity, meaning that contrast is attenuated; the value of the modulation varies (generally decreasing) as a function of spatial frequency until it reaches zero, at which point objects can no longer be resolved. The MTF curves in the current study demonstrate that certain algorithms— those designed to emphasize high-contrast spatial resolution—maintain contrast by better preserving or even overenhancing the differences between voxels. This results in increased differences between local voxel values, resulting in a change in the distribution of voxel values within the local region. Thus, the mean value of
a large region of interest may not change with the algorithm, but the percentage of voxels within a certain range of the distribution (or in this case that are below a specified threshold) may change. Thus, the reconstruction algorithm alone can influence the value of the density mask for an individual patient. Implications of the current study results are clear for other investigations with standardized imaging protocols and for those in which patients undergo imaging repeatedly to evaluate experimental effectiveness. As quantitative CT imaging becomes an increasingly important and prevalent tool, attention must be paid to the details of all aspects of the image acquisition. In the current study, we have shown that the varying of only one technical factor—reconstruction algorithm— can alone cause differences of more than 15% in the common emphysema study end point variable of density mask. Clearly, if all other factors were held completely constant, if a patient in a treatment trial underwent an initial CT examination with the images reconstructed with a standard algorithm and then underwent follow-up CT with the images reconstructed with an overenhancing algorithm, the follow-up CT scans could show an upward shift in density mask score of 4%–15% (average, 9.4%). This could falsely indicate disease progression, possibly mask clinically important improvement, and overshadow the existence of a potentially useful therapy. Conversely, in a patient with emphysema who underwent an initial CT examination with the images reconstructed with an overenhancing algorithm and then underwent follow-up CT with the images reconstructed with a standard algorithm, spurious improvement could be shown that would falsely indicate treatment effectiveness. Comparability between groups of patients with CT image data that have been reconstructed with different algorithms could also be hampered by this one technical difference. Furthermore, whether or not a patient meets entrance criteria for a particular study or clinical trial may be influenced by the way in which their CT scan was reconstructed. Patient CT scans reconstructed with an overenhancing algorithm may surpass a density mask criterion that would not have been met if the images had been reconstructed with a standard algorithm. These results may have implications for studies on different reconstruction algorithms. For example, Coxson et al (16) compared quantitative CT results from
Emphysema at CT: Effect of Reconstruction Algorithm
䡠
299
Radiology
healthy control subjects and patients with idiopathic pulmonary fibrosis who underwent scanning under different conditions. The patients with idiopathic pulmonary fibrosis underwent scanning with an electron-beam CT scanner (C-150; Imatron) with 3-mm section thickness, and a high-resolution algorithm (sharp category) was used to reconstruct the images. The control patients underwent scanning with a conventional CT scanner (HighLight Advantage; GE Medical Systems) with 10-mm section thickness, and a standard algorithm was used to reconstruct the images. On the basis of the work of Kemerink et al (3,4), Coxson et al (16) justified the comparison of quantitative CT results when technical parameters differ, including the comparison of measures derived from images reconstructed with sharp and standard algorithms. However, the comparison of idiopathic pulmonary fibrosis tissue to normal tissue is an examination of regional inhomogeneities, similar to the density mask measures used to quantify emphysema. While Kemerink et al reported that mean values of homogeneous media (eg, water phantoms) and those of large regions of heterogeneous media (lung phantom and lung tissue) are not influenced by reconstruction algorithm (3,4), our results confirm the later work of Kemerink et al (5) that indicates different reconstruction algorithms will change the distribution of voxel values in the local region. As CT technology advances and provides newer ways of acquiring and processing CT data, the vast amount of technical variability in quantitative analysis must be addressed. Numerical benchmarks set over a decade ago may need to be reestablished. When establishing the density mask technique, Muller et al (6) used a specific set of technical parameters for the scanning and reconstruction of the images prior to analysis: 10-mm-thick images obtained with a conventional axial CT scanner (9800; GE Medical Systems), at 120 kVp, with the standard reconstruction algorithm. Under these conditions, Muller and colleagues found that a threshold of ⫺910 HU provides good correlation with the lung destruction observed in corresponding 1-cmthick transversely sliced pathologic specimens. This is the benchmark still most widely used today. The validity of this benchmark when parameters such as section thickness are varied from those used by Muller has been investigated (17–19). A major limitation of the current study was lack of pathologic correlation to es300
䡠
Radiology
䡠
July 2004
Figure 3. LightSpeed Qx/i image data. Original CT scans reconstructed with (a) standard and (b) lung algorithms. Density mask results (red) with (c) standard (density mask, 34%) and (d) lung (density mask, 49%) algorithms. Note that density mask score is ratio of lung voxels with attenuation below ⫺910 HU to total number of lung voxels and that parenchyma, airways, and blood vessels are included in denominator as lung voxels.
TABLE 2 Summary Statistics for Difference in Density Mask Score from Standard Algorithm Score, according to Category Difference
Smooth (n ⫽ 12)
Sharp (n ⫽ 31)
Overenhancing (n ⫽ 23)
Total (n ⫽ 66)
Minimum Maximum Median Average
⫺1.5 ⫺0.6 ⫺1.0 ⫺1.0
0.1 4.7 2.3 2.4
3.8 15.3 9.3 9.4
⫺1.5 15.3 3.1 4.2
Note.—Data are percentages.
tablish which algorithm yields the most accurate density mask. Until correlation with pathologic truth is firmly established under varying scanning condi-
tions—including effects of thinner sections and reconstruction algorithm—the relative effect of these parameters on the desired quantitative measures must be Boedeker et al
Radiology
analyzed in comparison studies. Another limitation includes the possible effect of interscanner bias. In a drug treatment trial, a patient is apt to undergo scanning with the same machine as they are followed up over time, and thus it is the difference between algorithm types on which we focused. However, it could be valuable to examine the difference in density mask score caused by change in machine alone. Next, this article does not address the mechanism behind the variation in density mask with algorithm. A deeper investigation into the cause of the density mask shift could reveal corrective or compensatory measures. Last, since the sample size in the current study is small, further study of the effects of reconstruction algorithm on quantitative CT measures is warranted. To our knowledge, however, this is the first study to assess the effects of reconstruction algorithm on quantitative measures derived from CT lung images in patients with emphysema. This was a unique situation because each subject’s image data were reconstructed from the same data by using two (or more) algorithms. The results of comparing the quantitative measures derived from images reconstructed with each algorithm could have an important effect. In conclusion, we have demonstrated that the choice of reconstruction algorithm can have a substantial effect on quantitative measures extracted from CT lung images in patients with emphysema. The magnitude of the effect depends on the characteristics of the reconstruction algorithm. Reconstruction algorithm may strongly affect density mask results, espe-
Volume 232
䡠
Number 1
cially overenhancing algorithms. Reconstruction algorithm has a statistically significant effect on lung volume measurement, but the magnitude of these differences is less than 1%. The density mask results suggest careful attention to the selection of reconstruction algorithm as well as caution in the comparability of CT scans obtained with different reconstruction algorithms. References 1. Goldin JG. Quantitative CT of the lung. Radiol Clin North Am 2002; 40:145–162. 2. Stolk J, Dirksen A, van der Lugt AA, et al. Repeatability of lung density measurements with low-dose computed tomography in subjects with alpha-1-antitrypsin deficiency-associated emphysema. Invest Radiol 2001; 36:648 – 651. 3. Kemerink GJ, Lamers RJ, Thelissen GR, van Engelshoven JM. CT densitometry of the lungs: scanner performance. J Comput Assist Tomogr 1996; 20:24 –33. 4. Kemerink GJ, Lamers RJ, Thelissen GR, van Engelshoven JM. Scanner conformity in CT densitometry of the lungs. Radiology 1995; 197:749 –752. 5. Kemerink GJ, Kruize HH, Lamers RJ, van Engelshoven JM. CT lung densitometry: dependence of CT number histograms on sample volume and consequences for scan protocol comparability. J Comput Assist Tomogr 1997; 21:948 –954. 6. Muller NL, Miller RR, Abboud RT. Density mask: an objective method to quantitate emphysema using computed tomography. Chest 1988; 94:782–787. 7. Coxson HO, Rogers RM, Hogg JC, et al. A quantification of the lung surface area in emphysema using computed tomography [published correction appears in Am J Respir Crit Care Med 2001; 163: 1500 –1501]. Am J Respir Crit Care Med, 1999; 159:851–956. 8. Droege RT, Morin RL. A practical method to measure the MTF of CT scanners. Med Phys 1982; 9:758 –760.
9.
10.
11.
12.
13.
14.
15.
16.
17.
18.
19.
Boone JM. Determination of the presampled MTF in computed tomography. Med Phys 2001; 28:356 –360. Brown MS, McNitt-Gray MF, Mankovich NJ, et al. Method for segmenting chest CT image data using an anatomical model: preliminary results. IEEE Trans Med Imaging 1997; 16:828 – 839. Brown MS, Goldin JG, McNitt-Gray MF, et al. Knowledge-based segmentation of thoracic computed tomography images for assessment of split lung function. Med Phys 2000; 27:592–598. Brown MS, McNitt-Gray MF, Goldin JG, et al. Automated measurement of single and total lung volume from CT. J Comput Assist Tomogr 1999; 23:632– 640. Huber PJ. The behavior of maximum likelihood estimates under non-standard conditions. In: Proceedings of the Fifth Berkeley Symposium on Mathematical Statistics and Probability. Vol 1. Berkeley, Calif: University of California Press, 1967; 221–233. White H. A heteroskedasticity-consistent covariance matrix estimator and a direct test for heteroskedasticity. Econometrica 1980; 48:817– 830. Bushberg JT, Seibert JA, Leidholdt EM Jr, Boone JM. The essential physics of medical imaging. Baltimore, Md: Williams & Wilkins, 1994; 129 –131. Coxson HO, Hogg JC, Mayo JR, et al. Quantification of idiopathic pulmonary fibrosis using computed tomography and histology. Am J Respir Crit Care Med 1997; 155:1649 –1656. Miller RR, Muller NL, Vedal S, Morrison NJ, Staples CA. Limitations of computed tomography in the assessment of emphysema. Am Rev Respir Dis 1989; 139:980 – 983. Gevenois PA, Yernault JC. Can computed tomography quantify pulmonary emphysema? Eur Respir J 1995; 8:843– 848. Bergin C, Muller N, Nichols DM, et al. The diagnosis of emphysema: a computed tomographic-pathologic correlation. Am Rev Respir Dis 1986; 133:541–546.
Emphysema at CT: Effect of Reconstruction Algorithm
䡠
301