Empirical Study of the QoS Parameters Behavior of a VoIP Application in Wi-Fi Networks Josiane C. Rodrigues∗ , Simone G. C. Fraiha∗ , Jasmine P. L. Ara´ujo∗ , Herm´ınio Gomes∗ , Carlos R. L. Francˆes∗ and Gerv´asio P. S. Cavalcante∗ ∗ Institute
of Technology, Federal University of Par´a Bel´em Campus, Augusto Corrˆea Avenue s/n, Bel´em, Par´a, Brasil, Zip Code: 66075-900 Email:
[email protected],
[email protected],
[email protected],
[email protected],
[email protected],
[email protected]
Abstract— The use of wireless local area networks (WLANs), as well as the proliferation of the use of multimedia applications has grown fast in recent years. Some factors affect the quality of service(QoS) received by the user. The interference is an example. This work presents an empirical study of the QoS parameters of a VoIP application in the presence of an interference network, as well as the relevance in the design of wireless networks to determine the range of an access point, taking into account several parameters as power, jitter, packet loss, delay and PMOS.
I. I NTRODUCTION The wireless local area networks (Wireless Local Area Networks WLANs) IEEE802.11 have been large used in recent years due to their mobility, easy configuration and low cost deployment, so they have became an interesting alternative for industries, enterprises, among others. This technology, usually, supports data traffic generated by applications such as web browsing. In recent years, however, it has been used for voice communication, especially in offices [1]. The VoIP technology provides the transmission packages of voice over IP protocol, used inside the Internet, reducing significantly the cost of calls when compared with those carried out by public switched telephone network (PSTN). However, the VoIP application requires that WLAN must be able to support rigid QoS specifications for the voice transmission, it has been established in ITU-T(International Telecommunication Union) G.114 recommendation and [2]. Due to the rigid parameters requirements of the VoIP application, it has been evaluated in several testbeds [3]-[5]. The QoS parameters such as delay, jitter, packet loss and PMOS are important metrics of real-time multimedia communications. The delay is the time spent by a packet to travel between the transmitter and the receiver. Jitter is the variation of the delay time between two consecutive packets in the flow. The MOS is the average users’ opinions on the call quality and PMOS or the pseudo MOS is an analytical derivation of MOS, and it gives an indication of the user’s perception on the call quality. With the increase of the use of interactive multimedia services and broadband applications, the users opinion is being researched through the quality perspective [6]. In this paper the performance evaluation of the QoS parameters is done through a qualification factor, called Network Qualifier (NQ).
978-1-4244-5357-3/09/$26.00©2009IEEE
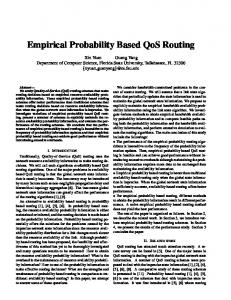
This is proposed to establish a methodology in designing the deployment of wireless networks in indoor environments. For this evaluation, two experiments were conducted following the same measurement procedure, but in different environments. In these experiments, two notebook computers create VoIP calls using the CallGen323 software [7], in each measuring point three calls were created with one minute of duration. The VoIP receiver notebook and the access point (AP) were connected to a protocol analyzer [8]. Suplementary applications were used to increase the traffic on the network. These applications provided file transfer during the transmission, generating 4 sessions of the http transfer using threads in the range of 10 microseconds (149 Kbytes). Finally, the Iperf software [10] was used as a second application running in client mode, creating UDP streams of specified bandwidth (7Mbps). To evaluate some QoS parameters behavior (jitter, packet loss, delay, and PMOS) versus distance, two situations were considered: the single network, i.e. without interference and at the presence of another network operating in the same frequency. This work is organized as follows: section II, has the environments where the measurements were made, section III, describes the procedure used in measuring, section IV defines the network qualifier and the methodology used, and section V presents the results. II. S CENARIOS AND M ETRICS The measurement campaigns were performed in two buildings at Federal University of Para (UFPA). The first one is a classrooms building, while the second is a building especially built for research laboratories and teachers’ rooms (Labs 1st Floor). In the next subsections these indoor environments will be presented. A. Classrooms Building In this measurement campaign the metrics were collected in the second floor of a building of the Federal University of Par´a. That building is made of bricks and concrete, with lateral glass windows while the other side there is a corridor along all the building, according to Fig. 1. In this building there are only classrooms, that are divided by walls built on bricks.
257
Fig. 1. Pictures of the building. In clockwise: external side with glass windows, classroom, corridor and external side with corridor along.
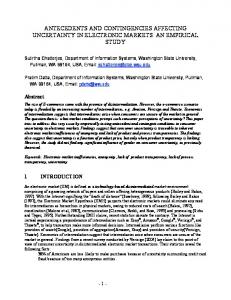
B. Research Laboratories The metrics are collected in a two-storey building made of bricks with rooms for Lectures, Computer and Telecommunication Labs and an anechoic camera, whose height occupies both the floors. The building has side glass windows with aluminum frames except the anechoic camera. The rooms are divided by walls built on bricks. The building is still empty and with no furniture. Fig. 2 shows photos of both floors.
Fig. 2. Pictures of the research laboratories building: corridors of the second and first floor, and laboratory classroom.
III. M EASUREMENT M ETHODOLOGY To establish the QoS parameters behavior with the distance, two measurement campaigns were conducted in two stages. In the first stage there was only a transmitter, in the second stage a second transmitter was installed serving as interference to the first one. In this section the stages will be described concerning to the research laboratories and to the classrooms building. 1) Measurement points and the access point positioning - some points were marked to perform the measurements. A total of 25 points were selected in the research
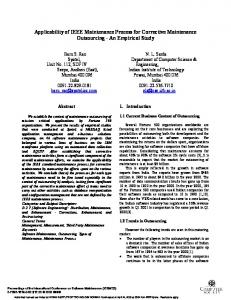
laboratories (only the first floor will be considered in this work) and 46 points in the classrooms building. Fig. 5 shows the layout of the research laboratories, with the location of the measurement points and the AP at the first floor (APT ). This network was called network under study; 2) Connection of the Network under Study - the architecture of the network under study (channel 7, central frequency of 2.442GHz) it is shown in Fig. 3, where APT is connected, through a cable to the protocol analyzer ethernet port. The second ethernet port is connected to a computer. This computer was used as a VoIP receiver, using CallGen323[7] software; 3) Traffic Generation at Network under Study - A notebook computer, located in the first plan in Fig. 3, was used to generate traffic in the WLAN network. Files were transferred to a server located at the cable network through APT . 4) VoIP Transmitter - to transmit the VoIP calls another notebook was used. It was located on a cart Fig. 4, and it was positioned in the selected measurement points; 5) Power Measurement - The cart carries also another notebook. The power measurement was done in each c software[9]. This point, through the Network Stumbler° notebook was necessary because the Network Stumc bler° , while in use doesn’t allow the connection of the computer to any WLAN. With the methodology and equipments described in the stages 1 to 5, the first phase of the measurement campaign was performed. In this case there was only a transmitter in the building in study. During the measurements, the following parameters were stored: received power (through the Netstumbler software), distance transmitter-receiver, jitter, delay, packet loss and PMOS (measured by the protocol analyzer). After that first measurement phase, a second one was performed using the same procedure of the first, but now, with the presence of another network using the same channel of the network under study, called interference network. The access point of the interference network was positioned in the second floor in the same direction of the network under study, APS in Fig. 5. The Iperf program[10] was used to generate traffic in the inteference network, it is allowed specify the time during which this traffic is generated. After this second measurement phase, the data were treated and compared to find a parameters variation in the presence of a interference network. The following section presents the results of those comparisons. The only difference among the procedures used at the two buildings is the application used to compete traffic with VoIP in the network under study. In Fig. 6 is showed the layout, the location of the measured points and the location of the access points to the classrooms building. IV. N ETWORK Q UALIFIER - NQ The qualifier proposed in this article (NQ) considers QoS standards defined through recommendations: delay - ITU-T G.114; jitter - ITU-T Y1540; packet loss - ITU-T Y.1541 and
2009 SBMO/IEEE MTT-S International Microwave & Optoelectronics Conference (IMOC 2009)
258
Fig. 3.
Network under Study.
Fig. 5. Layout of the research laboratories(first and second floor) with the location of the measurements points and APs.
Fig. 6. Layout of the classrooms building with the location of the measurements points and APs.
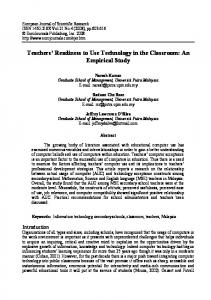
This NQ will be used in the analysis of the results of the measurement campaigns presented in this article. Fig. 4. The cart with notebook running Network NetStumbler (the lower side of the picture) and the notebook running VoIP calls (the upper side of the picture).
PMOS in [11]. Based on those reference values, the following thresholds were adopted: delay smaller or equal to 250ms; jitter smaller or equal to 30ms; packet loss smaller or equal to 1 %; and PMOS larger or equal 3. Through the use of those thresholds values a network qualifier was defined NQ: NQ =
A T
× 100%
(1)
A is the number of samples inside standardized by ITU-T threshold value and T is the total number of collected samples. Fig. 7 presents points with the values of packet loss obtained for each distance, with the threshold value of 1% represented by a dashed line. In Fig. 7(packet loss without interference network and at research laboratories), the NQ is equal to 64 %, i. e., in 16 measurement points, of the existent 25, the parameter packet loss is below the threshold of 1%.
V. R ESULTS An analysis of the collected data were performed to check which parameter produce more variation with distance. The NQ was used in this analysis. Figs. 8 and 9 show the network qualifier’s variation with the distance of each QoS parameter, for the research laboratories and classrooms building, respectively. From the Figs. 8 and 9 it is possible to observe that the most sensitive parameter with the distance is the packet loss. Moreover, it was observed that without the presence of the interference network, the WLAN under study has a suitable coverage and quality, it is because the values of all the QoS parameters are above the threshold 60%. This threshold limit depends on the designer’s decision and it means that each measured parameter should have 60% of the collected values satisfying the ITU-T standards. Another analysis was made comparing the measured data collected in the presence of the interference network. Figs. 10 and 11 show the network qualifiers’ behavior for each QoS parameter with the presence of interference network in the
2009 SBMO/IEEE MTT-S International Microwave & Optoelectronics Conference (IMOC 2009)
259
Classrooms building NQ − Jitter, P. Loss, A. Delay and PMOS without interf. (%)
Labs. 1st floor without interference network 9 Measurement points Threshold