Emulation of realistic network traffic patterns on an eight-node data vortex interconnection network subsystem Benjamin A. Small, Assaf Shacham, and Keren Bergman Department of Electrical Engineering, Columbia University in the City of New York, 500 West 120th Street, New York, 10027
[email protected]
Krit Athikulwongse, Cory Hawkins, and D. Scott Wills School of Electrical and Computer Engineering, Georgia Institute of Technology, 777 Atlantic Drive, N.W., Atlanta, Georgia 30332 R ECEIVED 2 AUGUST 2004; REVISED 20 S EPTEMBER 2004; ACCEPTED 1 O CTOBER 2004; PUBLISHED 18 O CTOBER 2004
We demonstrate the feasibility of the data vortex interconnection network architecture for use in supercomputing by emulating realistic network traffic on an eight-node subnetwork. The evaluation workload uses memory accesses from the Barnes–Hut application in the SLPASH-2 parallel computing benchmark suite, which was extracted by using the M5 multiprocessor system simulator. We confirm that traffic is routed correctly and efficiently. © 2004 Optical Society of America OCIS codes: 060.0060, 060.2310, 060.2360.
1.
Introduction
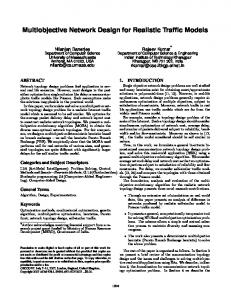
Large-scale high-performance computing systems require processor–memory communication that is both high bandwidth and low latency. Optical interconnections are capable of transmitting terabits of bandwidth per second when full dense wavelength-division multiplexing (DWDM) is used, and they have recently been considered as possible solutions to the electronic communications bottleneck in interconnection networks [1–3]. However, maintaining low latencies while achieving high bandwidth can often be challenging since optical networks provide no convenient buffering, which is required in most conventional network topologies [1, 3]. A novel deflection routing scheme has been developed explicitly for the purpose of realizing an optical network that does not require optical buffering and that also eliminates the need for numerous costly optical–electrical conversions and complex network arbitration [4, 5]. The data vortex optical switching topology is composed entirely of 2 × 2 self-routing deflection nodes, which can be easily implemented with high-speed logic devices and basic fiber-optic components. These simple nodes are arranged so that deflection routing is possible within a butterfly-like address resolution tree. Detailed descriptions of the data vortex architecture and its functionality and behavior can be found in prior publications [4, 6–11]. A 12 × 12 data vortex network requires 36 individual switching elements and can be used to connect six CPU nodes and six memory block nodes, as shown in Fig. 1. However, an eight-node subnetwork can be constructed to demonstrate the fundamental operating features of the data vortex architecture [7]. Although not entirely deterministic, a careful study of traffic flow patterns within the data vortex architecture can determine the paths of packets based upon their source and destination locations, taking into account interactions with adjacent packets in the network.
© 2004 Optical Society of America JON 4941 November 2004 / Vol. 3, No. 11 / JOURNAL OF OPTICAL NETWORKING
802
Fig. 1. Diagram of the data vortex interconnection network as the intermediary between
Fig. 1. Diagram of the Data interconnection six CPUVortex elements and six memory blocks. network as the intermediary between six CPU elements and six memory blocks. To utilize a realistic supercomputing interconnection network traffic workload, we obtained processor–memory accesses from an application in the SPLASH-2 benchmark suite [12, 13]. This application set includes several scientific programs and kernels expressed with explicit thread parallelism. These programs are simulated on the M5 parallel simulator assuming six processor nodes and six memory nodes. Each processor can access both a private memory (for code, stack, and local data) and a shared global memory; no caching is modeled for the shared address space [14]. The threads can synchronize and communicate with each other using the shared memory address space. This methodology captures the behavior of shared memory parallel execution, providing message traffic typically found in a similarly configured multiprocessor system. The resulting trace file was studied to determine the traffic flow that would interact with an ideal eight-node subnetwork. The filtered and processed messages were then used to generate the packet injection patterns for the eight-node data vortex subnetwork. 2.
Data Vortex Switching Nodes
A complete 12 × 12 data vortex structure contains 36 switching nodes, but a subset of eight nodes, as shown in Fig. 2, demonstrates the fundamental features of the architecture, including deflection routing, virtual packet buffering, and multiple-header WDM addressing [7, 8]. The implemented eight-node subnetwork contains a complete deflection loop of a data vortex cylinder (nodes 2, 3, 4, 5, 6, and 7) in addition to two emulated input nodes from an upstream cylinder of the topology (nodes 0 and 1); nodes 2 and 6 also function as output ports. The packets’ header fields, which correspond to the destination node address, are encoded in parallel as single bits in each of the header WDM channels. Each cylinder (as shown in Fig. 2) decodes exactly one of these header signal wavelengths in addition to the packet frame. Because only the outer and middle cylinders have been implemented, only two address wavelengths are necessary. Thus header 0 determines whether packets are to progress to the inner cylinder at node 0 or node 1 or deflect out of the subnetwork. The packet’s destination address is encoded in the header 1 bit. In this implementation, exits are available only through nodes 2 and 6. Furthermore, deflections are always possible if a downstream node has reserved a particular node for routing or for deflection, preventing packet collisions. Deflected packets stay within the same cylinder until they are permitted to ingress toward the output nodes. Traffic outside the subnetwork can therefore be mimicked by externally generating the appropriate control signals. Although this subsystem is small compared with the envisioned thousand-port data vortex structures, it demonstrates the important data vortex network features and can illustrate the efficacy and efficiency
© 2004 Optical Society of America JON 4941 November 2004 / Vol. 3, No. 11 / JOURNAL OF OPTICAL NETWORKING
803
with which supercomputing network traffic patterns would be routed. Each of the data vortex switching nodes contains five major subsystems: the couplers and filters required to isolate the frame and header wavelengths and to provide the 2 × 2 pathway configuration; a delay line for the packet while the address is being processed; two photodetectors for the frame and header signals; high-speed electronics for processing the routing logic; and two semiconductor optical amplifiers (SOAs) to execute the routing decision and to compensate for coupler losses [4]. These subsystems are illustrated in Fig. 3. The optoelectronic and electronic devices are integrated onto a single printed circuit board (PCB) to reduce latency, size, and possible noise. Optical data enters the node at either of the input ports; it is then split at the optical coupler module, and one of the wavelengthbased routing headers and the frame are filtered off and directed to the photodetectors. The frame and header bits are processed, and, in conjunction with the input control signal, the routing logic results in either one or the other of the output SOAs being turned on, directing the packet to the east output port or the south output port. Finally, an appropriate deflection signal is also generated for use in an upstream node. The packet itself is not affected by the routing procedure, except for a small amount of noise introduced by the SOAs [6], and all header information is preserved. In fact, the entire address field carried by the packet remains unchanged throughout the routing path, but the particular header wavelength filtered changes from cylinder to cylinder in accordance with the hierarchical topology of the data vortex .
Fig. 2. Three-dimensional topological graph of the 12 × 12 data vortex and the impleFig. 2. Three-dimensional topological graph of the 12×12 Data Vortex and the implemented 8-node
mented eight-node system accentuated. Green edges represent deflection path fibers; blue edges, ingression path fibers; red lines, control signals. Implemented are drawnpath fibers, red system accentuated. Green edges represent deflection path fibers, blue connections edges ingression thicker.
lines control signals; implemented connections are drawn thicker. 3.
Experimental Setup
The experimental test bed contains the eight implemented switching nodes, an input packet generation and injection subsystem, and the necessary test and measurement equipment, as diagrammed in Fig. 4. The data timing generator (DTG) drives the SOAs so that they either modulate continuous waveform (CW) light emitted by a tunable laser bank or gate a 10-Gbps pseudo-random bit sequence payload. In addition, artificial deflection signals are also generated to emulate traffic external to the subnetwork. After the DTG is programmed with appropriate sequence on each of its output channels, it modulates the frame, header,
© 2004 Optical Society of America JON 4941 November 2004 / Vol. 3, No. 11 / JOURNAL OF OPTICAL NETWORKING
804
l
Fig. 3. Schematic of a data vortex switching node with SOAs driven by electrical current
Fig. 3. Schematic of a Data Vortex switching node with SOAs driven electrical signals (shown in red) and input and output control signals (redby arrows). λF current and λH signals are 50-GHz optical filters; O/E represents p-i-n photodetector modules; and isolators follow
(shown in and input and output control signals (red arrows). λF and λH are 50-GHz optical filters; thered) SOAs. O/E represents p-i-n photodetector modules; and isolators follow the SOAs.
payload, and optional label wavelengths and generates deflection signals to emulate the flow of traffic through the subnetwork. The resulting optical signals are coupled, as shown, to form WDM packets. The two independent frame signals allow for packets to be injected at either, neither, or both of the input nodes. The optical packets are injected into input ports 0 and 1, and the electronic deflection signals are used at nodes 2 and 6. An additional “label” signal is used to verify correct routing: Since the label wavelengths differ from the header and frame wavelengths, an optical spectrum analyzer can be used to determine the presence of misrouted packets. The subnetwork output can also be connected to a tunable filter and an optical communications signal analyzer so that individual signals can be viewed.
Fig. 4. Schematic of the experimental setup, with a bit error rate tester (BERT), a commuFig. 4.nications Schematic of the experimental a bitgenerator error rate(DTG), tester (BERT), a communications signal analyzer (CSA),setup, a datawith timing a pulse pattern generator (PPG), and an optical spectrum analyzer (OSA). signal analyzer (CSA), a data timing generator (DTG), a pulse pattern generator (PPG), and an optical spectrum analyzercorrect (OSA).routing by the nodes and correct generation of control signals, a test To confirm
sequence that contains all possible routing and deflection situations was generated. The designed test sequence utilizes all input and output ports while deliberately causing packet deflections, verifying that the subnetwork is functioning properly. While this test sequence is useful for ensuring the validity of the empirical setup, it is a poor representation of ordinary supercomputing interconnection network traffic patterns. Figure 5 illustrates the test sequence and the corresponding output patterns, which perfectly match the a priori predicted results. For example, it can be seen that packets (which necessarily have either frame 0 or frame 1 or both) with header 1 exit at node 2, while packets without header 1 exit at node 6, having been delayed by the propagation through the switching elements. Deflection signals are also seen from node 2 and node 7 when packets contend for node 6
© 2004 Optical Society of America JON 4941 November 2004 / Vol. 3, No. 11 / JOURNAL OF OPTICAL NETWORKING
805
.
or node 2, respectively. Depending upon which path was traversed, packets pass through between 2 and 7 nodes, and the latency of each packet is measured to be between 46 and 220 ns. Previous publications [6, 7, 9, 10] have confirmed that WDM packets can traverse many more hops through nearly identical nodes while maintaining 10−12 bit error rates.
Fig. 5. Input and output signals for the test sequence, showing input frames (F0 and F1),
Fig. 5. Input and output(H0 signals for the sequence, input frames (F0 andlatency F1), input input headers and H1), andtest output packetsshowing (at nodes 2 and 6). Network is headers marked: the red cursors indicate the 7-hop latency from input node 0 to output node 2, and
(H0 and H1), and cursors output show packets nodes 2 and 6). Network latency is output marked: the2.red cursors indicate the blue the(at 2-hop latency between input node 1 and node the 7-hop latency from input node 0 to output node 2, and the blue cursors show the 2-hop latency 4. input Emulation between node 1Procedure and output node 2.
Elements of the SPLASH-2 benchmark suite were executed on the M5 multiprocessor system simulator, which was configured to emulate a six-processor shared memory system. Barnes–Hut, which calculates the interactions between physical bodies in space, was selected as an appropriate example of a supercomputing application [15]. The M5 simulator was modified to record all processor and memory accesses in a trace file, annotating the access times, processor numbers, and memory addresses. Instruction accesses and any interactions involving only a single processor were removed since they would not affect the interconnection network. Five thousand contiguous messages from the Barnes–Hut trace were then filtered so that the messages could be “mapped” onto the eight-node subnetwork. Since only two input ports and two output ports are available, the processors and memory locations that affect this subnetwork are limited. For this experiment, only nodes 0 and 1 behave as emulated packet sources, although artificial control signals are generated for nodes 2 and 6, which mimic the presence of other packets being deflected in nearby nodes. The packet destinations are memory blocks that are arranged in a manner not uncommon in contemporary supercomputer applications [1]. Furthermore, to provide the data vortex subnetwork with a more challenging bandwidth figure, the packet injection rate is accelerated, while the packet order and the traffic flow pattern are maintained. The 5000-line trace fragment was analyzed, and the messages that would interact with the eight-node subnetwork were used for the experiment while the others were dropped. The selected data were processed and decoded so that the appropriate frame and header signals could be generated, as diagrammed in Figs. 6 and 7. Packets are constructed with a length of 28.6 ns and a dead time between packets of 6.1 ns; these figures are optimized
© 2004 Optical Society of America JON 4941 November 2004 / Vol. 3, No. 11 / JOURNAL OF OPTICAL NETWORKING
806
for this particular implementation of the data vortex subnetwork. For this experiment, the DTG repeats the packet sequence so that the relevant statistics can be recorded in real time.
Flow chart of the mapping and emulation procedure. Fig. 6. Flowchart ofFig. the 6. mapping and emulation procedure.
Fig. 7. Four lines from the Barnes–Hut message trace (left, with time stamps, sources, and Fig. 7. Four linesdestinations) from the Barnes-Hut message tracesignal (left, with sources, and memory memory with the corresponding outputtimestamps, used to generate packets. Only cpu0 and cpu1 fall within the subnetwork, but cpu4’s signal causes an artificial deflection destinations) with the corresponding signal output used to generate packets. Only cpu0 and cpu1 fall signal to be generated for node 2 at the appropriate time. Because more than ten time units passsub-network, between messages, a blank packet is sent at slot B.deflection signal to be generated for node within the but cpu4’s signal causes an artificial
2 at theInappropriate time.this Because more than time units pass messages, a blankflow. packet is constructing emulation, few10 assumptions are between made about the packet The
mimicked sent at slot B. control signals, however, are generated on the basis of an understanding of traffic flow in a moderately loaded data vortex network [16]. Also, the timing of the traffic was accelerated beyond rates that can be achieved with conventional CPU and memory elements, although the patterns and sequences were maintained. Generally, all aspects of the emulation were made to be as realistic and meaningful as possible. The focus of the emulation is on ensuring that realistic supercomputer traffic patterns are routed correctly and efficiently on the data vortex interconnection network architecture. 5.
Emulation Results
A functional algorithm was constructed to predict the routing results of the emulated network traffic. The signal analyzer confirms that all 5000 packets route correctly and that the appropriate deflections and address decoding are observed. The constructed eight-node data vortex subnetwork is therefore shown to route this emulated realistic supercomputing traffic successfully. Figure 8 displays the input traffic patterns and the corresponding output sequence. Because of the 5000-message portion of the Barnes–Hut algorithm used for the emulation, the duty cycle of each destination node is not perfectly balanced, as is likely in a real supercomputing system. This imbalance is not a manifestation of an empirical error but is instead an artifact of the message trace used. Moreover, the routing results were confirmed to be correct on the basis of an a priori model.
© 2004 Optical Society of America JON 4941 November 2004 / Vol. 3, No. 11 / JOURNAL OF OPTICAL NETWORKING
807
Fig. Optical signals corresponding to the subnetwork input (at1)nodes 0 and 1) and Fig. 8. 8. Optical signals corresponding to the sub-network input (at nodes 0 and and output packet output packet sequences (nodes 2 and 6) for the emulated realistic supercomputer traffic sequences (nodes 2 and 6) for the emulated realistic supercomputer traffic patterns. The right frame patterns. The right frame shows a more detailed view of a 40-packet segment within the 5000-message sequence F1, H0, segment H1, output 2, output node 6) to(F0, validate shows a more detailed view (F0, of a 40-packet withinnode the 5000-message sequence F1, H0,the routing functionality. H1, output node 2, output node 6) to validate the routing functionality.
6.
Conclusions
It has been demonstrated that the data vortex architecture is a feasible candidate as an optical interconnection network for realistic supercomputing traffic. Packets were routed correctly and efficiently through the implemented switching nodes while emulating traffic patterns generated from the SPLASH-2 parallel computing benchmark executed on the M5 multiprocessor system simulator. Prior studies have demonstrated the ease with which the data vortex topology can be scaled to systems with 1000 s of processor and memory elements. Because it requires no optical buffering, the packet latencies would be limited only by the optical time of flight while providing the terabits per second of bandwidth necessary for high-performance computing applications. Acknowledgments
This work was supported by the Department of Defense (contract MDA904-03-C-0471) and in part by the National Science Foundation (ECS-0 322 813). The authors thank Odile Liboiron-Ladouceur and John P. Mack for their contributions to the design of the implemented switching nodes. References and Links [1] W. J. Dally and B. Towles, Principles and Practices of Interconnection Networks (Morgan Kaufmann, San Francisco, Calif., 2004). [2] G. P. Agrawal, Fiber-Optic Communication Systems, 3rd ed. (Wiley, New York, 2002). [3] R. Ramaswami and K. N. Sivarajan, Optical Networks: A Practical Perspective, 2nd ed. (Morgan Kaufmann, San Francisco, Calif., 2002). [4] Q. Yang, K. Bergman, G. D. Hughes, and F. G. Johnson, “WDM packet routing for highcapacity data networks,” J. Lightwave Technol. 19, 1420–1426 (2001). [5] C. Reed, “Multiple level minimum logic network,” U.S. patent 5,996,020 (30 November 1999). [6] W. Lu, O. Liboiron-Ladouceur, B. A. Small, and K. Bergman, “Cascading switching nodes in the data vortex optical packet interconnection network,” Electron. Lett. 40, 895–896 (2004). [7] W. Lu, B. A. Small, J. P. Mack, L. Leng, and K. Bergman, “Optical packet routing and virtual buffering in an eight-node data vortex switching fabric,” IEEE Photon. Technol. Lett. 16, 1981– 1983 (2004). [8] Q. Yang and K. Bergman, “Traffic control and WDM routing in the data vortex packet switch,” IEEE Photon. Technol. Lett. 14, 236–238 (2002).
© 2004 Optical Society of America JON 4941 November 2004 / Vol. 3, No. 11 / JOURNAL OF OPTICAL NETWORKING
808
[9] B. A. Small, J. N. Kutz, W. Lu, and K. Bergman, “Characterizing and simulating the performance of the physical layer of data vortex switching nodes,” in Proceedings of the 16th Annual Meeting of the IEEE Lasers and Electro-Optics Society (LEOS) (IEEE, 2003), Vol. 1, pp. 59–60. [10] O. Liboiron-Ladouceur, W. Lu, B.A. Small, and K. Bergman, “Physical layer scalability demonstration of a WDM packet interconnection network,” in Proceedings of the 17th Annual Meeting of the IEEE Lasers and Electro-Optics Society (LEOS) (IEEE, 2004), paper WM3. [11] G. I. Papadimitriou, C. Papazoglou, and A. S. Pomportsis, “Optical switching: switch fabrics, techniques, and architectures,” J. Lightwave Technol. 21, 384–405 (2003). [12] J. M. Arnold, “The SPLASH-2 software environment,” J. Supercomput. 9, 277–290 (1995). [13] S. C. Woo, M. Ohara, E. Torrie, J. P. Singh, and A. Gupta, “The SPLASH-2 programs: characterization and methodological considerations,” in Proceedings of the 22nd Annual International Symposium on Computer Architecture (ISCA) (IEEE, 1995), pp. 24–36. [14] N. L. Binkert, E. G. Hallnor, and S. K. Reinhardt, “Network-oriented full-system simulation using M5,” presented at the Sixth Workshop on Computer Architecture Evaluation Using Commercial Workloads (CAECW), Anaheim, Calif., 2003. [15] J. P. Singh, J. L. Hennessy, and A. Gupta, “Scaling parallel programs for multiprocessors: methodology and examples,” Computer 26, 42–50 (1993). [16] Q. Yang and K. Bergman, “Performances of the data vortex switch architecture under nonuniform and bursty traffic,” J. Lightwave Technol. 20, 1242–1247 (2002).
© 2004 Optical Society of America JON 4941 November 2004 / Vol. 3, No. 11 / JOURNAL OF OPTICAL NETWORKING
809