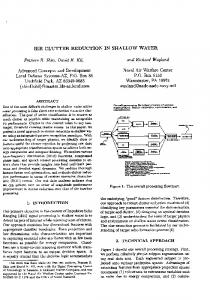
IEEE TRANSACTIONS ON VISUALIZATION AND COMPUTER GRAPHICS, VOL. 12, NO. 5, SEPTEMBER/OCTOBER 2006
Enabling Automatic Clutter Reduction in Parallel Coordinate Plots Geoffrey Ellis and Alan Dix Abstract— We have previously shown that random sampling is an effective clutter reduction technique and that a sampling lens can facilitate focus+context viewing of particular regions. This demands an efficient method of estimating the overlap or occlusion of large numbers of intersecting lines in order to automatically adjust the sampling rate within the lens. This paper proposes several ways for measuring occlusion in parallel coordinate plots. An empirical study into the accuracy and efficiency of the occlusion measures show that a probabilistic approach combined with a ‘binning’ technique is very fast and yet approaches the accuracy of the more expensive ‘true’ complete measurement. Index Terms—Sampling, random sampling, lens, clutter, occlusion, density reduction, overplotting, information visualisation, parallel coordinates.
1
INTRODUCTION
In previous work [4, 5] we proposed that random sampling can be used as an effective technique for density reduction in overcrowded displays. We argue that if there is too much data to fit on the screen, then taking a random sample of the data that will fit, not only removes overlapping data items and clutter but it also tends to preserve any trends or patterns that exist in the data. Unlike other clutter reduction techniques, such as filtering based on chosen attributes, random sampling does not require the user to decide on the criterion for which data to remove or keep and the view remains spatially undistorted. Recent work [6] demonstrated the Sampling Lens, a focus+context technique that allows sub-sampling and consequently clutter reduction in high density areas whilst retaining a highersampling rate over the visualisation as a whole. This technique has been applied to both simple point plots and parallel coordinate plots. In practice, the sub-sampling rate of the lens needs to be changed as one moves from high density regions to less heavily plotted regions of the visualisation. This can be done manually using a slider, but to facilitate this process, an autosampling system was proposed which attempts to obtain a constant level of ‘density’ as the lens is moved over the visualisation. To implement autosampling we need (i) an effective measure of ‘clutter’ or ‘density’ that can be set by the user and maintained by the system, and (ii) an efficient way of calculating the measure during interactive movement of the lens. We addressed the former issue in a previous paper [7], by considering several potential metrics to estimate the occlusion or overlap of lines in parallel coordinate plots. In this paper, we will address the latter issue by developing several ways of calculating occlusion that range from very direct methods based on the data, to more model-based methods using theoretical approximations. Interestingly, we find that the most simplistic model yields surprisingly good results and is also very cheap to calculate. Section 2 presents the background to this work by looking at the concept of sampling and the Sampling Lens tool. Section 3 gives an overview of the related literature on clutter reduction techniques, focussing primarily on those techniques used in parallel coordinates. In Section 4, we describe our experimental platform and the dataset used for the empirical study. Section 5 provides the theory behind our occlusion measures. We discuss the results of the empirical study into the accuracy and efficiency of the measures in Section 6 and choose the ‘best’ algorithm. In Section 7 we investigate some of the • Geoffrey Ellis is at Lancaster University, E-Mail:
[email protected]. • Alan Dix is at Lancaster University, E-Mail:
[email protected]. Manuscript received 31 March 2006; accepted 1 August 2006; posted online 6 November 2006. For information on obtaining reprints of this article, please send e-mail to:
[email protected].
limits of this algorithm and show how a simple modification in its application copes with extreme cases and finally in Section 8 we present our conclusions and suggestions for future work. Please note that when we use the term sampling in this paper, we are referring to a random sample of the data. 2
BACKGROUND: SAMPLING AND THE S AMPLING LENS
We have found sampling to be a powerful technique in several kinds of visualisations that require individual data items or attributes to be represented on the display. By interactively adjusting the level of sampling, the data density of a visualisation can be reduced to reveal features that are otherwise hidden in the mass of points or lines in dense regions. This is particularly useful for tasks where the user is exploring large datasets. Often, visualisations are not uniformly dense, consequently the low sampling rate required to investigate denser regions can make the data in less dense regions ‘vanish’; this is often the case with outliers. A potential solution is to adjust the sampling rate for different areas of the screen [2] just like adjusting the contrast levels on a photograph. We have proposed an alternative technique namely the Sampling Lens [6] − a moveable region with its own sampling control. This follows a tradition of visualisation ‘lenses’ [3] that apply transformations or add information to the area under focus, similar to passing an x-ray glass over the display. The Sampling Lens simply sub-samples the points within the region under the lens (see Figure 1 in Section 4). The user can therefore investigate dense regions of a plot by reducing the lens sampling rate to an appropriate level. This can potentially uncover interesting patterns and trends whilst still retaining the context of the lens region within the overall plot. In addition to its sampling control, which incidentally is relative to the overall sampling rate, the user can alter the size of the lens, choose its shape (circle, square or rectangle) and drag it around the display with the mouse. In addition, the user can easily request new random samples within the lens, thus ‘real’ patterns will persist whilst sampling induced artefacts will disappear. This also means that outliers will be shown at some stage. A more detailed description of Sampling Lens can be found in [6]. 2.1 Auto-sampling Manually adjusting the sampling rate of the lens was found to be particularly tiring for the user. A more desirable option was for the system to set the lens sampling rate automatically, based on a measurement of the density of the points or lines within the lens. This was fairly straightforward for scatterplots1 as only the number of data items at each display point had to be counted in order to estimate the density. However for parallel coordinate plots, the 1 Although it becomes more difficult if the data points are larger than a pixel and hence partial occlusion of points has to be taken into account.
IEEE TRANSACTIONS ON VISUALIZATION AND COMPUTER GRAPHICS, VOL. 12, NO. 5, SEPTEMBER/OCTOBER 2006
density estimation was more challenging, especially as little information was found in the literature on this topic. It should be noted that the user can set the ‘desired density’ if they wish and thus have some control on what they consider to be cluttered. Our first attempt at estimating density in a parallel coordinate plot was based on a statistical approach, which was fed with data on the calculated overlap of lines in the lens. This is later referred to as the lines algorithm (see Section 4). While this method was reasonably good in some regions of the plots, in others, the behaviour of autosampling was not satisfactory and therefore we felt it was necessary to come up with a better method that provides both an effective measure of ‘clutter’ and an efficient way of calculating it. 3
RELATED WORK
Techniques for clutter reduction include filtering, distortion, clustering, aggregation, reordering, space filling, constant density and random sampling and these are well documented in the research literature. However, the majority of these techniques do not attempt to measure clutter, but they rely on the user to adjust some controls in order to reduce the clutter. Exceptions are Woodruff’s constant information density application [14] that does attempt to measure data density, albeit very simply, and Bertini & Santucci [2] who measure overplotting in sub-regions of scatterplots as part of their quality metric and subsequent clutter reduction using non-uniform sampling. Previous work on reducing clutter in parallel coordinates has applied methods such as reordering, clustering, attribute combination and transparency. Peng et al [10] utilise dimensional reordering to minimise the impact from outliers, which they argue obscure any inherent structure from clustered lines. They define the clutter measure in terms of closeness of lines, so a line without a neighbour within a certain threshold is treated as an outlier. Another technique is hierarchical clustering [9,15] which constructs a tree of nested clusters of lines, also based on proximity information. The user can decide on the level of detail displayed and with appropriate use of transparency, the mean and extent of each cluster can be readily seen. This helps to differentiate between clusters; in addition, proximity-based colouring aids the separation. As with all aggregate functions, this technique tends to remove the detail, but one can see trends in an otherwise saturated display. Wegman and Luo [13] also use transparency to identify regions of high overplotting through their dense colour. Artero et al [1] use clustering to reduce visual clutter. Their algorithm uses frequency data, based on counting coincident lines and then smoothes the data to produce a ‘density map’, which has the effect of grouping lines that are fairly close to each other as well as those that are coincident. The lines are shaded to visually identify those that are in higher density regions. Note that, no attempt is made to measure the occlusion of the lines. VizCluster [16] approaches the clutter issue of high dimensional data by combining adjacent dimensions, thus reducing the complexity of the display. As far as we are aware, Anisotropic Volume Rendering [12] has not been applied to parallel coordinate plots. However, this novel approach from the world of scientific visualisation and computer graphics reduces the clutter of 3D visualisations consisting of a huge number of lines by converting shaded lines into anisotropic voxels. The authors claim significant speed enhancement, reduction in storage space and good level of detail; a promising approach to try on parallel coordinate plots perhaps. 4
for each pixel. The application can be automated so it steps through a range of lens sampling rates and raster cell-widths and saves the results in a useful file format for further analysis. The data used in most of the experiments is from the Portland cars dataset [31/3/05 http://www.cars.com]. The 5850 records contain details of cars for sale within 40 miles of Portland, Oregon. The attributes on the parallel coordinates plots shown in Figure 1 are, from left to right: year of manufacture, price, mileage, and vehicle type (given as an integer code). The highest values are at the top of the axes.
DATASET AND EXPERIMENTAL PLATFORM
The implementation of the Sampling Lens application in Java is based on the InfoVis Toolkit [8], which has been augmented with additional code to provide the sampling lens functionality in both parallel coordinate plots and scatterplots. The experiments used an instrumented version of the Sampling Lens that collects statistics about the measures being investigated. It is also capable of producing a real-time variable cell-width raster grid showing the overplotting
Figure 1. Parallel coordinate plot using 1K car dataset (labels and lens positions for exp2 & exp3 are superimposed)
Figure 1 shows a screen shot of the parallel coordinate visualisation based on 1000 records of the cars dataset. The majority of our experiments used this randomly produced subset because details in this dataset are only visible at sampling rates that are less than 15%. So, we are pre-sampling to stretch this data range for illustration purposes. However, further experiments were conducted on the full dataset (and other datasets up to 10000 records) to verify that the results scale up. Note that, we have made no attempt here to re-organise the attributes in order to minimise occlusion. exp1 exp2 exp3
Figure 2. Lines within the lens at a 10% lens sampling rate
The lens positions for the main experiments (exp1, exp2, exp3) referenced in this paper are shown in Figure 1. These positions were chosen to exemplify different patterns of lines crossing the lens, as illustrated in Figure 2. exp1 has a large proportion of the lines crossing each other at large angles, exp2 has many of the lines ending at a single point, while exp3 has many lines crossing at narrow angles. Note that, further experiments have been conducted with the lens at many positions and on additional real and simulated data sets to verify the generality of observations, but we only describe selected experiments that cover critical issues in detail here. Furthermore, we have experimented with other lens shapes, but users are more comfortable with the ‘spy glass’ circular lens.
ELLIS ET AL: ENABLING AUTOMATIC CLUTTER REDUCTION IN PARALLEL COORDINATE PLOTS
5
METHODS FOR CALCULATING OCCLUSION
In order to implement autosampling, we need both a measure of ‘clutter’ and an efficient way of calculating this measure. But to have a computationally tractable measure, we decided to use fairly simple measures based on hidden or occluded data items, as it is important that the user is aware of the proportion of data that is not visible. If we can measure the occlusion, then we can iteratively adjust the lens sampling rate to give a desired density. Even better, if we can predict the occlusion for any given sampling rate, we can choose the sampling rate directly without the expense of an iterative procedure. In a previous paper [7], we looked at several potential metrics to measure occlusion in different ways. From empirical studies and through developing a mathematical model, we found that the metrics were in fact functionally related and can thus be used interchangeably. Hence in this study, the simplest metric is chosen, which we have called overplotted% − the percentage of plotted pixels with more than one point plotted on them. Note, a plotted point means a point on a line from a single record in the data per se. Because of overplotting, the number of pixels with one or more plotted points is less than the total number of plotted points. In this section we define overplotted% precisely and describe three different ways in which we have calculated overplotted%, from a very direct data-driven pixel counting method to a more modelbased approach embodying simplifying assumptions about the data. In brief, the methods are: raster algorithm – This rasterises the lines on a grid of a given cellwidth (in pixels) and counts the number of plotted points on each grid cell to get an estimate of overplotted%. In the case when the cell-width is 1 pixel, this corresponds exactly to the desired value. It is thus the ‘gold standard’ as it is based on the actual overlap of the lines being displayed. random algorithm – This treats every plotted point as if it were randomly placed in the viewable pixels and calculates the overplotted% using probability. Here, only the number of plotted points comes from the data; everything else is based on the theoretical model. lines algorithm – This estimates the intersection volumes of all the lines crossing the lens. This is partly data-driven in that it uses actual lines, but is partially model-based in the way the line overlaps are combined to give an overall overplotted% value. Later in this section we will look at each of these algorithms in more detail then in Section 6, we will see how they compare using actual data. 5.1 Some definitions In order to be precise about our occlusion metric and algorithms we need some basic definitions. For a given screen region (in particular the interior of the sampling lens) we write S for the total number of available pixels and M for the number of plotted data points. In general, M is not the number of actual pixels with points plotted on them as some points will be overplotted on the same pixel, so the number of plotted pixels is usually less than the number of plotted points. We then define the following raw values: M1 – number of plotted points on their own pixel Mn – number of plotted points sharing a pixel S0 – number of empty pixels S1 – number of pixels with 1 plotted point (same as M1) Sn – number of pixels with more than 1 plotted point Note that M = M1 + Mn and S = S0 + S1 + S n and always M1 = S1, but Mn ≥ 2*Sn as each overplotted pixel contains two or more overplotted points. Figure 3 shows an example of these values for a simple 3x3 plot. Note too in this example there are 2 records, giving rise to 2 lines with 3 plotted points per line, so there are 6 plotted points in total (M), but only 5 pixels containing plotted points (S1 + Sn).
An example of a 3x3 pixel section of the screen with a horizontal and a vertical line crossing at the centre. M = 6, S = 9 M1 = 4, Mn = 2 S0 = 4, S 1 = 4 and Sn = 1 Figure 3. Example of overplotting
5.2 Occlusion metric – overplotted% defined We can then define our occlusion metric as: overplotted% = 100 * Sn / (S 1 + Sn) In other words, overplotted% is the percentage of plotted pixels with more than 1 plotted point. The range is 0% (all plotted points on their own) to 100% (no single plotted points). In the example in Figure 3 this is: overplotted% = 100 * 1 / (4 + 1) = 20 We will now look at the three different algorithms we have developed to calculate overplotted% in more details. 5.3 Raster algorithm This is clearly the simplest method and the only one that corresponds directly to the desired measurement. In effect this amounts to emulating the action of the graphics processing in drawing the lines across the area of the lens. This could be achieved by using the graphics processor’s own line drawing, but is itself often slow for very high line densities. Single pixel counting is even slower; hence we have looked at using raster grids greater than 1 pixel wide in order to reduce the calculation time. Now, a given line will cross a greater proportion of the grid cells when the cells are larger – the proportion of cells crossed being on average proportional to the grid size. Therefore, in order to maintain the correct proportions, we can sub-sample the lines when using coarser grids. This together with fewer grid cells ‘plotted’ per line results in a roughly N2 speed increase with larger cell sizes.
Figure 4. Accuracy of different raster cell-widths
Figure 4 shows how these approximations match up with different grid sizes. Note that the ‘adjusted’ number of plotted points refers to those plotted on a 1-pixel grid. The actual number of grid cells ‘plotted’ is lower because of both the sub-sampling of lines and the larger grid size. In terms of accuracy, only the coarsest grid size of 16 pixels (leading to around 35 grid cells on a 100 pixel diameter lens) shows any deviation from the ‘true’ 1 pixel grid. The unevenness of the lines for cell width 8 and 16 is due to greater random variation with smaller numbers of ‘plotted’ grid cells. Graphs for other lens areas show similar behaviour. The resulting significant increase in calculation speed is discussed in Section 6.2.
IEEE TRANSACTIONS ON VISUALIZATION AND COMPUTER GRAPHICS, VOL. 12, NO. 5, SEPTEMBER/OCTOBER 2006
5.4 Random algorithm For our second algorithm we simply assume that all the points on all the lines are individually randomly scattered over the available pixels. Given this very simplistic model, the number of points plotted in each pixel follows the binomial distribution where p, the probability of a single point being plotted in a particular pixel is 1/S. Hence, we can calculate expected values for the different raw values as follows: E( M1 ) = M (1–p)M–1 E( Mn ) = M – E(M1) = M (1 – (1–p)M–1) E( S0 ) = S (1–p)M E( S1 ) = S *M (p) (1–p)M–1 = M (1–p)M–1 E( Sn ) = S – (E(S 0) + E(S 1)) (M1, Mn etc. have been defined in Section 5.1) A value for the overplotted% can be obtained from: overplotted% = 100 * (1–((1–p)M + M/S (1–p)M–1))/(1– (1–p)M) This algorithm is very cheap to calculate, as it only requires an estimate of the total number of points to be plotted. However, it is the least realistic, basically treating each line as a collection of points to be randomly distributed over the available pixels.
accuracy, this would lie somewhere between the raster and the random algorithm. 6
COMPARING OCCLUSION ALGORITHMS
We compared the above three algorithms using a 1000 record subsample of the Portland cars dataset as described previously in Section 4. We will first consider the accuracy of the methods and then discuss how computationally efficient they are. 6.1 Accuracy: which is good enough? Figure 6 shows the results for exp1. It demonstrates very good agreement between the ‘gold standard’ raster plot, based on actual screen pixels, and the random plot [+1%, sd=1.3]. This is somewhat surprising as the latter is based on a standard distribution of a given number of plotted points and available pixels. The lines calculation is still fairly close, overestimating the overplotted% by about 6% [sd=3].
5.5 Line algorithm Here the lines crossing the lens (or a sample of the lines, in the case of a denser region) are taken and the overlap between each pair of lines is estimated by first checking the end points of the pair to verify whether the lines cross and if they do, the overlap on one of the lines is calculated as: line overlap proportion = max( 1.0, wid / ( len * sin(α) ) ) where wid and len are the width and length of the chosen line in pixels and α is the angle between the two lines (see Figure 5). Note that if the crossing lines are nearly parallel, they have a higher overlap than if they cross at 90 degrees.
Figure 6. Three different occlusion algorithms (exp1)
We have plotted similar graphs for exp2 and exp3, but to compare all three experiments, we have normalised the lines using the ‘gold standard’ raster value (see Figure 7). Note that these results have been chosen to show a range of behaviours typical of other lens positions and datasets. Figure 5. Line overlap proportion
An average overlap, p1, is computed by combining the line overlap proportion for all intersecting lines and weighting by the total length of the lines (non-intersecting lines are not included). Although there are many pairs of lines (almost L2 possible pairs; a line is not compared to itself) only an estimate is required, so it is sufficient to use a small sample in order to calculate this overlap proportion. p1 effectively tells us how a point plotted on a line is likely to be overplotted by one other line. To estimate pfree, , the likelihood that a pixel will not be overplotted by any line, we can use: pfree = (1–p1)L–1 Using the definitions from 5.1 we see that: pfree = E(M1) / M where M is the total of the line lengths in pixels. We then use formulae similar to the random algorithm, but taking into account that the lines do not cover all pixels with equal probability. Inverting the equation for E(M1), we get an ‘effective’ number of pixels S’ (which would be expected to be smaller than S). S’ = 1/q where q = 1 – pfree 1/(M-1) Note that this algorithm uses some of the same assumptions as the random algorithm, but bases it on some more direct measures of the lines as they actually fall. We would therefore expect that in terms of
Figure 7. Exp1, 2 and 3 normalised against raster values
Figure 7 shows that the random and lines plots for exp1 follow a path close to the diagonal (i.e. the raster values), reflecting once again the close agreement between the three algorithms for the data generated by this particular lens position. The light coloured yellow pair of lines near the diagonal are for exp3, a lens region that has
ELLIS ET AL: ENABLING AUTOMATIC CLUTTER REDUCTION IN PARALLEL COORDINATE PLOTS
almost parallel lines and areas of varying density (as in Figure 2). The lines show that estimates from the lines and random algorithms differ more from the true raster value (up to 10% in places) than for exp1. We believe that this discrepancy is due to the range of densities within the lens region having a disproportionate effect on the calculations, something we investigate further in section 7. The two lines that deviate most are for exp2. Recall that this area includes one of the parallel coordinate attribute axes and the points on the axes have large numbers of lines converging on them (see Figure 2). It appears that the lines algorithm for exp2 substantially overestimates the overplotted% values for the whole range of sampling rates, whereas the random algorithm underestimates overplotted% at the lower sampling rates. We have been looking at ways of dealing with extreme2 cases where many lines converge to a single point on an attribute axis within the lens. We currently allow expert users to specify a dead zone around the attribute axes and we believe there are ‘fixes’ for the lines algorithm to improve the robustness of its estimates (basically the parallelogram in Figure 5 needs to be modified at line ends). However, it is notable that even in this particularly extreme case, the random estimate does track the general trend of the ‘gold standard’ raster curve remarkably well. To summarise, all three algorithms yield comparable results except in extreme situations. This is particularly noteworthy for the random algorithm as it embodies a fairly rudimentary model of the data! The random algorithm also performs passably in the difficult case when the lens overlaps an attribute axis, a case where even the direct measurement is problematic. 6.2 Efficiency: which is fast enough? So far, whilst the lines algorithm has some problems in ‘difficult’ cases, all the algorithms are potential contenders as estimates of the overplotted% occlusion measure. Recall that the lines algorithm uses the intersection volumes of all the lines crossing the lens, so in terms of efficiency, is L2 in the number of lines. The raster algorithm rasterises the lines to a grid of given cell-width in pixels (say C pixels), thus the time taken is proportional to the number of lines and the number of cells crossed by the lines. However, bear in mind that for larger cell sizes we should undersample the lines to obtain a proper measure, so the actual time is proportionate to: L × ppl / C 2, where ppl is points per line. In contrast, the random calculation depends only on a count of the number of points to be plotted. This often comes almost ‘for free’ as a side effect of other calculations, but in the case of very large numbers of lines, it can be easily estimated. Typically, line lengths have a standard deviation of less than 3% of their average, so sampling the lengths of even 1000 lines would give an error of less than 0.1%. Finally, we should note that there is a difference between the modes of use of the two model-based algorithms compared with the data-driven raster algorithm. Given initial data for a lens position (average crossing area for lines and number of pixels for random) the overplotted% can be calculated for any sampling rate. Thus the appropriate sampling rate can be chosen directly to give the desired occlusion measurement, overplotted%. However, the raster calculation is based on the actual lines plotted at a given sampling rate. The raster calculation therefore has to be used in an iterative cycle adjusting the sampling rate and recalculating the measure at each iteration. The actual time taken to use the raster algorithm is perhaps 5-10 times the ‘headline’ figure for a single iteration. Figure 8 shows times (in ms) to perform the raster algorithm at a number of different cell-widths and also the times to perform the lines algorithm (labelled LOT). The time for the random algorithm is too small to measure. The times were taken from our Java implementation running on a 867MHz G4 PowerBook. The x-axis 2 Although this is a fairly common occurrence, in terms of the algorithms, the fact that so many points meet at a point is an extreme state.
shows calculations at different sampling rates (different numbers of lines) and the quadratic growth time for the lines algorithm is evident. The other three plots, for the raster algorithm with cellwidths of 1, 2 and 4 pixels, are roughly linear in the number of lines (as expected) and the decrease in the slope with increasing cellwidths is also clear.
Figure 8. Calculation times for raster and lines algorithms
Note that the 280 ms time for the lens calculation is slow for interactive feedback (200ms max), but given the need for iterations with the raster algorithm, the lines algorithm was in fact more responsive in our initial implementations. However, the 280ms is based on 742 lines, that is over half a million line pairs. Using a sample of these lines within the lens would reduce the lines calculation times by several orders of magnitude whilst not substantially altering its accuracy. 6.3 The winner … Combining efficiency with our accuracy measurements from Section 6.1, we can see that raster algorithms with cell sizes up to 4 pixels has little noticeable effect on accuracy and leads to a significant decrease in processing time of at least 90% compared with the single pixel raster. The lines algorithm is at first sight slower, but being model-based, it can use sampled data and does not require an iterative process. However, it is the least robust method in extreme situations. So the clear winner is the random algorithm as it is not only very accurate in normal cases and reasonably stable in difficult situations, but it is also almost instantaneous compared with both other algorithms. 7
LIMITS AND G ENERALISATION
So far we have seen how the random algorithm is surprisingly accurate and also very efficient to calculate. However, it is based on a very rudimentary model of the plotted points, so we would expect to find cases where it breaks down. We have already seen one example in exp2 near the axis where many lines converge. In this case the systematic property of parallel coordinates led to an underestimation of overlap% by the random algorithm. The main simplification of the random algorithm is to assume that the points are randomly and uniformly scattered over the available area. The fact that the points are on lines of course means that the points are not randomly scattered; but when using real data, this lack of randomness is clearly not an overriding problem, albeit a surprising result. However, the lines themselves do not always lie uniformly over the lens area and this creates a different class of extreme cases. We will now consider empirical results for parallel coordinates, near such areas and show how this relates to a theoretical analysis of the performance of random algorithm on scatter plots. The result is used to suggest a modification to the random algorithm, which we can test empirically.
IEEE TRANSACTIONS ON VISUALIZATION AND COMPUTER GRAPHICS, VOL. 12, NO. 5, SEPTEMBER/OCTOBER 2006
Figure 9. Lens at 10% sampling rate, exp30 is on the left.
7.1 Extreme cases – non-uniform density As noted, we expect problems in areas where there is a marked difference in density across the lens. Figure 9 shows a series of lens positions at just such a boundary, taken from exp30 to exp34. These lens positions move from being in an area of fairly uniform line coverage (exp30) to one where only about 20-25% of the area is covered (exp34). Figure 11 shows plots at three of these positions (exp30, exp32 and exp34). Each figure has plots for the lines, raster and random algorithm (reading each graph from top to bottom) at different sampling rates. In relation to the 'golden standard' raster calculation, the lines algorithm overestimates overplotted% and the random algorithm slightly underestimates this occlusion measure. However, as the lens gets less uniformly covered there is a noticeable widening and by exp34 the random measure is underestimating by nearly 50%. Whilst in most areas the random algorithm is surprisingly good, in this extreme case it is no longer accurate. There are a number of effects at the edge of a dense area, for example the lines tend to be lying in the same direction, hence less likely to cross, but when they do cross the overlap is greater due to the shallow angle. Also, by definition such areas are at the edges as far as the data set is concerned and may have unusual properties. However, we can more easily model scatter plots in such circumstances. 7.2 Scatter plots – theoretical analysis Imagine a scatter plot of M totally random points spread over a lens of area S pixels. This is exactly the model of our random calculation, hence the true (raster) overplotted% (using Poisson approximation) is: overplotted% = 100 * (1 – (1+λ)e –λ) / (1 – e –λ) where λ = M/S is the density of points. Now imagine spreading M/2 points over half the area, i.e. the effect of having a lens partly over an area with density λ and half with no points. The average density is now λ/2, but the actual overplotted% is exactly the same as above. So the raster algorithm would give the value above, but random algorithm would give the value with λ/2: raster overplotted% = 100 * (1 – (1+λ)e –λ) / (1 – e –λ) random overplotted% = 100 * (1 – (1+λ/2)e –λ/2) / (1 – e –λ/2) Figure 10 shows these values plotted against one another. Notice that for low densities (lower sampling rate), the random algorithm would show values that are half those of the raster algorithm (this
can also be shown analytically) and for higher densities, the values are still substantially lower. While the theoretical scatter plot data is different in many ways from parallel coordinate lines, it does shed some light on the pattern of difference between the results of the random algorithm and the true overplotted%.
Figure 10. Theoretical values of random algorithm for an uneven scatterplot
7.3 Using multiple bins Given the findings of the scatter plot analysis, an obvious way to improve the random algorithm is to split the lens area into a number of smaller areas or bins, calculate the random overplotted% for each bin and then perform a weighted average (weighted by the number of plotted pixels per bin). Figure 12 shows a bin-based correction on the same area as exp34 in Figure 9. The data has been plotted for different bin widths on a 100 pixel diameter circular lens. The plot is normalised (as in Figure 7) where the binned random approximations are plotted against the true raster calculation for different sampling rates. We can see that whilst the original random algorithm underapproximates the true value, the binned estimates lie remarkably close to the perfect 45-degree line (shown as a dotted line). Even the plot for a bin width of 50 pixels (4 bin, i.e. lens divided into quarters) lies very close to the true line.
Figure 11. Lines, raster and random values at different sampling rates for lens positions exp30, exp32 and exp34
ELLIS ET AL: ENABLING AUTOMATIC CLUTTER REDUCTION IN PARALLEL COORDINATE PLOTS
Sampling Lens to users who are actively using parallel coordinate plots. Implementation details of all algorithms are at this paper’s web page: http://www.hcibook.com/alan/papers/InfoVis06-NoClutter/ ACKNOWLEDGEMENT The initial development of the Sampling Lens was shared by Enrico Bertini, following a DELOS European Network of Excellence funded visit to the UK. REFERENCES [1]
[2] Figure 12. Binned-random algorithm
The binned calculation time is proportional to the number of bins (time ∝ 1/(lensdiameter/binwidth)2). However, given that the random calculations are very fast, the time is negligible for small numbers of bins. Even with 64 bins, the time is still too small to measure against the other calculation methods (see Figure 8). 8
CONCLUSION AND FUTURE WORK
We have come quite a long way to obtain such a simple result − the best way to calculate a measure of occlusion for parallel coordinate plots. However, the end point was quite unexpected. From the beginning of our work with sampling, we have often used binomial approximations to obtain an order of magnitude estimate of behaviour. However, the level of simplification embodied in the random algorithm seems just too coarse to use in actual calculations. The degree of fit we have seen in both Sections 6 and 7 is truly remarkable. Even if the lines were randomly scattered, the points on them would not be; they would be lines! Strangely this seems to be irrelevant to the bulk behaviour and it appears that such a simple (even simplistic) model is surprisingly good! Areas of rapidly varying density are approximated least well by the random algorithm, but we have seen that we only need to split the lens into a small number of bins to improve this to acceptable levels, even for the worst areas. Our empirical investigations have focussed on parallel coordinate plots. We would not like to speculate that the random algorithm would work for other visualisations, but it may be worth looking into applying this to other line based techniques. For example, Rafiei & Curial [11] use sampling to reduce the clutter of very large graphs. Our technique can be used to choose appropriate sampling rates based on the occlusion within the graph. Furthermore, autosampling based on the whole plot could be useful in an application which compares multiple plots (either side by side or in rapid succession), where the ‘density’ of the whole plot could be normalized to some extent. Random sampling as a clutter reduction technique is most useful for exploratory tasks. If the user has specific questions or is very knowledgeable about the particular data set, then other more appropriate techniques can be applied. However, a user faced with a cluttered display due to excess data, can choose between applying a technique that distorts the view in some way or one that adopts a fairly natural process of taking a sample of the data. We believe the sampling approach is worth considering; in fact many data sets are a sample of an even larger data set (e.g. population of country) or of continuous data (e.g. atmospheric data readings). We have yet to verify that similar methods will work on point plot data, where instead of overlapping lines there are full or partially overlapping data points of finite size, but we deem this feasible. We also plan to undertake studies to ascertain the practical use of the
[3]
[4]
[5]
[6]
[7]
[8] [9]
[10]
[11] [12] [13]
[14]
[15]
[16]
A.O. Artero, M.C. Ferreira de Oliveira and H. Levkowitz. “Uncovering Clusters in Crowded Parallel Coordinates Visualizations”. Infovis, pp. 131-136, 2004 E. Bertini and G. Santucci. “Improving 2D scatterplots effectiveness through sampling, displacement and user perception”. Proc. Information Visualisation 2005, London, pp. 826- 834, July 2005, IEEE E.A. Bier, M.C. Stone, K. Pier, W. Buxton and T.D. De Rose. “Toolglass and magic lenses: the see-through interface”. Proc. Computer Graphics and Interactive Techniques, pp. 73-80, 1993 A. Dix and G.P. Ellis. “by chance: enhancing interaction with large data sets through statistical sampling”. Proc. Advanced Visual Interfaces, L'Aquila, Italy, pp. 167-176, May 2002, ACM Press G.P. Ellis and A. Dix. “Density control through random sampling : an architectural perspective”. Proc. Information Visualisation ‘02, London, pp. 82-90, July 2002, IEEE G.P. Ellis, E. Bertini and A. Dix. “The Sampling Lens:Making Sense of Saturated Visualisations”. CHI '05 Extended Abstracts on Human Factors in Computing Systems, Portland, USA, pp. 1351-1354, 2005, ACM Press G.P. Ellis and A. Dix. “the plot, the clutter, the sampling and its lens: occlusion measures for automatic clutter reduction”. Proc. Advanced Visual Interfaces (AVI'06), Italy, pp. 266-269, May 2006, ACM Press J-D. Fekete. “The InfoVis Toolkit”. Infovis, pp. 167-174, 2004, IEEE Y-H. Fua, M.O. Ward and E.A. Rundensteiner. “Hierarchical Parallel Coordinates for Exploration of Large Datasets”. Visualization '99, Los Alamitos, CA, pp. 43-50, 1999, IEEE W. Peng, M.O. Ward and E.A. Rundensteiner. “Clutter Reduction in Multi-Dimensional Data Visualization Using Dimension Reordering”. Infovis, pp. 89-96, Oct 2004, IEEE D. Rafiei and S. Curial. “Effectively Visualizing Large Networks Through Sampling”. Visualization ‘05, pp. 48-55, 2005, IEEE G. Schussman. “Anisotropic Volume Rendering for Extremely Dense, Thin Line Data”. Visualization '04, pp. 107-114, 2004, IEEE E.J. Wegman and Q. Luo. “High Dimensional Clustering Using Parallel Coordinates and the Grand Tour”. Computing Science and Statistics, 28, pp. 352-360, July 1996 A. Woodruff, J. Landay and M. Stonebraker. “Constant Density Visualizations of Non-Uniform Distributions of Data”. Proc. UIST'98, San Francisco, pp. 19-28, 1998 J. Yang, M.O. Ward, E.A. Rundensteiner and S. Huang. “Interactive hierarchical displays: a general framework for visualization and exploration of large multivariate data sets”. Computers and Graphics, 27(2), pp. 265-283, Apr 2003 L. Zhang, C. Tang, Y. Shi, Y. Song, A. Zhang and M. Ramanathan. “VizCluster and Its Application on Clustering Gene Expression Data”. Distributed and Parallel Databases, 13(1) , pp. 73-97, 2003