Encoding of Text to Preserve “Meaning” Angel R. Martinez George Mason University1 Edward J. Wegman George Mason University
Abstract: A novel way to encode text streams is provided. The encoding allows for the application of computational methods in the determination of semantic similarity between text units. Supervised and unsupervised learning methods are used on a subset of the TDT Pilot Corpus to determine the effectiveness of the encoding in classification and clustering processes. Key Words: bigram proximity matrix, trigram proximity matrix, classification, clustering, semantics, dimensionality reduction, similarity measures
1. The Problem A large percent of information available to command and control systems exists in the form of text. Fast and effective methods to classify and group automatically related information for further processing are desirable. A critical step to the application of efficient computational methods is the encoding of the text stream. This paper introduces a novel method for encoding the text stream, with highly desirable computational properties. Tests show that the encoding preserves enough semantic distinctiveness to allow for very high rates of correct classification, where classification is based on measures of ‘semantic’ similarity computed between encoded text units. In Section 2 we will introduce the bigram proximity matrix (BPM) and the trigram proximity matrix (TPM), the two structures resulting from the text stream encoding. The corpus used as a testbed, as well as the similarity measures used, are presented in Section 3. Section 4 discusses the experiments conducted to determine the encoding capacity to preserve distinctive features of the text stream content. The ‘shape of meaning’ via parallel coordinates is discussed in Section 5, and Section 6 offers conclusions and possible future work.
2. The Bigram Proximity Matrix (BPM) and the Trigram Proximity Matrix (TPM) The BPM and the TPM are matrix structures used to encode each text unit, i.e., paragraph, section, chapter, book, etc. A simple example using a sentence will make the encoding process clear. The BPM for the sentence or text stream, “The wise young man sought his father in the crowd.”
is shown in Table 1. We see that the matrix element located in the third row ( his) and the fifth column (father) has a value of one. This means that the pair of words his father occurs once in this unit of text. It
1. Email:
[email protected] (Angel Martinez) and
[email protected] (Edward Wegman)
1
should be noted that in most cases, depending on the size of the lexicon and the size of the text stream, the BPM will be very sparse. Table 1. Example of Bigram Proximity Matrix a .
crowd
his
in
father
man
sought
the
wise
young
. crowd
1
his
1
in
1
father
1
man
1
sought the
1 1
1
wise
1
young
1
a. Zeros in empty boxes are removed for clarity.
By preserving the ordering of words of the discourse stream, the BPM captures a substantial amount of information about meaning. Also, by obtaining the individual counts of word co-occurrences, the BPM captures the ‘intensity’ of the discourse’s theme. Both features make the BPM a suitable tool for capturing meaning and performing computations to identify semantic similarities among units of discourse (e.g., paragraphs, documents). The TPM captures the occurrence of consecutive triplets of words by constructing a cube with the lexicon on three axes. A trigram is the point of intersection of the row, column and page in the cube, as illustrated in Figure 1. The figure expands the same sentence given above. The trigram “sought his father,” is the point (sought, his, father), that is, the array element in the 7th row, 3rd column, and 5th page. As can be seen, the resulting N3 array structure, where N is the size of the lexicon is very sparse. The TPM is a trivial extension of the BPM. Preliminary testing seems to indicate that for some applications (e.g., change of topic determination) and for larger sizes of text units, the TPM performs better than the BPM. Notice that the BPM and TPM are arrays whose rows, columns, and pages (in the case of the TPM) are indexed by the lexicon of the text unit. We chose alphabetical ordering of the lexicon; however, this is not essential. In the pre-processing of the text, all punctuation marks, except the ending period, were deleted. The end period was considered a word and placed at the head of the lexicon.
3. The Test Suite and Similarity Measures Documents from the Topic Detection and Tracking (TDT) Pilot Corpus (Linguistic Data Consortium, Philadelphia, PA) were used as the textual testbed. The TDT corpus is comprised of close to 16,000 newscasts collected from July 1, 1994 to June 30, 1995 from the Reuters newswire service and CNN broadcast news transcripts. A set of 25 events are defined in the TDT. Each of the 16,000 newscasts is flagged with one of three possible flags: Yes, No, or Brief. The flags are used to indicate that a newscast discusses one of the 25
2
Figure 1 Here we see an example of a trigram proximity matrix (TPM). Note that the indexes on each side of the cube correspond to a word in the lexicon. The element in the ith row, jth column and kth page indicates the number of times that sequence of three words appears in the text unit.
events, or it does not, or it does so only briefly. In order to meet computational requirements, a subset of the TDT corpus was used in this work. A total of 503 newscasts were chosen from the 16,000 available. These news stories comprise 16 of the 25 events discussed in the TDT. See Table 2 for a list of topics. The 503 documents chosen contain only the Yes or No flags. This choice stems from the need to demonstrate that the BPM and TPM capture enough meaning to make a correct or incorrect topic classification choice. The 503 stories selected produced a lexicon of 11,103 unique words. Conflated forms are counted as different words. Using this lexicon and the structure already described, a BPM and TPM were created for each of the 503 stories. The assertion is that each of the structures captures enough of the meaning in the newscast to serve as a classification feature. We test this assertion using various methods in exploratory data analysis and computational statistics. Table 3 lists the measures of semantic similarity used in this study. For definitions of these measures, see [Martinez, 2002]. It should be noted that some of these are distances and some are similarities; however, for ease of exposition, we will refer to them all as measures of semantic similarity. All similarity measures were first converted to distances so they could be used with the various methods. Also, some of these measures are binary, in which case the frequencies of word pairs and triples are changed to a 0 or a 1. Similarly, the proximity matrices are converted to distributions to use the probabilistic measures. Two variants of the lexicons are considered. In one variant, common high-frequency words have been removed from the lexicon and the documents. In another variation, we stemmed the words as well as removed the common high-frequency words from the documents. Part of this research examines how this
3
affects the discriminating power of the proximity matrices. Many NLP applications [Kimbrell, 1988], [Salton, Buckley and Smith, 1990], [Frakes and Baeza-Yates, 1992], [Berry and Browne, 1999] use a shorter version of the lexicon by excluding words often used in the language. These words, usually called stop words or noise words, are said to have low informational content and thus, in the name of computational efficiency, are deleted. Not all agree with this approach [Witten, Moffat and Bell, 1994]. Taking the denoising idea one step further, we stemmed the words in the denoised text. The idea is to convert all conflated forms of the words to their stem or root to increase the frequency of key words and thus enhance the discriminatory factors of the features. Stemming is routinely applied in the area of information retrieval (IR). In the IR application, stemming is used to enhance the performance of the IR system, as well as to reduce the total number of unique words and save on computational resources. A popular stemmer is the Porter stemmer [Baeza-Yates and Neto, 1999], [Porter, 1980]. The Porter stemmer is simple; however, its performance is comparable with older established stemmers. The Porter stemmer works on the suffix of words. These are stripped according to several parsing rules and replaced with one of a list of endings or the null ending. On most occasions, these simple replacements work well, as is the case of the words: protecting, protected, protects, protection, which are conflated forms of ‘protect.’ However, in other cases, it does not work as well. For example, a word like probate will be stemmed to probe, which carries a totally different meaning. The same thing applies for relativity, which is conflated to relate. In information retrieval applications, these anomalies of the stemmers do not seem to affect their usefulness. The issues are not so clear in our application.
Table 2. List of 16 Topics
Topic Number
Topic Description
Number of Documents Used
Topic Number
Topic Description
Number of Documents Used
4
Cessna on the White house
14
15
Kobe, Japan Quake
50
5
Clinic Murders (Salvi)
38
16
Lost in Iraq
30
6
Comet into Jupiter
45
17
NYC Subway bombing
24
8
Death of Kim Il Sung
35
18
Oklahoma City bombing
76
9
DNA in OJ trial
29
21
Serbians down F-16
16
11
Hall’s copter in N. Korea
75
22
Serbs violate Bihac
19
12
Humble, TX, flooding
16
24
US Air 427 crash
16
13
Justice-to-be Breyer
8
25
WTC bombing trial
12
4
Table 3. Measures of Semantic Similarity 1. Matching Coefficient
8. Sokal - Sneath
2. Sokal - Michner
9. Gower - Legendre 1
3. Dice Coefficient
10. Gower - Legendre 2
4. Jaccard Coefficient
11. Normalized Correlation Coefficient
5. Cosine - Ochiai
12. L1 - Probabilistic Measure
6. Russell - Rao
13. IRad - Probabilistic Measure
7. Roger - Tanimoto
Table 4. Lexicon Sizes Type of Lexicon
Size of Lexicon
Full Lexicon
11,103
Denoised Lexicon
10,997
Stemmed Lexicon (also denoised)
7,146
To determine if there is any deleterious effect of using the stemmer and denoising with the BPMs and TPMs, the same experiments are conducted on all three versions: full, denoised, and stemmed documents. Table 4 summarizes the size of the lexicons in these three cases.
4. The Tests In this section, we present the results of applying supervised (kNN classification) and unsupervised learning (model-based clustering) to the collection of 503 news stories. In supervised learning experiments, the class membership of each observation is known, and we are interested in how well we can classify the topics given the BPM and TPM features. In the case of unsupervised learning, experiments start with very little information, essentially the observations. No knowledge of the number of classes nor the observations’ membership to these are available. 4.1 kNN Classification We first apply supervised learning approaches to the BPM and TPM features to determine whether these features allow us to classify documents according to their meaning. If we can accurately classify using the proximity matrix as a feature, then this is an indication that these features preserve meaning. In kNN classification, the decision rule is to assign x to the class that has the greater number of members amongst the k nearest neighbors [Web, 1999], [Cover and Hart, 1967]. Due to the high-dimensional nature of these features, we cannot apply classical supervised learning methods such as linear or quadratic classifiers. However, the kNN classifier is well-suited for our BPM and TPM features, since all we need are the pairwise distances between all BPMs and TPMs. The kNN classification method was applied using the following parameters: • • • •
Thirteen measures of semantic similarity (see Table 3) k values: k = 1, 3, 5, 7, and 10 Proximity matrix: BPM and TPM Three text conditions: full, denoised and stemmed
5
The dotplot shown in Figure 2 shows the results for the rate of correct classification (CCR) using denoised text and is representative of the other experimental results. Of the thirteen measures of semantic similarity, 10 resulted in high CCRs. Three of them resulted in very low CCRs. These are the Sokal-Michner, Roger-Tanimoto, and Gower-Legendre 1. Summary conclusions from the experiments are: 1. The BPM and TPM seem to contain sufficient semantic information to allow for almost perfect classification results. 2. Binary similarity measures based solely on word pairs and triples that are common to two documents worked better with denoised text 3. Probabilistic measures of semantic similarity performed the best with denoised and stemmed text. 4. The Dice, Jaccard, Sokal-Sneath, Gower-Legendre 2, L1 norm and IRad measures were the best performers. 4.2 Unsupervised Learning The method chosen for our unsupervised learning experiments is called model-based clustering [Banfield and Raftery, 1993], [Fraley and Raftery, 1998]. This method is based on finite mixtures [Everitt and Hand, 1981] where the output model is a weighted sum of c multivariate normals. See Martinez [2002] for more information on model-based clustering for this application. One of the benefits of using model-based clustering instead of some other method is that it includes a mechanism for determining the number of groups in the data set. Thus, we hoped to see results with approximately 16 clusters (or topics). As a way to compare supervised and unsupervised learning methods, similar experiment variables were used with model-based clustering. The following variable combinations were used: • • • • •
Thirteen measures of semantic similarity (see Table 3) Two values of k nearest neighbors for the Isomap dimensionality reduction: k = 7, 10 Proximity matrix: BPM and TPM Three text conditions: full, denoised and stemmed One ‘best’ dimension value from Isomap
In order to use model-based clustering, the dimensionality of our observations (i.e., the BPMs and TPMs) had to be drastically reduced from 11,1032 (in the case of the full lexicon) to 2, 3, 4, 5, and 6 dimensions. This reduction was effected through the Isometric Figure Mapping (Isomap), a nonlinear dimensionality reduction method [Tenenbaum, deSilva and Langford, 2000]. Isomap is essentially an extension of multidimensional scaling (MDS) methods, where geodesic distances between k nearest neighbors are used as inputs to MDS. The assessment of the results was done via a visualization aid we developed called ReClus. ReClus takes the output from the model-based clustering procedure and draws one large rectangle. This rectangle is subdivided into n smaller rectangles, where n is the number of clusters chosen according to the modelbased clustering procedure. The area of each smaller rectangle is proportional to the number of cases in the cluster. Inside each rectangle, and for each case assigned to that cluster, the class number is printed, or optionally, the case number is printed. Each number is color-coded to denote the degree of certainty that the particular case belongs to the cluster. A threshold is set to print in black bold type when the certainty is 0.8 or above. ReClus, thus, provides a quick visual way to examine the results from model-based clustering. Although, judging between two results entails a degree of subjectivity, this is a problem only where
6
results are close. Additionally, ReClus provides information to guide the examination of confounding factors in the clustering process. An example of a ReClus plot is given in Figure 3. We now offer some specific observations on the results, keeping in mind that it is difficult to assess the goodness of clusters. Of the 312 experiments, thirteen showed the correct number of clusters, sixteen. Not surprisingly, however, none of these - and for that matter, none of the 312 - showed sixteen correct (i.e., ‘pure’) clusters. In each of the thirteen results, two rectangles contained the same class cases (topic number 6 was split into two groups). We note that the same situation for topic 6 arose in those results containing 15 and 17 clusters. Usually, more than half of the rectangles suffered from some degree of contamination. If we consider a good result as one with the highest number of ‘pure’ rectangles, followed by a high number of only lightly ‘contaminated’ ones, and the fewest number of jumbled rectangles, then the following are the best results: • •
Ochiai measure, full text, dimensionality 6, BPM and k = 7 Jaccard measure, stemmed text, dimensionality 6, BPM, and k = 7
The above categorization of the best results is naive. It assumes that a mix of 2 or more classes in a rectangle is an undesirable result. However, in the case of our test bed, a mix could point to a justifiable confusion. For example, in several of the ‘best’ results classes 8 and 11 are usually mixed; however, both sets of documents are about North Korea. Also, topics 18 and 17 are sometimes mixed: both sets of documents deal with bombing, the Oklahoma City bombing and the NY subway bombing. The same happens a few times with classes 21 and 22: both report on two different aspects of the Serbian conflict. The intriguing case mentioned above, where class 6 had two pure rectangles containing class 6 cases, raises the issue of latent classes or sub-groups within the topics. A reading of the documents involved does show two different foci. The main subject of the set is the crash of fragments of the comet Shoemaker-Levy onto the surface of Jupiter. One group in the set emphasizes background information about the comet as well as the fact that the space shuttle is in orbit ready to observe what is yet to take place. The second group’s focus is predominantly on the event already taking place and observations of the phenomenon.
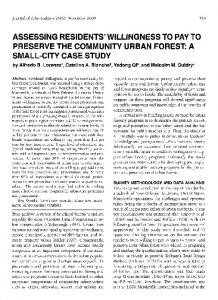
5. The ‘Shape of Meaning’ and Parallel Coordinates Examination of the model-based clustering results using ReClus seem to show two aspects of the semantic content of the text units: (1) the possibility of latent topics, as was the case with topic 6, and (2) the detection of similarity between topics, as in the cases of topics 8 and 11, 17 and 18, and 21 and 22. Visual detection of similarity between topics can also be seen using parallel coordinates [Wegman, 1990]. A matrix of parallel coordinate plots was created by placing together in matrix form a parallel coordinate plot for each topic. See Figure 4 at the end of the paper. By looking at the overall shape formed by the lines and the points where these touch the five axes (5 dimensions), we are able to detect patterns. These patterns seem to be manifestations of semantic content of the clusters. Notice the following: •
•
•
The parallel coordinates for topics 8 and 11 show exact patterns for a good number of their lines. This corroborates the confusion detected in the model-based clustering results via the ReClus display. The possible common theme repeated is North Korea and US relations. The parallel coordinate plots for topics 17 and 18 show a group of lines with the exact pattern in both. This corroborates the confusion detected in the model-based clustering results via ReClus. A possible common theme that is repeated is bombing and its immediate effects. The parallel coordinates for topics 21 and 22 show a small group of lines with a common pattern. This pattern may represent a common core of the two topics about the Serbian conflict.
7
•
Topic 6 showed invariably in two clusters in the ReClus figures. Notice the pattern from the lines of the parallel coordinates for topic 6. On the second axis from top to bottom, one notices a separation of lines. This indicates two different groups, separable at the dimension represented by that axis. These groups may represent the two sub-themes found in reading the newscasts of topic 6.
Parallel coordinates were a crucial help in making sense of our model-based clustering results. On occasion, a permutation tour [Wegman, 1990] of a single topic’s parallel coordinates was necessary. For example, the parallel coordinate plot for topic 8 shows a simple structure. But, the ReClus view shows topic 8 linked with topic 11 in three different clusters. Is the model-based clustering result wrong? When a permutation tour of topic 8 was performed, about three sub-groups became evident. This seems to match a reading of the 35 newscasts from topic 8 as the next paragraph explains. As mentioned above, classes 8 and 11 appeared mixed in the experiments. Topic 8 and topic 11 both deal with North Korea, one regarding the death of Kim Il Sung and the other the crash of the American helicopter in North Korean territory. Most of the time there are three rectangles containing cases from 8, of which two are mixed with 11 and one rectangle (almost purely 11) was only very slightly mixed with 8. As is the case with class 6, this may imply the existence of latent classes in groups 8 and 11. A quick reading of the newscasts for topic 8 seems to show three major themes discussed over the background of Kim Il Sung’s death and the probable succession of his son Kim Jong-il. The three latent topics are: (1) US and North Korea relations; (2) North Korea and South Korea relations; and (3) North Korea’s nuclear plants. The visualization tool ReClus made the examination of the results from the model-based clustering experiment possible and fruitful. The BPMs and TPMs capture sufficient meaning to produce satisfactory results with this unsupervised learning method. For best results, the Ochiai measure of semantic similarity should be used in the Isomap dimensionality reduction method, and the dimensionality can be reduced to five or six dimensions. Full and denoised text did well with the Ochiai measure. It seems that latent classes are detected by the BPMs and TPMs, as made manifest by the results discussed above.
6. Conclusions and Future Work We introduced in this paper two transformations of the text stream amenable to computational methods, called the bigram proximity matrix and the trigram proximity matrix. The usefulness of the BPM and TPM depends on how much semantic information they preserve. In order to determine the adequacy of these encodings to preserve semantic information, supervised learning using kNN classification and unsupervised learning, using model-based clustering were applied. Variables in the experiments consisted of combinations of the following: • • •
Thirteen semantic similarity measures Three text conditions (full, denoised and stemmed) Various values of k (kNN).
Supervised learning experiments were conducted on the full dimensionality of the feature space (see Table 4 for the lexicon sizes). Dimensionality was reduced to a lower number (2 - 6) using the nonlinear dimensionality reduction procedure called Isometric Figure Mapping (Isomap). With dimensionality reduced, unsupervised learning experiments were conducted using model-based clustering. Results from supervised learning experiments showed that correct classification ratios in the range of 0.95 - 0.99 were common for many of the semantic similarity measures used. This indicates that the BPM and TPM capture sufficient semantic information for the discrimination of semantically dissimilar
8
text units. Results from the unsupervised learning experiments showed that the BPM and TPM capture sufficient semantic information to group thematically related documents and seems to detect latent subthemes. In conclusion, we can state that the text stream transformations do capture enough semantic information to allow for the semantic discrimination of text units. Several obvious possibilities for future work are: • To create efficient algorithms for lexicon expansion and subsequent recomputation of BPMs and TPMs. • To apply BPMs and TPMs to the problem of change of topic determination. • To explore the capability of BPMs and TPMs in combination with model-based clustering, parallel coordinates and ReClus in the detection and identification of sub-topics. • To examine the effect of the following: size of documents, type of documents (scientific article, news story, patent description, etc.), and number of text units in a topic.
References: Baeza-Yates, Ricardo and Berthier Ribero-Neto, 1999. Modern Information Retrieval, ACM Press, New York, NY. Banfield, J. D. and A. E. Raftery, 1993. ‘Model-based Gaussian and non-Gaussian clustering,’ Biometrics, 49, pp. 803 - 821. Berry, Michael W., and Murray Browne.1999. Understanding Search Engines: Mathematical Modeling and Text Retrieval. SIAM, Philadelphia, PA. Charniak, Eugene. 1996. Statistical Language Learning, The MIT Press, Cambridge, MA. Cover, T. M. and P. E. Hart, 1967. ‘Nearest neighbor pattern classification,’ IEEE Transactions on Information Theory, 13, pp. 21 - 27. Everitt, B. S. and D. J. Hand, 1981. Finite Mixture Distributions, Chapman and Hall, London, UK. Frakes, W. B. and Ricardo Baeza-Yates, 1992. Information Retrieval: Data Structures & Algorithms, Prentice Hall, New Jersey. Fraley, C. and A. E. Raftery, 1998. ‘How many clusters? Which clustering method? - Answers via modelbased cluster analysis,’ The Computer Journal, 41, pp. 578 - 588. Kimbrell, Roy E., 1988. ‘Searching for text? Send an N-Gram!,’ Byte, May, pp. 297 - 312. Landauer, Thomas K., Darrell Laham, and Peter Foltz. 1998. Learning human-like knowledge by Singular Value Decomposition: A progress report. In M. I. Jordan, M. J. Kearns and S. A. Solla (Eds.). Advances in Neural Information Processing Systems, 10, pp. 45 - 51. Cambridge. MIT Press. Martinez, Angel R., 2002. A Statistical Framework for the Representation of Semantics, Ph.D. Dissertation, George Mason University. Nettleton, Dan and T. Bannerjee, 2001. ‘Testing the equality of distributions of random vectors with categorical components,’ Computational Statistics and Data Analysis, 37, pp. 195 - 208.
9
Porter, M. F., 1980. ‘An algorithm for suffix stripping,’ Program, 14, pp. 130 - 137. Révézs, Gyorgy. 1983. Introduction to Formal Languages, McGraw-Hill Book Company, New York, NY. Salton, Gerard, Chris Buckley and Maria Smith, 1990. ‘On the application of syntactic methodologies,’ Automatic Text Analysis, Information Processing & Management, 26, pp. 73 - 92. Tenenbaum, Joshua B., Vin deSilva and John C, Langford, 2000. ‘A global geometric framework for nonlinear dimensionality reduction,’ Science, 290, pp. 2319 - 2323. Webb, Andrew, 1999. Statistical Pattern Recognition, Oxford University Press, Oxford, UK. Wegman, E. J., 1990. ‘Hyperdimensional data analysis using parallel coordinates,’ Journal of the American Statistical Association, 85, pp. 664 - 675. Witten, I. H., A. Moffat and T. C. Bell, 1994. Managing Gigabytes: Compressing ad Indexing Documents and Images, van Nostrand Reinhold, New York, NY.
10
Figure 2 This shows the results of applying the kNN classification method to the problem of correctly classifying the newscasts according to their topic. We see that most of the measures of semantic similarity perform well.
11
Figure 3. ReClus layout showing the results from the model-based clustering where the Jaccard measure is used with denoised text.
12
16 21 21 21 22 22 21 21 21 22 22 21 21 21 22 22
9 9 9 9 9
9 9 9 9 9
9 9 9 9 9
12 12 12
12 12 12
12 12 12
12 12 12
252525
252525
252525
2525
15 15 15 15
12 15 15 15
11 15 15 15
6 6 6 6 6 6
6 6 6 6 6 6
6 6 6 6 6 6
8 11 11 11
8 11 11 11
8 11 11 11 11
6 6 6 6
6 6 6 6
6 6 6 6
6 6 6 6
16 16 16 16 16
16 16 16 16 16
16 16 16 16 16 22
16 16 16 16 16 21
16 16 16 16 16 16
16 21 21 21 22 22
9 9 9 9 9
6 6 6 6 6 6
4 21 21 21 22 22
9 9 9 9 9
15151515
15151515
15151515
1515151518
1515151515
1215151515
1215151515
9 13151824
5 5 5 5 5 5
5 5 5 5 5 5
5 5 5 5 5 5
5 5 5 5 5 5
5 5 5 5 5 5
5 5 5 5 5 5
8 8 111111
8 8 111111
8 8 111111
8 11131822 9 11131824
8 8 8 1111
8 8 8 111111
8 8 8 111111
8 8 8 111111
6 11131818
5 11131718
5 9 13171825
5 9 13171824
Jac Den d=6 B7
4 6 16 18 18
4 6 16 18 18 22
4 5 15 18 18 22
4 5 15 18 18 22
4 4 15 18 18 22
4 4 15 18 18 22
4 4 11 18 18 22
4 4 11 17 18 22
15 18 18 18 24 24
15 18 18 18 24 24
15 17 18 18 24 24
15 17 18 18 24 24
15 17 18 18 24 24
13 17 18 18 18 24
8 17 18 18 18 24
6 17 18 18 18 24
17 17 18 18 18
17 17 18 18 18 18
17 17 18 18 18 18
17 17 18 18 18 18
17 17 18 18 18 18
17 17 18 18 18 18
12 17 18 18 18 18
4 17 18 18 18 18
8 11 11 11 11 11 11
8 11 11 11 11 11 11
8 8 11 11 11 11 11
8 8 11 11 11 11 11
8 8 11 11 11 11 11
8 8 11 11 11 11 11
8 8 11 11 11 11 11
0.1
0.3
0.4
0.6
0.7
0.9
Figure 4. Parallel coordinates plot matrix for the 16 topics.
13