Energy-Efficient Communication Networks for Improved Global Energy Productivity
Slavisa Aleksic
c Springer (2012). This is an authors’ copy of the work. It is posted here by permission of Springer for your personal use. ° Not for redistribution. The definitive version is scheduled for publication in Telecommunication Systems Journal in 2012. The final publication will be available at www.springerlink.com.
Telecommunication Systems manuscript No. (will be inserted by the editor)
Energy-Efficient Communication Networks for Improved Global Energy Productivity Slavisa Aleksic
Received: March 2011 / Accepted: September 2011
Abstract Recently, a lot of effort has been put into research and development of energy-efficient devices and systems and into optimization of the network infrastructure with regard to energy consumption. On the one hand, reducing total power consumption of global communication networks has become an imperative and an important step towards the future highly energyefficient Internet. On the other hand, capacity and performance of the Internet must be continuously improved in order to meet the high requirements set by the continuously increasing of both the number of broadband subscribers and the amount of user traffic. Thus, only a highly energy-efficient and high-performance network infrastructure designed to efficiently support advanced applications and services for improving energy productivity in many other branches of business and society can significantly contribute to global energy savings. This paper briefly discusses potentials and options for achieving such an energy-efficient network infrastructure. Some examples of software applications and services for global energy savings are briefly reviewed. The aim of this paper is to draw attention to the need for a holistic approach to evaluate energy efficiency and to improve the global energy productivity through the use of high-performance and energy-efficient networks, services and applications. Keywords Energy efficiency · power consumption · network elements · core networks · access networks · holistic approach S. Aleksic Vienna University of Technology, Institute of Telecommunications, Favoritenstr. 9/E389, Vienna, Austria Tel: +43-1-58801-38831 Fax: +43-1-58801-938831 E-mail:
[email protected]
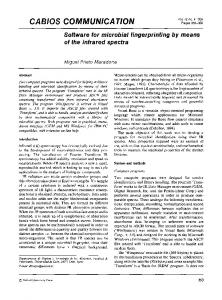
1 Introduction The continuous growth of Internet traffic has led to rapidly increasing capacity provided by network infrastructure. Observations have shown that the main contributor to the traffic increase in the Internet is the traffic from residential customers [1]. This is mostly because of introduction of new bandwidth-hungry applications for residential users but also due to the fast growth of the number of broadband subscribers [2] as it is evident from Fig. 1 a). Due to the concurrent growth of Internet traffic and the number of subscribers, both the number of network elements and their capacity are also expected to increase in the future. It has been predicted that about seven times more servers, thirteen times more routers, and sixteen times more PCs than we had in 2007 will be a part of the global communication network in 2020 [3]. For this reason, energy efficiency of both network and end-user equipment has become a very important issue. Network elements must be able to provide high performance while featuring reduced power consumption. These very high requirements can only be satisfied through a combined effort of research community, network designers, and network operators. It can be achieved by developing and applying power-efficient components and structures as well as through designing new network concepts that are able to naturally support high capacities, high quality of service (QoS) standards, and low-power operation. Historical development and some projections for future trends concerning the growth of Internet traffic and the increase in router capacity and line data rate are presented in Fig. 1b). In the past, user traffic was increasing by about 100% per year. Within the last few years, this growth has slowed somewhat, so that
b) 700
1.E+07
?
600 2009: 422 Million
500
400
2005: 215 Million 2010: 484 Million
300
~15% per year
? 1.E+03
~100% per year
? ~75% per year
1.E+01
Line data rate ~35% per year
~60% per year
200
1.E-01 1996
2002: 67 Million
0 2004 2007 2010 2013
?
~45% per year
Internet traffic
1.E+05
1999: 5 Million
1998 2001
~50% per year
Router capacity per rack Capacity [Gbit/s]
Broadband Subscribers Worldwide [Milions]
a)
1998
2000
2002
2004
2006
2008
2010
2012
2014
2016
Year
2016
Year
d)
c) 10,000
25 Cisco CRS-1 (max. config.)
1,000
High-Performance Computers Total Power Consumption [MW]
Total Power Consumption [kW]
IP Routers
Black Diamond 20808 Cisco CRS-1
100 Juniper M320
10 Juniper TX Juniper T640
1 estimated Examples of current high-performance systems
20 Cray XT5-HE 6C (2009)
15 CrayXT5HE 6C (2009)
10
OLCF-3 (2011)
5 Cray "Baker" (2008) Cray XE6 12C (2010)
0
0 0.1
1
10
100
Aggregate Bandwidth [Tbit/s]
1
10
100
1000
System Peak Performance [TFlops]
Fig. 1 Current trends concerning a) number of broadband subscribers worldwide, b) increase of Internet traffic, router capacity and line data rates, c) power consumption of high-capacity routers and d) power consumption of high-performance computers.
the traffic volume in global communication networks is currently increasing by approximately 50% per year [4]. In order to keep track with this increasing demand for bandwidth, the capacity of underlying network components has to increase too. However, when considering IP routers, the capacity per rack of equipment has been increasing with a lower rate than Internet traffic. As it can be seen from Fig 1 b), the capacity per rack was increasing by about 75% per year for more than ten years. The increase in capacity has slowed in the last few years, which is mostly due to increased energy density and limited cooling rate. The increase of port (line) data rate has been also slowed down to some extent in the last several years. While in the past, line data rate increased by a factor of four each three years or by a factor of ten per approximately six years, the step from 40 Gbit/s to 100 Gbit/s, which corresponds to an increase by a factor of 2.5, took more than three years. In order to keep the same increasing rate as during the last decade, the next generation optical transceivers operating at the line data rate of 1 Tbit/s should be available around 2014.
According to [5], communication networks of today are responsible for about 2 % of the global carbon emissions. Therefore, power consumption demands a lot of attention when considering scaling of network elements to future required aggregate capacities. Figure 1 c) shows the estimated total power consumption of electronic routers for capacities up to 100 Tbit/s with some examples of current high-performance routers [6]. Thus, the router’s power consumption increases linearly with bandwidth and each new generation of high-capacity routers consumes more power than the previous one. Similar trends can be observed for large data centers and high-performance computers. Some examples of recently developed systems and projections for power consumption of high-performance computers (HPCs) are shown in Fig. 1 d). It is evident that already today, HPC systems consume several MW of electricity [7]. Future Exascale computer systems will probably consume more than 20 MW, which will set very high requirements on power supply and cooling systems. Therefore, a large effort has to be put into research and development of more energy efficient structures and technolo-
2 Total Network Power Consumption Let us now look at some general issues related to power consumption and energy efficiency of global networks. Sometimes, the terms energy efficiency and energy consumption are mixed up in the literature. Although reducing of energy consumption is often required to achieve a high energy efficiency, minimizing energy consumption is not always the primary goal. Instead, energy efficient technologies and concepts are rather aimed at improving performance and increasing capacity of the entire network while paying a particular attention to energy consumption, i.e. to provide more functionality while keeping the total energy consumption as low as possible. In order to obtain a complete picture it is crucial to concentrate on the total energy consumption from the system point of view. That means all contributing elements should be taken into account and different concepts should be examined by dimensioning them all to provide the same performance. For example, a particular device or technology may provide a low power consumption, but at the same time, it may deliver a low performance or its introduction into the system may
a) 100%
Power generated
~95% Power supplied to central office
~76%
~68%
Power consumed by network elements
- 5% - min. 20% Transmission Cooling
~62% Power consumed by electronic and optical subsystems
- 10% - 10% PSU AC/DC PSU DC/DC
b) Wide Area Networks
Total Electricity Consumption of Global Communication Networks
gies in order to make possible further scaling in both capacity and performance. The structure of the paper is as follows. Section 2 discusses some general issues related to energy efficiency of communication networks. In Sections 3 and 4, some examples of technologies and methods for improving energy efficiency of network elements are given. Moreover, this Section presents and discusses power-efficient network concepts and some ideas about how to consider power efficiency in designing network elements in the access and core areas. Section 5 briefly addresses applications and services that can be used to increase the global energy productivity, while Section 6 proposes a holistic approach for evaluating the impact of the global communication network on global energy savings. Finally, Section 7 summarizes the paper and draws some conclusions. The aim of this paper is not to give a comprehensive review or an exhaustive survey of methods and technologies for reducing power consumption and for increasing energy efficiency of communication networks, but rather to mention some illustrative examples of energy-efficient concepts and to draw attention to complex interactions between different subsystems, layers and areas of communication networks as well as to interdependencies with other branches of business and society through an broad use of advanced applications and services.
Consumption of WANs
Metro
Consumption of MANs
Consumption of Access
Consumption of LANs
Metro
Access
Access
Access
Local
Local
Local
Smart Grids
Telepresence Cloud Computing
Transportation
Industry
Building Management Telecommuting
Fig. 2 a) Power losses outside of network elements and b) total power consumption of the global communication network (PSU: Power Supply Unit).
cause an increased complexity in other subsystems belonging other network layers or areas. As a consequence, the introduction of such a device or technology in the network could lead to a higher overall network power consumption [11,12]. Thus, it is beneficial to look at the total power consumption of the entire network as it is represented in Fig. 2 b) and to consider different network layers and areas. Additional to power consumption of the network itself also power losses due to inefficiencies of power supply and cooling equipment as well as transmission losses in the power grid can be considered. [see Fig. 2 a)] There are several reasons for concentrating on energy consumption in the process of designing new network technologies. Maybe the most intuitive one is that minimizing energy consumption of the global network infrastructure can have a positive environmental impact and, at the same time, it can lead to a reduced operational expenditure of network providers due to a lower energy related costs. Another important motivation for improving energy efficiency is to overcome scalability limitations due to an increased energy density in communication and in-
Another example are intrasystem interconnects, which are becoming increasingly complex and power consuming when increasing capacity. Since capacity of highperformance systems such as large routers and switches, large data centers and high-performance computers has been increasing continuously in the last decade, the requirements on intrasystem interconnects have risen rapidly. The equipment of today’s large-scale systems is housed by a large number of racks, so that complexity, required number of transmission links and transceivers as well as energy consumption of current intrasystem interconnects is already very high. In order to enable a further scaling in capacity, new technologies and concepts for large-scale, high-speed and energy-efficient interconnection systems are needed [8]. Finally, an energy-efficient global network infrastructure that is optimized to efficiently support a rapid development and a broad use of applications and services for improved energy productivity can lead to very large indirect energy savings. Thus, complex interactions between the network and various advanced services and applications should be better understood in order to optimize both network infrastructure and applications for achieving an improvement in energy productivity in other branches of business and society. This is an important task because not only the savings in energy by developing and using novel networking technologies, i.e. the direct energy savings, can help to reduce the total electricity consumption, but also a large number of applications that can be made possible by an ubiquitous broadband network access could contribute indirectly even more to further reduce the global system energy demands. It has been estimated recently that the potential reduction of greenhouse gas (GHG) emissions through the use of advanced ICT applications and services is ten times higher than the ICT’s own emissions [9]. The estimated potentials for GHG emission reduc-
a) Smart Buildings (Legacy Buildings) Smart Buildings (Planing and Operating)
0%
10%
20%
b)
Smart Vehicles and Inteligent Transport
4% 3%
30%
40%
50%
Energy Supply Systems
Energy Efficiency in Industry
32%
Other (non-ICT) emissions 250
E-Commerce and Dematerialization
Telecommuting
Transport Mode Switching
10%
12%
GHG Emissions [MtCO2]
formation processing components and systems. For example, a traditional way to increase processing power of data processing devices was to increase the clock frequency. However, a further increase in clock frequency became hard due to the fundamental issues related to increased energy density and impossibility to rapidly remove the huge amount of heat generated in the device. As the feature size, and thus the integration density of semiconductor devices, is still increasing according to the Moore’s law, the limitation on clock frequency can be overcome to some extent by implementing multiple cores on a single die and by using dynamic clock and voltage scaling. Therefore, most of current highperformance processors are based on multicore architectures and utilize sophisticated monitoring techniques and dynamic power and thermal management.
20%
60%
70%
18%
80%
90%
1%
100%
ICT related GHG emissions
4.7
0.9
1.6 %
19 % 7.1
200
150 231.8
231.8
100
183.4
50
0 Current Situation
Case 1
Case 2
Fig. 3 a) Estimated potentials for green house gas (GHG) emission reductions [9] enabled by a broad use of various ICT services and applications and b) two hypothetical scenarios for the year 2030. Case 1: ICT related GHG emissions reduced by 80% in 2030, but the potentials of ICT services and applications for global GHG emission reductions are not exploited at all; Case 2: ICT related GHG emissions increased by 50% in 2030 and the potentials of some ICT services and applications for improving global energy productivity such as telecommuting, flexi-work, dematerialization and e-government are fully exploited.
tions [9] enabled by a broad use of various ICT services and applications in different other areas are graphically presented in Fig. 3. To see the potential influence of direct and indirect energy savings on the environment let us assume two hypothetical scenarios for the year 2030. In the the first scenario (Case 1), the ICT related GHG emissions, which have been estimated to be 4.73 MtCO2 [10], are reduced by 80% in 2030, while the potentials for global GHG emission reductions due to the use of ICT services and applications are not exploited at all. In this case, the relative reduction of the total GHG emissions from the estimated current value (236.5 MtCO2 ) is about 1.6%. In the second case (Case 2), we assume that the ICT related GHG emissions increase by 50% in 2030 because of a strong increase of both network capacity and number of high-speed terminals. The global communication network is then able to support advanced services and applications, so that the potentials of ICT services and applications for improving global energy productivity such as telecommuting, flexi-work, dema-
a)
1991 1993 1995
Year
1997 1999 2001 2003 2005
An example for the UK
2007 2009 0
2
4
6
8
10
12
14
GHG Emissions in Mtons per year b) Japan India
Region
terialization and e-government can be fully exploited. In this scenario, the large indirect energy savings would lead to a reduction of other (non-ICT) GHG emissions by 48.4 MtCO2 [10], which corresponds to a reduction of the greenhouse gas emissions by 19%. It is obvious, even from this simple example, that there is a need for a holistic approach to consider, within the same framework, technological, architectural and operational aspects of communication networks. It is very important also to include interactions between the global communication network and different other subsystems as well as to estimate environmental implications of the global system. In the next two subsections, we will briefly address two topics that may seem marginal at first sight, but in a holistic approach, they can gain in importance when considering the global system.
Europe (EU) China Canada Asia
An example for the Year 2009
US UK 0
2
4
6
8
10
12
14
16
18
GHG Emissions in Mtons per year
2.1 Greenhouse Gas Emissions Results on energy efficiency are often presented as the energy consumed in transmitting or processing a certain amount of data in a component or a system under observation. Thus, energy efficiency can be expressed in Watt/(bit/s) ≡ Joule/bit. Sometimes, it is expressed in bit/Joule, which represent the amount of data being transmitted or processed while consuming one Joule of energy. The total power (or energy) consumption is usually presented in Watt (or Joule), but sometimes it is appropriate to present it in kilograms of greenhouse gas (GHG) emitted, as it can be seen in Fig. 3. The latter has to be calculated carefully because the calculation of GHG emissions is not always straightforward. Statements about savings in GHG emissions are meaningless if not accompanied by all relevant parameters. The calculated savings strongly depend on assumptions made such as network/transport technology used, topology, nodes’ capacity, link and node utilizations, conversion factors, energy sources mix, regional and time dependencies as it can be seen in the example depicted in Fig. 4.
2.2 Alternative Energy Sources and Heat Reuse An efficient removing of the heat dissipated by the networking, data processing and storage equipment is not trivial. A ”rule of thumb” for estimating the power consumption of the room cooling equipment says that, depending on climate factors, each Watt of power consumed by networking equipment would require 0.4 0.6 Watt of power that needs to be supplied to the room cooling equipment [15]. An optimal planning of
Fig. 4 Different assumptions regarding energy sources mixes, regions and times lead to very different greenhouse gas (GHG) emissions for the same power consumption (17 TWh is used in this example): a) UK conversion factors for different years [13] and b) conversion factors for 2009 using energy mixes of different regions [14].
the room structure and the placement of racks according to the basic thermodynamic principles is the first step towards an efficient heat removing. The heat removed from the networking equipment can be used for other purposes such as for heating buildings, swimming pools, domestic hot water preparation, etc. In this way the overall system energy efficiency can be greatly improved. Systems for power supply to IT infrastructure usually have to be highly available and reliable. Therefore, developing and dimensioning of communications power supply systems have to be done very carefully including dimensioning the battery for backup, rectifiers, and cabling systems. Various alternatives for energy cogeneration and storage that are able to deliver a high output capacity per unit volume should be considered in order to achieve a further improvement in reliability and availability of the network infrastructure. Additionally, alternative energy sources can also improve the level of ”greening” of the whole system. In this spirit, one should consider exploiting ”green” energy sources such as photovoltaic solar power [16], wind-based, fuelcells, and pico-hydro co-generation systems [17].
3 Energy-Efficient Design of Core Networks This section focuses on technologies and methods for improving energy efficiency of core networks. The predominant type of traffic in today’s communication networks is the packet-based IP traffic. Thus, one could conclude that packet switching is and will remain the key technology in the Internet and that high-capacity IP routers will play the key role in forwarding data traffic in future core networks. However, their high complexity, large power dissipation and the need for large buffers make further scaling to very high capacities of hundreds of Tbit/s or even Pbit/s very difficult. Optical transmission and processing technologies provide higher speeds, larger transmission distances, and generally consume less power than electronic ones, but complex optical signal processing is difficult to realize and optical random access memories are not yet feasible [6, 18]. One of the crucial preconditions for implementing complex optical switching and signal processing systems is high-density photonic integration, which is still in an early developing phase when compared with the integration density of current electronic integrated circuits. Moreover, scalability and cascadability of optical switching and processing elements has to be improved in order to achieve very high capacities and to implement complex data processing directly in the optical domain. Even if we would be able to implement directly in the optical domain all the functions that are implemented in current electronic high-performance packet routers, such an all-optical packet router would be probably hardly able to provide any significant gain in energy efficiency in comparison to the all-electronic implementation [11, 18]. This fact is illustrated in Fig. 5, which shows some examples of energy consumption per bit of currently available switching elements [Fig. 5 a)] and estimated values for large Clos-based switching fabrics [Fig. 5 b)]. Although optical packet switches such as those based on semiconductor optical amplifiers (SOAs) provide a lower energy consumption per bit when comparing to electronic buffered packet switches and considering a simple configuration and small size [see Fig. 5 a)], they are, however, not easily scalable to very large capacities and port counts without performing any signal regeneration. This is because in optically transparent packet switching, the noise generated in each switching stage is accumulated through the entire switch, which can cause severe signal degradation. Some other effects such as attenuation, dispersion and nonlinear effects also contribute to the degradation of the optical signal. Therefore, optical signals must be regenerated after traversing a number of switch-
ing elements in order to remove the accumulated noise and other distortions. Additionally, in order to achieve proper function with an acceptable performance, optical packet switches often comprise packet synchronizers, wavelength converters and small optical buffers. The latter are often implemented as simple fiber delay lines (FDLs). On the other hand, electronic packet switches are mostly buffered and provide high performance, but optical-to-electronic and electronic-to-optical converters have to be placed at their input and output ports because the signal transmitted over fiber-based transmission lines is an optical one and has to be converted in the electrical domain before switching and processing by electronic components. As it can be observed form Fig. 5 b), which presents some results on energy per bit for large optical and electronic switches based on a number of smaller switching elements in a Clos arrangement, SOA-based optical packet switches do not provide any significant benefit regarding energy efficiency against electronic packet switches for a fixed data rate per port (i.e. per wavelength) of 10 Gbit/s. For lower aggregate switch capacities below 10 Tbit/s, it provides slightly better energy efficiency than its electronic counterpart, but as the capacity increases the number of required SOA devices and 3R regenerators increases too, which leads to an increase in energy per bit. An order of magnitude lower energy per bit show electronic circuit switches based on cross-point devices. They are able to provide high port counts and low energy consumption and are scalable to large sizes while consuming less energy than the both packet-switched options. Finally, optical circuit switches such those based on micro-electromechanical systems (MEMS) provide the lowest energy consumption and a very high port count of hundreds or even more than thousand ports. Thus, circuit switches provide higher capacity and lower power per bit than packet switches, but they usually suffer from poor bandwidth utilization because of their relatively large switching/ reconfiguration times and impossibility to take advantage of ”statistical multiplexing”. Therefore a combined effort is needed to develop not only new energy-efficient components, both optical and electronic ones, but also to design energy-optimized network concepts, protocols and algorithms. Methods for reduction of power consumption include advanced optical transmission and processing technologies as well as power-efficient electronic components, power-optimized structures, and transmission links that scale both link bit rate and supply voltage to optimize power consumption with respect to network utilization. A significant reduction of power consumption of the whole system can be achieved through developing
a)
Electronic buffered 4 × 4 packet switches
Energy per bit [pJ/bit]
has been shown that above 90% of traffic within backbone networks is using the transmission control protocol (TCP) [29]. Especially new applications such as IP television (IPTV), voice over IP (VoIP), video conferencing, and interactive gaming set very high requirements on the quality of service that cannot be easily met with pure packet switching.
1,000
6 × 6 12 × 12 100
SOA-based switches
10 Gbit/s line data rate
32 × 32 16 × 16
Electronic cross8×8 point switches 16 × 16 144 × 144 10 80 × 80
Optical 3D-MEMS
160 × 160
32 × 32
24 × 24 1 10
100
1,000
10,000
Aggregate switch capacity [Gbit/s]
b) Energy per bit [nJ/bit]
10.0
Electronic buffered packet switch
1.0
Optical SOA-based switch w/ synchronizers, FDLs, TWCs and 3R-reg
Electronic circuit switch based on large cross point switches
Optical circuit switch based on 3D MEMS w/ TWCs 10 Gbit/s line data rate 0.1 1
10
100
Aggregate switch capacity [Tbit/s]
Fig. 5 a) Examples of energy per bit of some currently available switching elements [19–24] and b) estimated energy per bit for large switching fabrics using the model form [6, 11] (MEMS: Micro-Electro-Mechanical System, SOA:Semiconductor Optical Amplifier, FDL: Fiber Delay Line, TWC: Tunable Wavelength Converter, 3R-reg: 3R Regenerator).
and applying efficient and dynamic power monitoring schemes to optimize the usage of available resources. The aim of using optimized algorithms and protocols for a power-aware network management is to identify interactions between the power management and the resource management as well as to achieve benefits of using a dynamically adaptive network. Additionally, new network concepts can be developed, which are able to provide at the same time lowpower consumption and high performance. Inactive or underutilized interfaces can be dynamically switched off or put into a low-power mode. A number of recent studies have concentrated on optimizing of both design and operation phases in wide area networks through proposing more efficient resource provisioning and protection schemes that utilize the low-power mode [27, 28]. The usage of power-on devices can be further increased and optimized by applying power-aware routing and wavelength assignment (RWA) [25,26]. When looking at the current Internet traffic, one can observe that many applications require establishing a connection. Thus, despite the connectionless nature of IP, the use of the core network is very connection oriented. Recently, it
Indeed, if we look more closely, we will find that there is plenty of circuit switching in core networks provided through transport technologies such as SONET/ SDH and WDM. However, the circuits in the Internet are considered by the IP as static point-to-point paths provided by layer 1 (e.g. SONET/SDH or OTN), which are completely decoupled from the IP layer (i.e. network layer - layer 3). Recently, different signaling mechanisms for a more dynamic circuit provisioning in the core area have been specified in different proposals including multiprotocol label switching (MPLS) [30], generalized multiprotocol label switching (GMPLS) [31], automatic switched transport network (ASTN) [32], Optical Internetworking Forum (OIF) [33], optical channel (OCh) and optical data unit (ODU) switching [34,35] as well as TCP switching [36]. A network architecture that allows integration of circuit switching in the core of the packet-switched Internet in an efficient way may be an appropriate solution [37]. Such an approach could be a kind of dynamic circuit switching, optical flow switching [38] or an integrated approach combining circuit, burst, and packet switching within a single network, which is referred to as hybrid optical switching (HOS) [39–43]. Through simplifying packet processing within the core network one can reduce the power consumption of core nodes at a large extent. Significant savings in energy can be achieved if a part of Internet traffic is switched in the circuit-switched manner rather than as individual packets [44]. Hybrid optical switching (HOS) refers to a combined optical and electronic implementation of network nodes and coexistence of different switching paradigms within the same network. Recently, different realization options for HOS network nodes have been studied. The realization options include a combined optical and electronic implementation of core network nodes able to switch optical circuits, bursts, and packets in an efficient way [37,44,45]. A HOS node can be composed of a slow optical switch and a fast switch as shown in Fig. 6 a). The fast switch can be implemented either in electronics, leading to a hybrid optical/electronic realization of the HOS node, or as an all-optical packet switch, thereby achieving a hybrid all-optical realization. If the ratio of wavelength channels being switched by the fast and by the slow switch can be dynamically changed according to the actual traffic situation, such a
Control Plane
Signaling
a)
Signaling
Processing of control information, signaling, scheduling and switch control Wavelength Channels 1
Input Fibers
Wavelength 1 Channels
Output Fibers
Fast Switch
N 1
N
Slow Switch
1
WDM Demultiplexers
WDM Multiplexers N
160
Improvement in Energy Efficiency (IE) [%]
a)
60% load
140 120 100 80
90% load
60 FFUC-VF
40
BF-VF + FDLs
20 20%
N
30%
40%
50%
60%
% of Resources Reserved for Circuits
b)
b)
Calculation of Power Consumption Power ConsumptionCalculation
Forwarding and Label Processing
Input Channels
Data Type ID
Packet Scheduler
WC
Burst Scheduler
WC
Circuit Scheduler
Output Channels
WC Scheduler Scheduler
Buffers
Fig. 6 Dynamically adaptive hybrid optical switching: a) generic representation of the HOS node architecture, b) main functional block of the simulator that implements the control plane (WC: Wavelength Converter).
8-bit Start Delimiter
L x 32-bit DA/SA or Label Stack
88-bit Resource Reservation
Type
Length
Offset
32-bit
32-bit
8-bit
8-bit CRC
Free-Slots 8-bit
8-bit End Delimiter
Slot-Length 8-bit
Fig. 7 Format of the control packet exchanged between HOS nodes for resource reservation, packet/burst scheduling and circuit establishment (DA/SA: Destination Address/Source Address, CRC: Cyclic Redundancy Check).
concept we refer to as the dynamically adaptive hybrid switching. In this concept, energy savings are achieved through switching off temporary unused ports of the fast switch. In a recent study, a simulation model for evaluating both blocking performance and total power consumption of dynamically adaptive HOS nodes has been implemented and applied to study energy efficiency of hybrid optical/electronic and hybrid all-optical realizations [45]. Capacities from a few Tbit/s to above 100 Tbit/s were took into consideration. An integrated control plane capable of supporting all three switching paradigms was proposed and implemented. In this proposal, control information is transmitted through a dedicated control channel by means of exchanging control packets. The control signal can be encoded together
Improvement in performance
1.E-02
Traffic Sources
1.E-03
40% of resources reserved for circuits
1.E-04 1.E-05
Relative reduction of packet loss rate
1.E-06 1.E-07 1.E-08 50%
Relative reduction of burst loss rate 60%
70%
80%
90%
Offered Load
Fig. 8 Results on energy efficiency and performance of combined optical/electronic realization of a HOS node: a) improvement in energy efficiency with respect to a conventional electronic IP router (Eq. 1) for two values of offered load, two scheduling algorithms and with or without fiber delay lines (FDLs) for packets contention resolution and b) relative decrease in packet and burst loss rates due to the use of a more efficient burst scheduling algorithm (BF-VF instead of FFUC-VF) and optical buffers (FDLs) for packet contention resolution (FFUC-VF: First Fit Unscheduled Channel with Void Filling, BF-VF: Best Fit with Void Filling).
with the data signal on the same optical carrier using, for example, subcarrier multiplexing (SCM). This technique has the advantages that control packets can be transmitted in parallel to data packets. The structure of the control packet is shown in Fig. 7. The control packet carries either an IP address or a stack of labels. That is, the HOS node can perform forwarding functions on the base of either source and destination IP addresses or GMPLS labels including label swapping. Thus, all advantages of label switching can be fully utilized. Additionally, there is a 88-bit long field containing information about traffic type (packet, burst or circuit), length of the incoming data unit, offset time in case of the transmission of a burst as well as slot length and number of free slots for time-domain multiplexed (TDM) circuits. Finally, there are start and end delimiters as well as a cyclic redundancy check (CRC) field for ensuring a reliable transmission of the control packet. The HOS core node receives control packets
that are generated by edge nodes, performs appropriate scheduling procedures, reserves required resources if possible and updates the corresponding fields in the control packet. The updated control packet is then sent to the next node. At the present, the integrated control plane includes only basic signaling and traffic management functions, while it can be easily extended to support more sophisticated signaling, routing and link management protocols of a more standard framework such as GMPLS. Also two different burst scheduling algorithms were implemented, namely the first fit unscheduled channel with void filling (FFUC-VF) and the best fit with void filling (BF-VF). The study considered two cases with and without short optical buffers (fiber delay lines - FDLs) for contention resolution. The main functional blocks of the simulator are shown in Fig. 6 b). Incoming control packets are received by the node and processed by the integrated control plane. The desired output port is defined through an inspection of the Address or Label Stack field and by performing the forwarding function. According to the type of traffic field the control plane performs either packet or burst or circuit scheduling and controls the usage of wavelength converters and optical buffers. Traffic generators were used to simulate the load to the node and the numbers of lost packets and bursts as well as rejected requests for establishing circuits were countered. Additionally, a model for estimating the total node’s power consumption was developed, which takes into account different realization options and actual utilization of low- and high-speed ports, wavelength converters and optical delay lines. Thus, it was possible to obtain results on both achievable throughput and power consumption for different realization possibilities and under different traffic conditions. For more information about the model, refer to [45]. Some exemplary results for different loads and percentages of resources reserved for the circuit-oriented traffic are shown in Fig. 8. In order to assess energy efficiency of the proposed concept (hyb), a new metrics was defined and used to estimate the achievable potential for improvement of energy efficiency (IE) with respect to a conventional electronic IP router (el): IE =
Th Th Pcons |hyb − Pcons |el Th Pcons |el
· 100 [%] ,
(1)
where Th represents the achievable throughput and Pcon is the power consumption of a network node providing this throughput. From Fig. 8a) it can be seen that an increase in energy efficiency above 100% is achievable if in average more than 50% of the active switching ports are slow ones, i.e., if 50% of the available resources is reserved for circuits. At a moderate load of
60% and higher percentages of circuit-oriented traffic, the parameter IE increases up to about 140%. However, for a very high load of 90%, the achievable improvement of energy efficiency is limited to approximately 110% because both burst and packet losses become high at very high loads, especially when a large portion of the resources is reserved for circuits. As it can be seen form Fig. 8b), both packet and burst loss rates can be reduced when implementing the BF-VF algorithm instead of FFUC-VF and using fiber delay lines (FDLs) as optical buffers. Here, the total capacity of the shared optical buffers was set to N × 1 kByte, where N denotes the number of switch ports. The improvement in node’s performance increases rapidly with the increase in the amount of incoming traffic and for about 90% of the offered load, both relative reductions in packet and burst losses reach the value of 103 . Although both implementation of an efficient scheduling algorithm and use of short FDLs for packet contention resolution may have a strong impact on switch performance, i.e. on burst and packet loss rates, it has, however, a very low, almost negligible influence on the achievable improvement in energy efficiency as it is evident from Fig. 8 a). This is because the use of optical buffers and an implementation of more effective scheduling algorithms usually lead to a higher achievable throughput, but at the same time it causes an increase in the total power consumption of HOS nodes, so that the ratio Th /Pcons |hyb does not change remarkably.
4 Energy-Efficient Design of Access Networks Now, we will address methods for improving energy efficiency in access networks. Within the access area, there is a variety of technologies and protocols currently in use or proposed for use in the future to relax the bottleneck of the first/last mile. The heterogeneity of protocols and a large number of network terminals lead to a complex structure and a high total power consumption of the access area. The equipment within the central office (CO) of network providers is responsible for aggregating the data originating from a large number of users and forwarding it to regional or metropolitan area networks. In the downstream direction, the traffic coming from the metropolitan area is distributed to end users through a distribution network that can be realized using different transmission media (copper, fiber or air) and different topologies (tree, ring or mesh). Currently, there are many different standards and implementation options for access networks. Broadband subscribers can choose between a wired access over telephone lines, in most cases a version of digital subscriber
line (DSL), and a kind of wireless access such as worldwide interoperability for microwave access (WiMAX), global system for mobile communications (GSM) or universal mobile telecommunications system (UMTS). Another widely deployed access technology is the hybrid fiber coax (HFC) network, which reuse the widely deployed Cable TV (CATV) network infrastructure.
The requirements on low power consumption in wired access networks are not as high as in wireless networks. Here, network terminals are usually supplied by the power grid and capacity, size and weight of batteries do not play a significant role. However, due to a large number of power-inefficient network terminals, the overall power consumption is very high. Therefore, one should concentrate on methods for improving the energy effiRecently, there have been a large number of projects ciency of access networks such as dynamic resource conconcentrating on fiber-based optical access networks for trol and power management, exploiting day/night utibroadband data transmission generally named fiber-tolization curves, and use of low-power consuming compothe-x (FTTx). An attractive FTTx solution is a pasnents [44]. Power-efficient architectures can be defined sive optical network (PON) that utilizes passive optical under consideration of using optical technologies to resplitters in the field in order to connect a number of duce the overall system energy consumption, and, at users, usually up to 32 or 64, to a single port of an agthe same time, to increase access rates. gregation switch in the CO. Optical access technologies Optical technologies have the potential to reduce that have been investigated, standardized, and implethe power consumption in the access area for an order of mented in the last decade include point-to-point (P-tmagnitude [47]. For a large number of users, high access P) optical Ethernet and point-to-multipoint (P-t-MP) data rates, and delivering of broadcast services such as passive optical networks (PONs) such as ATM-based standard-definition (SD) and high-definition (HD) telePON (APON/BPON), 1 Gbit/s Ethernet-based PON vision, which are realistic assumptions for the access (EPON), 10 Gigabit Ethernet PON (10G-EPON), and wavelength-division multiplexed PON (WDM-PON). Hy- area of today and in the near future, passive optical networks (PONs) seem to be able to provide a very brid PONs that combine WDM and TDM in a single high energy efficiency. Due to the fact that in passive network and long-reach PONs (LR-PONs) are the last optical networks the downstream signal is simply split proposed members of the PON family aiming to proin a passive splitter down to the optical network termivide a more cost-effective and extended-reach operanals located at the customer premises, these networks tion. The reach of the network can be extended from can inherently provide broadcast and multicast operathe traditional 20 km range to 100 km and beyond by tion needed for the distribution of television programs exploiting optical amplification and WDM technologies. to a large number of users without any reduction of the Additionally, the maximum number of users connected available bandwidth or introduction of additional deto a single LR-PON, i.e. to a single optical line termilays. Indeed, various options for achieving broadband nal (OLT) port, increases to above 1,000. Thus, we can access have been recently evaluated regarding achievrecognize the trend of merging access and metropolitan able energy efficiency [48]. These options include fiberareas and combining aggregation and access functions to-the-curb (FTTC) topology with ADSL2+, VDSL2 into a single integrated and high-performance network and HFC DOCSIS 3.0 as well as fiber-to-the-home (FTTH) [46] options based either on point-to-multipoint (P-t-MP) There are a number of methods proposed for reductopology such as Ethernet passive optical network (EPON), tion of power consumption in access networks. EspeGigabit PON (GPON) and 10G-EPON or point-to-point cially for mobile devices, a very low consumption is of (P-t-P) optical Ethernet with 1 Gbit/s and 10 Gbit/s great importance because the batteries have limited cadata rates. In a recent study [48], the above mentioned pacity, size, and weight. Additionally, because wireless networks were compared in terms of energy efficiency technologies use shared transmission medium, there is for four network scenarios, namely when assuming eia strong interference at receivers that needs to be mitither unlimited or limited uplink capacity of the aggregated by using advanced modulation formats and codgation switch and for two different percentages of the ing schemes as well as intelligent control of the transdownstream data rate dedicated to the broadcast trafmitter power. Efficient channel selection algorithms are fic. For a detailed description of the model used for usually combined together with power-aware transmisenergy efficiency evaluation, refer to [48]. sion and routing protocols. Similar to wireless sensor Here, we use the following definition for energy effinetworks, also radio access networks are designed a priciency: ori for low consumption. Although there has been a lot of progress towards energy efficient mobile devices and base stations there is still some room for additional imNuser · Ruser , Eef f = (2) provement. Ptotal
0%
[Mbit/J]
Energy efficiency
it/J]
0%
ic
10 100 1,000 10,000
O rC
ff 60% tra ast 80% adc o 100% r B
Energy efficiency
Energy efficiency
20% 40%
[Mbit/J]
20 18 16 14 12 10 8 6 4 2 0
Energy efficiency [Mb
[Mbit/J]
VDSL2
20% 40% 60%
pe
s dca
O
O rC
a Bro
10 100 1,000 10,000
rC pe
pe
60% 80% 100%
c affi t tr
20 18 16 14 12 10 8 6 4 2 0
s er Us
s er Us
20% 40%
0%
ic aff t tr 80% cas d a 100% B ro
HFC
s er Us
10 100 1,000 10,000
20%
40%
CO
O rC
20 18 16 14 12 10 8 6 4 2 0
a adc Bro
60%
r pe
pe
ADSL2+
80%
600 550 500 450 400 350 300 250 200 150 100 50 0
10 100 1,000 10,000
0%
0%
fic raf st t
Energy efficiency [Mb
[Mbit/J]
Energy efficiency
20%
fic raf st t 80% dca a o 100% Br 40%
60%
20%
40% 60%
100%
P-t-P 10G Ethernet
s er Us
s er Us
10 100 1,000 10,000
10 100 1,000 10,000
0%
O rC
600 550 500 450 400 350 300 250 200 150 100 50 0
P-t-P 1G Ethernet
20%
ic aff t tr 80% cas d a 100% Bro 40%
60%
pe
CO
O rC
r pe
pe
10 100 1,000 10,000
it/J]
0%
ic aff t tr 80% cas d a 100% Bro 40%
60%
600 550 500 450 400 350 300 250 200 150 100 50 0
s er Us
s er Us
20%
s er Us
10 100 1,000 10,000
10G-EPON
Energy efficiency [Mb
600 550 500 450 400 350 300 250 200 150 100 50 0
it/J]
GPON
Energy efficiency
600 550 500 450 400 350 300 250 200 150 100 50 0
[Mbit/J]
EPON
80% 100%
a adc Bro
st
0%
ffic t ra
Fig. 9 Energy efficiency of various broadband access options including fiber-to-the-home (EPON, GPON, 10G-EPON, P-t-P 1G and 10G Ethernet) and fiber-to-the-curb (ADSL2+, HFC and VDSL2). The results show the amount of data in Mbit that can be transmitted while consuming one Joule of energy. The considered access options are compared for different portions of downstream data rate reserved for broadcast services and for various sizes of the network form 10 to 10,000 users per CO. Here, it is assumed that the uplink capacity of the aggregation switch in the CO is infinite.
where Eef f represents the amount of traffic transmitted in the network per unit of energy, which is given in bit/s/W ≡ bit/J, Ptotal is the total network power consumption, while Nuser and Ruser represent the number of active users and the calculated available data rate per user, respectively. Figs. 9 and 10 present the estimated energy efficiency of the considered access networks for different network sizes and percentages of the downstream data rate reserved for delivering of broadcast services. As it can be seen form these figures, FTTC technologies generally show for an order of magnitude lower power efficiency than the FTTH options. In the theoretical case of unlimited capacity of the uplink in the aggregation switch (see Fig. 9), the highest efficiency can be achieved when using high-speed optical access technologies with 10 Gbit/s data rates, while when looking at a more realistic case with an limited uplink (Fig. 10), EPON and GPON become the most
efficient options for large networks, i.e. for a large number of users per central office. In the limited uplink scenario, a remarkable decrease in energy efficiency can be observed for larger network sizes, especially in the case of the high-speed access options such as P-t-P 10G Ethernet and 10G-EPON. The uplink limitation also affects HFC and VDSL2 networks, while ADSL2+ remains unaffected. This is because ASDSL2+ provides lower data rates than the other two considered FTTC options, so that the limitation of uplink capacity, which we assumed to be 320 Gbit/s in this particular case, is not reached even for a very large number of users. The effect of decreasing energy efficiency in case of limited uplink capacity and large network size can be explained as follows. A growing number of users imply an increase in required number of network terminals, which consequently leads to a higher total power consumption. At the same time, the achievable data rate
20% 40% 60%
it/J]
Energy efficiency [Mbit/J]
10 100 1,000 10,000
O
CO
Br
ffic
rC pe
80% 100%
a t tr cas oad
0%
VDSL2
20%
s er Us
10 100 1,000 10,000
O rC pe
r pe
ffic 60% tra ast 80% dc a 100% Bro
as 80% dc oa 100% Br
20 18 16 14 12 10 8 6 4 2 0
s er Us
s er Us
20% 40%
Energy efficiency [Mb
Energy efficiency [Mbit/J]
0%
10
20 18 16 14 12 10 8 6 4 2 0
0%
c affi
it/J]
HFC
20 18 16 14 12 10 8 6 4 2 0
tr as t 80% ad c 100% Bro
0% 20% 40% ic aff 60% t tr
10
se 100 rs 1,000 pe 10,000 rC O
20%
600 550 500 450 400 350 300 250 200 150 100 50 0
Energy efficiency [Mb
ADSL2+
100 1,000 10,000
U
a 60% t tr as 80% dc a 100% o Br
40%
60%
600 550 500 450 400 350 300 250 200 150 100 50 0
P-t-P 10G Ethernet
0% 20% 40% ffic
10
a Bro
it/J]
P-t-P 1G Ethernet
Energy efficiency [Mbit/J]
600 550 500 450 400 350 300 250 200 150 100 50 0
Us 100 er 1,000 s pe r C 10,000 O
80% 100%
ffic
Energy efficiency [Mb
s
10 100 1,000 10,000
0%
ra st t dca
CO
d ca
O
CO
a Bro
20% 40% 60%
r pe
80% 100%
c af f i t tr
rC pe
r pe
60%
10 100 1,000 10,000
0%
s er Us
20% 40%
s er Us
s er Us
10 100 1,000 10,000
10G-EPON
Energy efficiency [Mb
600 550 500 450 400 350 300 250 200 150 100 50 0
it/J]
GPON
Energy efficiency
600 550 500 450 400 350 300 250 200 150 100 50 0
[Mbit/J]
EPON
0%
40% 60% 80% 100%
a ad c Bro
f ic raf st t
Fig. 10 Energy efficiency of various broadband access options including fiber-to-the-home (EPON, GPON, 10G-EPON, P-t-P 1G and 10G Ethernet) and fiber-to-the-curb (ADSL2+, HFC and VDSL2). The results show the amount of data in Mbit that can be transmitted while consuming one Joule of energy. The considered access options are compared for different portions of downstream data rate reserved for broadcast services and for various sizes of the network form 10 to 10,000 users per CO. Here, it is assumed that the uplink capacity of the aggregation switch in the CO is limited to 320 Gbit/s.
per user decreases due to the bandwidth limitation in the CO, i.e., the users can not exploit their maximum data rates anymore. The consequence is an increase in power consumption per bit/s, or equivalently, a decrease in energy efficiency. Delivering broadcast (and also multicast) services in a passive optical network leads to an improvement in energy efficiency because broadcast traffic is copied in the optical domain and transmitted to all users in the downstream direction without any additional processing and any further increase in energy consumption. The larger the amount of broadcast traffic the higher the energy efficiency of PON networks. For example, an increase of 60% in broadcast traffic leads to a four times higher energy efficiency. On the other hand, energy efficiency of FTTC and P-t-P FTTH networks does not change with changing the amount of broadcast traffic. This is because delivering broadcast services in P-t-P
networks requires copying of data in the electronic domain and sending them separately to each user. Therefore, the amount of data transmitted per unit of energy remains unchanged when increasing the amount of broadcast traffic in case of point-to-point FTTC and FTTH networks. The results presented here suggest that the nextgeneration, high-speed optical access technologies such as P-t-P 10G Ethernet and 10G-EPON have the potential to provide the highest energy efficiency for the case of practically unlimited uplink of the aggregation switch, i.e. if there would be a large enough capacity in the metropolitan area such that the very high bandwidth supported by these technologies could be concurrently provided to a large number of users. For the case of a limited uplink capacity, which is a more realistic assumption for current networks, the options providing a lower data-rate per user such as EPON and
GPON show better efficiency. FTTC options provide in general lower energy efficiency than optical access networks, but in the case of a very large number of users and strongly limited capacity of the uplink, the FTTC options become comparably efficient. In the case of a high percentage of downstream traffic used for delivering broadcast services, passive optical networks are the most preferable option from energy efficiency point of view. Despite the efforts to develop new energy-efficient technologies, different other methods such as poweraware protocols and algorithms as well as efficient network and power management must be developed and applied in order to make possible highly energy-efficient access networks that have the ability to dynamically adapt its performance, resource allocation, and power consumption to actual needs. Energy savings can be then achieved by either using low-power modes or switching off inactive devices. It has been recently shown [44] that if 60% of end users are not active then energy savings of up to 27% (or up to 58%) can be achieved when inactive equipment is operating in the low-power state (or CPE is switched off). This method has a huge potential because network terminals are usually always on even if not used. The time period during which the equipment is actively used is relatively short in comparison to its inactivity period. There are some time periods such as, for example, early morning hours, during which the most of the network terminals could be switched off. Finally, alternative and renewable energy sources such as those based on solar and wind energy can be effectively used either as backup sources or as the default power source while mains are used as backup or a standby. Solar power has already been used to power radio base stations and other network equipment. However, it has mostly been used for disaster relief, in developing countries and in vastly rural areas, where no direct connection to the power grid is available. Since recently, renewable energy sources have been also considered for powering wired network equipment for energy savings purposes [16]. 5 Advanced Applications Enabling Energy Savings In this section, various applications and services that can be used to improve energy productivity in other areas of business and society are briefly reviewed. The intention of this section is to address the most important properties of different applications and to serve as a link between the previous two sections that focuses on network technologies and the next section that look
at the global system including not only networking aspects but also interactions between the communication network, applications and other subsystems that make use of the global network infrastructure. The advanced applications enabling energy savings can be grouped into four categories, namely into applications for advanced communication, those for remote automation and process control, for system optimization, and for support of transportation. Another promising application is the cloud computing, which tries to optimally utilize scalable and virtualized resources of globally interconnected computing power. In Section 2, we already discussed the potentials for environmental impacts of different applications. In the following, various advanced applications are briefly reviewed regarding their basic features and usability. – Applications for Advanced Communication Some examples of advanced communications applications are those for entertainment (video on demand, high-definition TV, interactive gaming), egovernment, telemedicine, e-health, high-definition and holographic videoconferencing, e-learning, teleworking, e-commerce, e-shopping and e-security. Different applications set different requirements on the network infrastructure. For example, high-definition TV (broadcasting) requires a very high downstream bandwidth, while upstream bandwidth and roundtrip time have no relevance for such an application. In contrast, for high-definition videoconferencing and interactive gaming both high symmetric bandwidth and low end-to-end delays are of high importance. – Applications for Remote Automation and Process Control Applications for building energy management systems can help a lot to reduce energy consumption in hotels and office buildings. The manufacturing process controls that provide real-time data generated by production machinery can be used to improve various processes and their communication in the production sector. Such applications usually require the utilization of highly interconnected systems that consist of a large number of different sensor nodes. Since the most applications for remote automation and process control does not require high bandwidth, capacity will not be a crucial issue for those systems. However, end-to-end network delay and data consistency are the most important parameters for such an application, because the data generated and transmitted over the network are mostly time critical and error sensitive. – Applications for System Optimization
Smart grids are an example of applications for system optimization. They use advanced software applications and communication network infrastructure together with sophisticated sensing and monitoring technologies to manage energy supplies, energy demand, and energy transmission in a smart way. Among other benefits of smart grid systems is their ability to integrate distributed and heterogeneous energy sources including combined heat and power systems, photovoltaics, wind turbines, and fuel cells. Also safety and availability of the communication system is an important condition for stable and functional smart grids. – Applications in Support of Transportation An integration of high-tech supply chain logistics and warehousing technologies are becoming increasingly important to governments and business. Some e-commerce and web shopping applications can also be integrated into the logistics and warehousing systems. Traffic information services can be provided to logistics companies and transport operators carrying people and goods, in order to better control the traffic situation and to avoid traffic jams. An intelligent and networked traffic control system can rapidly react to an unbalanced traffic situation.
6 Improving Global Energy Productivity As mentioned several times in this paper, advanced ICT services and applications can potentially help a lot to reduce the global greenhouse gas (GHG) emissions. On the other hand, a further improvement in capacity and performance of the global network infrastructure can cause a higher network related energy consumption. Thus, a combined effort is needed to develop new software applications and systems for optimizing processes in many different areas as well as to improve the global network infrastructure regarding high energy efficiency and high performance. Consequently, there is a need for a holistic approach that is able to capture different subsystems and interactions between them in an integrated and efficient way. The holistic approach should concentrate on the global system comprising, additionally to the global communication network itself, a number of specific software applications for use in many other areas as shown in Fig. 11.
A broad use of such applications can lead to a reduction of energy consumption in the respective subsystem and could also influence some other subsystems because of the interdependencies between them. For example, both applications for e-commerce and telecommuting influence directly the transportation sector, which can be further optimized by introduction of applications for – Cloud Computing and Virtualization intelligent transport systems. Traffic information serCloud computing is a promising approach to supvices can be provided to logistics companies and transport ICT applications and to efficiently deliver ICT port operators carrying people and goods, in order to services by improving the utilization of data cenbetter control the traffic situation and to avoid trafter resources. It provides an inherently energy effic jams. An intelligent and networked traffic control ficient virtualization of networked data processing system can rapidly react to an unbalanced traffic sitand storage resources. Savings in energy are achieved uation. An integration of high-tech supply chain logisby allocating the workload to the minimum numtics and warehousing technologies are becoming increasber of physical servers and by switching the inactive ingly important to governments and business. Some servers off in a dynamic manner. Apart from the ene-commerce and web shopping applications can also ergy consumed by servers, i.e. by central processing be integrated into the logistics and warehousing sysunits (CPUs) and memory, a significant portion of tems. On the other hand, applications for building enthe total energy consumed in data centers is due ergy management systems can help a lot to reduce ento the internal interconnection network. Moreover, ergy consumption in hotels and office buildings. Thus, in order to be able to optimize the utilization of all the complex interdependencies and interactions beprocessing and storage resources and to apply an tween different subsystems, applications and the global energy-efficient virtualization technique on a global communication network should be efficiently considscale, an efficient and high-performance global network infrastructure is needed. Thus, an energy-efficient ered in the integrated and holistic approach, in order to be able to identify applications and the main pacloud computing requires, additionally to energyrameters of their interaction with the global commuefficient CPUs, memory systems and virtualization techniques, also energy-efficient and high-performance nication network and other subsystems, to assess each particular application regarding its potential for pronetwork technologies, protocols and applications. cess/system optimization and energy savings, to define interactions and interfaces between subsystems that include the amount and characteristics of traffic and energy transmitted through the boundaries of subsystems,
Information Flow Energy Flow
Smart Buildings
Interdependences
eCommerce
Heat ∆Q
∆Q
Transportation
Reuse ∆Q
∆Q
Global Communication Network
Industry ∆Q
Telecommuting
∆Q
Smart Offices
∆Q
∆Q
∆Q
Direct Supply from Renewable Energy Sources
∆Q
Smart Grid ∆Q
Fig. 11 High-level illustration of the global system including the global communication network and other subsystems that can make use of the global network infrastructure. The figure also shows information and energy flows as well as interdependencies within the global system.
and finally, to assess different concepts concerning their potential for energy savings. The model of global communication networks, which represents the central part of the global system as presented in Fig. 11, should take into account not only technological issues and different realization options but also social, economical, and demographic peculiarities as well as possible future developments. Such a model could comprise a number of sub-models needed to study different network areas and technologies in a detailed manner, whilst the overall picture can be obtained by joining the individual sub-models together into a global hierarchical model with a manageable complexity. For this purpose, the global communication network can be divided into different areas based on geographical, technological, and operational aspects. For each network area, a different simulation model can be developed, which considers all peculiarities of the particular area such as suitable network technologies, topologies, configuration parameters and realistic traffic scenarios. These sub-models can be then connected to each other in a hierarchical manner, where the lowest hierarchy represents the network segment close to the traffic generators (i.e. end user’s equipment) and the highest hierarchical level are the high-capacity long-haul transmission links that interconnect continental-wide networks (i.e. intercontinental links). Presumably, the most logical way to divide the model of the global communication network into sub-models is to follow the network area principle, namely to model separately local, metropolitan, regional, national-wide, and continentwide networks. For each of the sub-models, we can consider different network concepts and transmission technologies as depicted in Fig. 12 a). Statistical data on ICT applications and services as well as on user behav-
ior can be then used to set parameters of traffic generators. An illustrative example of how to define the traffic patterns is shown in Fig. 12 b), c) and d), in which the main characteristics of various applications such as average data rate, maximum data rate and appropriate distribution functions as well as average usage of each application over the day are taken into account. In this way, we can study the influence of new applications and include user behavior in order to define different scenarios for possible future developments. The interface between two sub-models, i.e., between two hierarchical levels, is defined by the amount and characteristics of the aggregated traffic sent/received by the gateway interconnecting these two network areas. The following steps can be made when developing a sub-model: 1. first, network nodes can be modeled by taking into account technological and architectural aspects, 2. then, the network sub-models are developed under consideration of different concepts, topologies, communication protocols, and traffic scenarios, 3. the total power consumption of a sub-model is calculated using realistic values for each functional block and according to the actual utilization of network elements. 4. finally, the flow of information and energy through the entire global communication network can be identified and evaluated by defining and implementing the interfaces between the sub-models, which would lead to a holistic model of interconnected sub-systems at a high hierarchical level. In addition, various analogies between classical thermodynamics and communication systems could be also included in such a holistic approach. Since all components of a communication system are physical objects that need energy to properly function, any act
a)
Intercontinental Links
User Behaviour Information Generation
Model of Model of Model of Continent-wide Model of National-wide Metro/Regional Networks Access Networks Networks (e.g. SONET/SDH, Networks (e.g. SONET/SDH, (e.g. SONET/SDH, OTN,WDM, (e.g. HFC, xDSL, OTN, WDM, Ethernet, OTN, Transatlantic, FTTH, UMTS, OCS, OBS, Optical MANs, OCS, OBS, WiMax, LTE) OPS) WDM) OPS)
Information Reception
Day/Night Curves Information Generation Information Reception
Traffic Scenarios Interface between Models (Gateway)
b) App. No. #1 #2 #3 #4 #5 #6 #7 #8 #9 #10 #11 #12 #13 #14
c) Description Telephone (local provider) VoIP (over Internet) Digital Radio SDTV ( Broadcast) HDTV (Broadcast) VoD (Video on demand) Classic Internet Services Filesharing Videostreaming Online Gaming Videoconference Home Office via VPN Cloud Storage & Processing Remote Home Monitoring
Data rate [Mbit/s] DS US Total 0.064 0.064 0.128 0.064 0.064 0.128 0.128 0 0.128 2 0 2 20 0 20 2 0 2 0.04 0.04 0.08 20 10 30 2 0 2 1 1 2 2 2 4 1 1 2 1 1 2 0.005 0.8 0.805
d)
Time of the Day 00:00 01:00 02:00 03:00 04:00 05:00 06:00
#1 #2 #3 #4 #5 Tel VoIP Radio SDTV HDTV 50 20 700 30 10 50 50 700 20 10 50 100 700 20 7 50 40 700 20 8 50 100 700 20 10 50 100 700 20 30 50 100 700 20 60
User Behaviour 1 No. of users of the applications #6 #7 #8 #9 #10 #11 #12 #13 #14 0.9 VoD Inter File Sh. V-stream Gaming V-conf VPN Cloud RHM 10 70 10 0.8 5 100 5 10 2 40 10 36 10 0.7 5 100 5 10 2 40 5 26 10 5 100 5 10 2 40 4 73 10 0.6 5 100 10 10 2 40 5 45 30 0.5 5 100 10 10 2 40 8 75 50 5 100 10 10 2 40 0.4 6 2 60 5 100 10 10 2 40 0.3
App. #1
App. #2
0.2 0.1
App. #10 #9 #8 #7 #6 #5 #4 #3 #2 #1
0 1 2 3 4 5 6 7 8 9 10 11 12 13 14 15 16 17 18 19 20 21 22 23 24
Distribution of Call Duration
Time of the Day [hours]
Distribution of Packet/File Length
Fig. 12 a) Hierarchical approach to model performance and energy efficiency of the global communication network; b), c) and d) hypothetical examples of applications characteristics and user behavior: b) applications’ characteristics, c) user behavior respective application use and d) an example presenting application-specific traffic over the day.
of communication is always a dissipative process. On the other hand, perceivable information itself is physical in nature. We are not able to generate, transmit, receive or process information without its physical representation. Thus, the logical consequence is that any physical system for presenting and exchanging of perceivable information consumes and dissipates energy. Therefore, flows of information and energy within communication systems at both microscopic and macroscopic levels can be identified and treated using wellestablished approaches and tools of thermodynamics. Some thermodynamic aspects of communication systems have been presented and discussed by the author in a recent paper [50]. Such an approach to model the global communication network by taking into account information and energy (or entropy) flows and including thermodynamic aspects of communication systems could be generally applicable and would have the potential to provide an efficient treatment of the global system. 7 Conclusions In conclusions, the paper briefly addresses technologies and architectures for implementing high-performance and energy-efficient network elements. Various methods for reducing power consumption and increasing power efficiency of wired core and access networks are described. Through reducing the energy consumption while
concurrently increasing capacity and performance of networks one can improve the energy efficiency of the network infrastructure on the one hand and ensure an unhindered development of new broadband applications on the other, which could consequently have direct and indirect positive influences on the global energy consumption and energy-related carbon dioxide emissions. A holistic approach integrating technological aspects, power-aware protocols and algorithms as well as interdependencies between the global communication network and different other subsystems can potentially lead to an optimized network operation and large improvements in global energy productivity. References 1. Cisco, white paper, June 2010. 2. Point-Topic, http : //point − topic.com/gbsh ome.php, 2010. 3. Climate Group & GeSI, Report 2007. 4. C. Lange, D. Kosiankowski, C. Gerlach, F.-J. Westphal, A. Gladisch, ”Energy Consumption of Telecommunication Networks”, ECOC 2009, Vienna, Austria, Sept. 20- 24, 2009, paper 5.5.3 5. The Climate Group: ”SMART 2020: Enabling the low carbon economy in the information age”, GLobal eSustainability Initiative, Techn. Rep. 2008. 6. S. Aleksic, ”Analysis of Power Consumption in Future High-Capacity Network Nodes”, IEEE/OSA Journal of Optical Communications and Networking (JOCN), vol. 1, no. 3, pp. 245 - 258, 2009. 7. Top500 Computer Sites: Statistics on high-performance computers, http : //www.top500.org/
8. N. Fehratovic, S. Aleksic, ”Power Consumption and Scalability of Optically Switched Interconnects for HighCapacity Network Elements”, Optical Fiber Communication Conference and Exposition (OFC 2011), Los Angeles, CA, USA, March 2011, pp. JWA84-1 - JWA84-3. 9. WWTF, ”The potential global CO2 reductions from ICT use”, WWTF report, 2008. 10. WWTF, ”Outline for the first global IT strategy for CO2 reduction”, WWTF report, 2008. 11. S. Aleksic, ”Electrical Power Consumption of Large Electronic and Optical Switching Fabrics”, IEEE Winter Topicals 2010, Majorca, Spain, pp. 95 - 96, 2010. 12. S. Aleksic, ”Energy Efficiency of Electronic and Optical Network Elements” (Invited), IEEE Journal on Selected Topics in Quantum Electronics, Vol. 17, No. 2, March/April 2011, pp. 296 - 308. 13. AEA, ”2009 Guidelines to Defra / DECC’s GHG Conversion Factors for Company Reporting”, September 2009. 14. Carbon Neutral Company, ”Carbon Offset Factors”, September 2009. 15. ”Managing Data Center Power and Cooling”, white paper, Force10 Networks, Inc., 2007. 16. K. Ennser, S. Mangeni, S. Taccheo, and S. Aleksic, ”Techno-economic feasibility studies for Solar powered Passive Optical Network” to be published in SPIE Photonics West 2011, San Francisco, CA, USA, SPIE proceedings vol. 7958, January 2011, pp. 1-7. 17. Motorola, ”Alternatives for Powering Telecommunications Base Stations”, White Paper, 2007. 18. R. S. Tucker, ”The Role of Optics and Electronics in High-Capacity Routers”, IEEE JLT, Vol. 24, No. 12, December 2006, pp. 4655 - 4673. 19. Vitesse: VSC3040 and VSC3008, cross-point switches, data sheets, http : //www.vitesse.com, 2008. 20. AMCC: PRS-Q80G, packet switch, data sheets, http : //www.amcc.com, 2009. 21. Analog Devices: ADN4604, cross-point switch, data sheets, http : //www.analog.com, 2009. 22. Fulcrum Microsystems: FM3224 and FM3212-buffered packet switches, http : //www.f ulcrummicro.com/, 2010. 23. H. Wang, A. Wonfor, K. A. Williams, R. V. Penty, I. H. White, ”Demonstration of a Lossless Monolithic 16x16 QW SOA Switch”, Proceedings of the 35th European Conference on Optical Communication (ECOC 2009), September 2009, Vienna, pp. 6.2.3-1/2. 24. M. Yano, F. Yamagishi, and T. Tsuda, ”Optical MEMS for Photonic SwitchingCompact and Stable Optical Crossconnect Switches for Simple, Fast, and Flexible Wavelength Applications in Recent Photonic Networks”, IEEE Journal on Selected Topics in Quantum Electronics, pp. 383-394. 25. B. Puype,W. Vereecken, D. Colle, M. Pickavet, and P. Demeester, ”Power reduction techniques in multilayer traffic engineering”, presented at the ICTON, Sao Miguel, Portugal, Paper Mo.B3.1, Jun. 2009. 26. I. Norros and H. Flinck, ”Powering Internet with Powerlaw Networking”, Springer Telecommun. Syst. Vol. 48, No. 1-2, 2011, pp. 63-75. 27. A. Muhammad, P. Monti, I. Cerutti, L. Wosinska, P. Castoldi, A. Tzanakaki, ”Energy-Efficient WDM Network Planning with Dedicated Protection Resources in Sleep Mode”, GLOBECOM 2010, Dec. 2010, Miami, Florida, USA, pp. 1 - 5. 28. I. Cerutti, N. Sambo, and P. Castoldi, ”Sleeping Link Selection for Energy-Efficient GMPLS Networks”, J. Lightwave Technol. Vol. 29, Issue 15, 2011, pp. 2292-2298.
29. C. Fraleigh, S. Moon, B. Lyles, C. Cotton, M. Khan, D. Moll, R. Rockell, T. Seely, and C. Diot, ”Packet-level traffic measurements from the sprint IP backbone”, IEEE Netw. Mag., vol. 17, no. 6, pp. 6-16, Nov.-Dec 2002. 30. IETF, ”Multiprotocol Label Switching Architecture”, RFC3031, January 2001. 31. A. Banerjee, J. Drake, J. Lang, B. Turner,D.Awduche, L. Berger, K.Kompella, and Y. Rekhter, ”Generalized multiprotocol label switching: an overview of signaling enhancements and recovery techniques”, IEEE Commun. Mag., vol. 39, no. 7, pp. 144151, Jul. 2001. 32. ITU Telecommunication Standardization Sector, ”Architecture for the automatic switched transport network (ASTN)”, ITU-T Rec. G.807/Y.1302 ed, Nov. 2001. 33. G. Bernstein, B. Rajagopalan, and D. Spears, ”OIF UNI 1.0controlling optical networks”, White paper, Optical Internetworking Forum, 2001. 34. ITU Telecommunication Standardization Sector, ”Optical transport network (OTN)”, ITU-T Rec. G.709/Y1331 ed., Mar. 2003. 35. ITU Telecommunication Standardization Sector, ”Optical transport hierarchy”, ITU-T Rec. G.871/Y.1301 ed., 2000. 36. P. Molinero-Fern` andez and N. McKeown, ”TCP switching: exposing circuits to IP”, IEEE MICRO, vol. 22, no. 1, pp. 8289, Jan./Feb. 2002. 37. S. Aleksic, , ”Power Consumption of Hybrid Optical Switches”, in Proceedings of OSA/IEEE Optical Fiber Communication Conference and Exposition (OFC 2010), San Diego, CA, USA, paper OThP6, 2010. 38. W.W.S. Chan, ”Optical Flow Switching”, in Proceedings of OSA/IEEE Optical Fiber Communication Conference and Exposition (OFC 2010), San Diego, CA, USA, paper OWI6, 2010. 39. H.L. Vu, A. Zalesky, E.W..M. Wong, Z. Rosberg, S.M.H. Bilgrami, M. Zukerman, and R.S. Tucker, ”Scalable Performance Evaluation of a Hybrid Optical Switch, IEEE JLT, 23, 2005, 2961- 2973. 40. B. Chen and J. Wang, ”Hybrid Switching and P-Routing for Optical Burst Switching Networks”, IEEE JSAC, 21(7), 2003, pp.1071-1080. 41. E. W. M. Wong and M. Zukerman, ”Analysis of an optical hybrid switch,” IEEE Commun. Lett., vol. 10, pp. 108110, 2006. 42. M. De Leenheer, C. Develder, J. Buysse, B. Dhoedt, and P. Demeester, ”Dimensioning of Combined OBS/OCS Networks”, WOBS 2008, 2008. 43. M. Takagi, H. Li, K. Watabe, H. Imaizumi, T. Tanemura, Y. Nakano, and H. Morikawa, ”400Gb/s Hybrid Optical Switching Demonstration Combining MultiWavelength OPS and OCS with Dynamic Resource Allocation”, OFC2009, 2009, paper OTuA6. 44. S. Aleksic, ”Technologies and Approaches for Improving Energy Efficiency of Network Elements” (invited), in Proceedings of OSA Photonics in Switching (PS 2010), Monterey, CA, USA, paper PTuB3, July 2010. 45. M. Fiorani, M. Casoni, S. Aleksic: ”Performance and Power Consumption Analysis of a Hybrid Optical Core Node”, IEE/OSA Journal of Optical Communications and Networking, Vol. 3, No. 6, 2011, pp. 502-513. 46. S. Aleksic, ”Optically Transparent Integrated MetroAccess Network”, Springer Telecommun. Syst., Published online in June 2011, pp. 1 - 11. 47. S. Aleksic, A. Lovric, ”Power Consumption of Wired Access Network Technologies”, 7th IEEE/IET International Symposium on Communication Systems, Networks and Digital Signal Processing (CSNDSP 2010), Newcastle, June 2010, pp. 154-158.
48. S. Aleksic, A. Lovric, ”Power Efficiency in Wired Access Networks”, in Elektrotechnik und Informationstechnik (e&i), Springer, Vol. 127, November 2010, Issue 11. 49. A. Lovric and S. Aleksic, ”Influence of Uplink Limitation and Broadcast Traffic on Power Efficiency in Long-Reach Optical Networks”, in Asia Communications & Photonics Conference & Exhibition (ACP 2010), Shanghai, China, paper SuP4, December 2010. 50. S. Aleksic, ”Thermodynamic Aspects of Communication and Information Processing Systems” (invited), 13th International Conference on Transparent Optical Networks (ICTON 2011), Stockholm, Sweden, June 2011, paper Tu.B1.2.