Doug J. Arent (National Renewable Energy Laboratory, USA). Ian Bryden ...... Chapter 7. Energy Resources and Potentials. 429. 7.9.2. Theoretical Potential .
7
Energy Resources and Potentials Convening Lead Author (CLA) Hans-Holger Rogner (International Atomic Energy Agency, Austria) Lead Authors (LA) Roberto F. Aguilera (Curtin University, Australia) Cristina L. Archer (California State University and Stanford University, USA) Ruggero Bertani (Enel Green Power S.p.A., Italy) S.C. Bhattacharya (International Energy Initiative, India) Maurice B. Dusseault (University of Waterloo, Canada) Luc Gagnon (HydroQuébec, Canada) Helmut Haberl (Klagenfurt University, Austria) Monique Hoogwijk (Ecofys, the Netherlands) Arthur Johnson (Hydrate Energy International, USA) Mathis L. Rogner (International Institute for Applied Systems Analysis, Austria) Horst Wagner (Montan University Leoben, Austria) Vladimir Yakushev (Gazprom, Russia) Contributing Authors (CA) Doug J. Arent (National Renewable Energy Laboratory, USA) Ian Bryden (University of Edinburgh, UK) Fridolin Krausmann (Klagenfurt University, Austria) Peter Odell (Erasmus University Rotterdam, the Netherlands) Christoph Schillings (German Aerospace Center) Ali Shafiei (University of Waterloo, Canada) Review Editor Ji Zou (Renmin University of China)
425
Energy Resources and Potentials
Chapter 7
Contents
Executive Summary . . . . . . . . . . . . . . . . . . . . . . . . . . . . . . . . . . . . . . . . . . . . . . . . . . . . . . . . . . . . . . . . . . . . . . . . . . . . . . . . . . . . . . . . . . . . . . . . . . . . . . . . . . . . . . . . . . . . . . . . . . . . . . . . . . . . . . . . . . . . . . . . . . . . . . . . . . . . 430 Hydrocarbons and Nuclear . . . . . . . . . . . . . . . . . . . . . . . . . . . . . . . . . . . . . . . . . . . . . . . . . . . . . . . . . . . . . . . . . . . . . . . . . . . . . . . . . . . . . . . . . . . . . . . . . . . . . . . . . . . . . . . . . . . . . . . . . . . . . . . . . . . . . . . . . . . . . . . . . . . . . . . . . . 430 Renewables . . . . . . . . . . . . . . . . . . . . . . . . . . . . . . . . . . . . . . . . . . . . . . . . . . . . . . . . . . . . . . . . . . . . . . . . . . . . . . . . . . . . . . . . . . . . . . . . . . . . . . . . . . . . . . . . . . . . . . . . . . . . . . . . . . . . . . . . . . . . . . . . . . . . . . . . . . . . . . . . . . . . . . . . . . . . . . . . 431
7.1
Introduction . . . . . . . . . . . . . . . . . . . . . . . . . . . . . . . . . . . . . . . . . . . . . . . . . . . . . . . . . . . . . . . . . . . . . . . . . . . . . . . . . . . . . . . . . . . . . . . . . . . . . . . . . . . . . . . . . . . . . . . . . . . . . . . . . . . . . . . . . . . . . . . . . . . . . . . . 433
7.1.1
Definitions and Classifications . . . . . . . . . . . . . . . . . . . . . . . . . . . . . . . . . . . . . . . . . . . . . . . . . . . . . . . . . . . . . . . . . . . . . . . . . . . . . . . . . . . . . . . . . . . . . . . . . . . . . . . . . . . . . . . . . . . . . . . . . . . . . . . . . . 433
7.1.2
The ‘Peak Debate’ . . . . . . . . . . . . . . . . . . . . . . . . . . . . . . . . . . . . . . . . . . . . . . . . . . . . . . . . . . . . . . . . . . . . . . . . . . . . . . . . . . . . . . . . . . . . . . . . . . . . . . . . . . . . . . . . . . . . . . . . . . . . . . . . . . . . . . . . . . . . . . . . . . . . . 435
7.1.3
Units of Measurement . . . . . . . . . . . . . . . . . . . . . . . . . . . . . . . . . . . . . . . . . . . . . . . . . . . . . . . . . . . . . . . . . . . . . . . . . . . . . . . . . . . . . . . . . . . . . . . . . . . . . . . . . . . . . . . . . . . . . . . . . . . . . . . . . . . . . . . . . . . . . . 437
7.2
Oil . . . . . . . . . . . . . . . . . . . . . . . . . . . . . . . . . . . . . . . . . . . . . . . . . . . . . . . . . . . . . . . . . . . . . . . . . . . . . . . . . . . . . . . . . . . . . . . . . . . . . . . . . . . . . . . . . . . . . . . . . . . . . . . . . . . . . . . . . . . . . . . . . . . . . . . . . . . . . . . . . . . . . . . . . . . 438
7.2.1
Overview. . . . . . . . . . . . . . . . . . . . . . . . . . . . . . . . . . . . . . . . . . . . . . . . . . . . . . . . . . . . . . . . . . . . . . . . . . . . . . . . . . . . . . . . . . . . . . . . . . . . . . . . . . . . . . . . . . . . . . . . . . . . . . . . . . . . . . . . . . . . . . . . . . . . . . . . . . . . . . . . . . 438
7.2.2
Estimates of Conventional Oil . . . . . . . . . . . . . . . . . . . . . . . . . . . . . . . . . . . . . . . . . . . . . . . . . . . . . . . . . . . . . . . . . . . . . . . . . . . . . . . . . . . . . . . . . . . . . . . . . . . . . . . . . . . . . . . . . . . . . . . . . . . . . . . . . . . 439
7.2.3
Types of Unconventional Oil . . . . . . . . . . . . . . . . . . . . . . . . . . . . . . . . . . . . . . . . . . . . . . . . . . . . . . . . . . . . . . . . . . . . . . . . . . . . . . . . . . . . . . . . . . . . . . . . . . . . . . . . . . . . . . . . . . . . . . . . . . . . . . . . . . . . . 441
7.2.4
Estimates of Unconventional Oil . . . . . . . . . . . . . . . . . . . . . . . . . . . . . . . . . . . . . . . . . . . . . . . . . . . . . . . . . . . . . . . . . . . . . . . . . . . . . . . . . . . . . . . . . . . . . . . . . . . . . . . . . . . . . . . . . . . . . . . . . . . . . . . 443
7.2.5
Oil Supply Cost Curves. . . . . . . . . . . . . . . . . . . . . . . . . . . . . . . . . . . . . . . . . . . . . . . . . . . . . . . . . . . . . . . . . . . . . . . . . . . . . . . . . . . . . . . . . . . . . . . . . . . . . . . . . . . . . . . . . . . . . . . . . . . . . . . . . . . . . . . . . . . . . . 444
7.2.6
Environmental and Social Implications. . . . . . . . . . . . . . . . . . . . . . . . . . . . . . . . . . . . . . . . . . . . . . . . . . . . . . . . . . . . . . . . . . . . . . . . . . . . . . . . . . . . . . . . . . . . . . . . . . . . . . . . . . . . . . . . . . . . . . 445
7.2.7
Summary . . . . . . . . . . . . . . . . . . . . . . . . . . . . . . . . . . . . . . . . . . . . . . . . . . . . . . . . . . . . . . . . . . . . . . . . . . . . . . . . . . . . . . . . . . . . . . . . . . . . . . . . . . . . . . . . . . . . . . . . . . . . . . . . . . . . . . . . . . . . . . . . . . . . . . . . . . . . . . . . . . 450
7.3
Natural Gas . . . . . . . . . . . . . . . . . . . . . . . . . . . . . . . . . . . . . . . . . . . . . . . . . . . . . . . . . . . . . . . . . . . . . . . . . . . . . . . . . . . . . . . . . . . . . . . . . . . . . . . . . . . . . . . . . . . . . . . . . . . . . . . . . . . . . . . . . . . . . . . . . . . . . . . . . 450
7.3.1
Overview. . . . . . . . . . . . . . . . . . . . . . . . . . . . . . . . . . . . . . . . . . . . . . . . . . . . . . . . . . . . . . . . . . . . . . . . . . . . . . . . . . . . . . . . . . . . . . . . . . . . . . . . . . . . . . . . . . . . . . . . . . . . . . . . . . . . . . . . . . . . . . . . . . . . . . . . . . . . . . . . . . 450
7.3.2
Classifying Conventional Gas and Unconventional Gas . . . . . . . . . . . . . . . . . . . . . . . . . . . . . . . . . . . . . . . . . . . . . . . . . . . . . . . . . . . . . . . . . . . . . . . . . . . . . . . . . . . . . . . . . . . . . . 450
7.3.3
Conventional Natural Gas Reserves and Resources . . . . . . . . . . . . . . . . . . . . . . . . . . . . . . . . . . . . . . . . . . . . . . . . . . . . . . . . . . . . . . . . . . . . . . . . . . . . . . . . . . . . . . . . . . . . . . . . . . . 451
7.3.4
Unconventional Gas. . . . . . . . . . . . . . . . . . . . . . . . . . . . . . . . . . . . . . . . . . . . . . . . . . . . . . . . . . . . . . . . . . . . . . . . . . . . . . . . . . . . . . . . . . . . . . . . . . . . . . . . . . . . . . . . . . . . . . . . . . . . . . . . . . . . . . . . . . . . . . . . . . 453
7.3.5
Resource Estimates for Unconventional Gas Resources (Excluding Gas Hydrate) . . . . . . . . . . . . . . . . . . . . . . . . . . . . . . . . . . . . . . . . . . . . . . . . . . . . . . . . 455
7.3.6
Gas Hydrate . . . . . . . . . . . . . . . . . . . . . . . . . . . . . . . . . . . . . . . . . . . . . . . . . . . . . . . . . . . . . . . . . . . . . . . . . . . . . . . . . . . . . . . . . . . . . . . . . . . . . . . . . . . . . . . . . . . . . . . . . . . . . . . . . . . . . . . . . . . . . . . . . . . . . . . . . . . . . 455
426
Chapter 7
Energy Resources and Potentials
7.3.7
Abiogenic Gas Theory . . . . . . . . . . . . . . . . . . . . . . . . . . . . . . . . . . . . . . . . . . . . . . . . . . . . . . . . . . . . . . . . . . . . . . . . . . . . . . . . . . . . . . . . . . . . . . . . . . . . . . . . . . . . . . . . . . . . . . . . . . . . . . . . . . . . . . . . . . . . . . . 458
7.3.8
Natural Gas Supply Cost Curves . . . . . . . . . . . . . . . . . . . . . . . . . . . . . . . . . . . . . . . . . . . . . . . . . . . . . . . . . . . . . . . . . . . . . . . . . . . . . . . . . . . . . . . . . . . . . . . . . . . . . . . . . . . . . . . . . . . . . . . . . . . . . . . . 459
7.3.9
Environmental and Social Implications. . . . . . . . . . . . . . . . . . . . . . . . . . . . . . . . . . . . . . . . . . . . . . . . . . . . . . . . . . . . . . . . . . . . . . . . . . . . . . . . . . . . . . . . . . . . . . . . . . . . . . . . . . . . . . . . . . . . . . 460
7.3.10
Summary . . . . . . . . . . . . . . . . . . . . . . . . . . . . . . . . . . . . . . . . . . . . . . . . . . . . . . . . . . . . . . . . . . . . . . . . . . . . . . . . . . . . . . . . . . . . . . . . . . . . . . . . . . . . . . . . . . . . . . . . . . . . . . . . . . . . . . . . . . . . . . . . . . . . . . . . . . . . . . . . . . 460
7.4
Coal. . . . . . . . . . . . . . . . . . . . . . . . . . . . . . . . . . . . . . . . . . . . . . . . . . . . . . . . . . . . . . . . . . . . . . . . . . . . . . . . . . . . . . . . . . . . . . . . . . . . . . . . . . . . . . . . . . . . . . . . . . . . . . . . . . . . . . . . . . . . . . . . . . . . . . . . . . . . . . . . . . . . . . . . 461
7.4.1
Overview. . . . . . . . . . . . . . . . . . . . . . . . . . . . . . . . . . . . . . . . . . . . . . . . . . . . . . . . . . . . . . . . . . . . . . . . . . . . . . . . . . . . . . . . . . . . . . . . . . . . . . . . . . . . . . . . . . . . . . . . . . . . . . . . . . . . . . . . . . . . . . . . . . . . . . . . . . . . . . . . . . 461
7.4.2
Coal Production . . . . . . . . . . . . . . . . . . . . . . . . . . . . . . . . . . . . . . . . . . . . . . . . . . . . . . . . . . . . . . . . . . . . . . . . . . . . . . . . . . . . . . . . . . . . . . . . . . . . . . . . . . . . . . . . . . . . . . . . . . . . . . . . . . . . . . . . . . . . . . . . . . . . . . . . 461
7.4.3
Reserves. . . . . . . . . . . . . . . . . . . . . . . . . . . . . . . . . . . . . . . . . . . . . . . . . . . . . . . . . . . . . . . . . . . . . . . . . . . . . . . . . . . . . . . . . . . . . . . . . . . . . . . . . . . . . . . . . . . . . . . . . . . . . . . . . . . . . . . . . . . . . . . . . . . . . . . . . . . . . . . . . . . 461
7.4.4
Resources . . . . . . . . . . . . . . . . . . . . . . . . . . . . . . . . . . . . . . . . . . . . . . . . . . . . . . . . . . . . . . . . . . . . . . . . . . . . . . . . . . . . . . . . . . . . . . . . . . . . . . . . . . . . . . . . . . . . . . . . . . . . . . . . . . . . . . . . . . . . . . . . . . . . . . . . . . . . . . . . . 463
7.4.5
Coal Mining Technology . . . . . . . . . . . . . . . . . . . . . . . . . . . . . . . . . . . . . . . . . . . . . . . . . . . . . . . . . . . . . . . . . . . . . . . . . . . . . . . . . . . . . . . . . . . . . . . . . . . . . . . . . . . . . . . . . . . . . . . . . . . . . . . . . . . . . . . . . . . . 464
7.4.6
Coal Mining Costs. . . . . . . . . . . . . . . . . . . . . . . . . . . . . . . . . . . . . . . . . . . . . . . . . . . . . . . . . . . . . . . . . . . . . . . . . . . . . . . . . . . . . . . . . . . . . . . . . . . . . . . . . . . . . . . . . . . . . . . . . . . . . . . . . . . . . . . . . . . . . . . . . . . . . 465
7.4.7
Coal Supply Cost Curves . . . . . . . . . . . . . . . . . . . . . . . . . . . . . . . . . . . . . . . . . . . . . . . . . . . . . . . . . . . . . . . . . . . . . . . . . . . . . . . . . . . . . . . . . . . . . . . . . . . . . . . . . . . . . . . . . . . . . . . . . . . . . . . . . . . . . . . . . . . 466
7.4.8
Environmental and Social Implications. . . . . . . . . . . . . . . . . . . . . . . . . . . . . . . . . . . . . . . . . . . . . . . . . . . . . . . . . . . . . . . . . . . . . . . . . . . . . . . . . . . . . . . . . . . . . . . . . . . . . . . . . . . . . . . . . . . . . . 466
7.4.9
Summary . . . . . . . . . . . . . . . . . . . . . . . . . . . . . . . . . . . . . . . . . . . . . . . . . . . . . . . . . . . . . . . . . . . . . . . . . . . . . . . . . . . . . . . . . . . . . . . . . . . . . . . . . . . . . . . . . . . . . . . . . . . . . . . . . . . . . . . . . . . . . . . . . . . . . . . . . . . . . . . . . . 467
7.5
Nuclear Resource Materials . . . . . . . . . . . . . . . . . . . . . . . . . . . . . . . . . . . . . . . . . . . . . . . . . . . . . . . . . . . . . . . . . . . . . . . . . . . . . . . . . . . . . . . . . . . . . . . . . . . . . . . . . . . . . . . . . . . . . . . . . . . 468
7.5.1
Overview. . . . . . . . . . . . . . . . . . . . . . . . . . . . . . . . . . . . . . . . . . . . . . . . . . . . . . . . . . . . . . . . . . . . . . . . . . . . . . . . . . . . . . . . . . . . . . . . . . . . . . . . . . . . . . . . . . . . . . . . . . . . . . . . . . . . . . . . . . . . . . . . . . . . . . . . . . . . . . . . . . 468
7.5.2
Uranium . . . . . . . . . . . . . . . . . . . . . . . . . . . . . . . . . . . . . . . . . . . . . . . . . . . . . . . . . . . . . . . . . . . . . . . . . . . . . . . . . . . . . . . . . . . . . . . . . . . . . . . . . . . . . . . . . . . . . . . . . . . . . . . . . . . . . . . . . . . . . . . . . . . . . . . . . . . . . . . . . . . 468
7.5.3
Thorium . . . . . . . . . . . . . . . . . . . . . . . . . . . . . . . . . . . . . . . . . . . . . . . . . . . . . . . . . . . . . . . . . . . . . . . . . . . . . . . . . . . . . . . . . . . . . . . . . . . . . . . . . . . . . . . . . . . . . . . . . . . . . . . . . . . . . . . . . . . . . . . . . . . . . . . . . . . . . . . . . . . 472
7.5.4
Fusion Materials . . . . . . . . . . . . . . . . . . . . . . . . . . . . . . . . . . . . . . . . . . . . . . . . . . . . . . . . . . . . . . . . . . . . . . . . . . . . . . . . . . . . . . . . . . . . . . . . . . . . . . . . . . . . . . . . . . . . . . . . . . . . . . . . . . . . . . . . . . . . . . . . . . . . . . . 473
7.5.5
Environmental and Social Implications. . . . . . . . . . . . . . . . . . . . . . . . . . . . . . . . . . . . . . . . . . . . . . . . . . . . . . . . . . . . . . . . . . . . . . . . . . . . . . . . . . . . . . . . . . . . . . . . . . . . . . . . . . . . . . . . . . . . . . 474
7.5.6
Summary . . . . . . . . . . . . . . . . . . . . . . . . . . . . . . . . . . . . . . . . . . . . . . . . . . . . . . . . . . . . . . . . . . . . . . . . . . . . . . . . . . . . . . . . . . . . . . . . . . . . . . . . . . . . . . . . . . . . . . . . . . . . . . . . . . . . . . . . . . . . . . . . . . . . . . . . . . . . . . . . . . 475
427
Energy Resources and Potentials
Chapter 7
7.6
Hydropower . . . . . . . . . . . . . . . . . . . . . . . . . . . . . . . . . . . . . . . . . . . . . . . . . . . . . . . . . . . . . . . . . . . . . . . . . . . . . . . . . . . . . . . . . . . . . . . . . . . . . . . . . . . . . . . . . . . . . . . . . . . . . . . . . . . . . . . . . . . . . . . . . . . . . . . . 475
7.6.1
Overview. . . . . . . . . . . . . . . . . . . . . . . . . . . . . . . . . . . . . . . . . . . . . . . . . . . . . . . . . . . . . . . . . . . . . . . . . . . . . . . . . . . . . . . . . . . . . . . . . . . . . . . . . . . . . . . . . . . . . . . . . . . . . . . . . . . . . . . . . . . . . . . . . . . . . . . . . . . . . . . . . . 475
7.6.2
Estimating Hydropower Potentials . . . . . . . . . . . . . . . . . . . . . . . . . . . . . . . . . . . . . . . . . . . . . . . . . . . . . . . . . . . . . . . . . . . . . . . . . . . . . . . . . . . . . . . . . . . . . . . . . . . . . . . . . . . . . . . . . . . . . . . . . . . . 476
7.6.3
Hydropower Potentials . . . . . . . . . . . . . . . . . . . . . . . . . . . . . . . . . . . . . . . . . . . . . . . . . . . . . . . . . . . . . . . . . . . . . . . . . . . . . . . . . . . . . . . . . . . . . . . . . . . . . . . . . . . . . . . . . . . . . . . . . . . . . . . . . . . . . . . . . . . . . 476
7.6.4
Environmental and Social Implications. . . . . . . . . . . . . . . . . . . . . . . . . . . . . . . . . . . . . . . . . . . . . . . . . . . . . . . . . . . . . . . . . . . . . . . . . . . . . . . . . . . . . . . . . . . . . . . . . . . . . . . . . . . . . . . . . . . . . . 477
7.6.5
Summary . . . . . . . . . . . . . . . . . . . . . . . . . . . . . . . . . . . . . . . . . . . . . . . . . . . . . . . . . . . . . . . . . . . . . . . . . . . . . . . . . . . . . . . . . . . . . . . . . . . . . . . . . . . . . . . . . . . . . . . . . . . . . . . . . . . . . . . . . . . . . . . . . . . . . . . . . . . . . . . . . . 478
7.7
Biomass Energy . . . . . . . . . . . . . . . . . . . . . . . . . . . . . . . . . . . . . . . . . . . . . . . . . . . . . . . . . . . . . . . . . . . . . . . . . . . . . . . . . . . . . . . . . . . . . . . . . . . . . . . . . . . . . . . . . . . . . . . . . . . . . . . . . . . . . . . . . . . . . . . . . . 478
7.7.1
Overview. . . . . . . . . . . . . . . . . . . . . . . . . . . . . . . . . . . . . . . . . . . . . . . . . . . . . . . . . . . . . . . . . . . . . . . . . . . . . . . . . . . . . . . . . . . . . . . . . . . . . . . . . . . . . . . . . . . . . . . . . . . . . . . . . . . . . . . . . . . . . . . . . . . . . . . . . . . . . . . . . . 478
7.7.2
The Theoretical Potential for Land-based Biomass Energy Production . . . . . . . . . . . . . . . . . . . . . . . . . . . . . . . . . . . . . . . . . . . . . . . . . . . . . . . . . . . . . . . . . . . . . . . . 478
7.7.3
Technical Biomass Potentials . . . . . . . . . . . . . . . . . . . . . . . . . . . . . . . . . . . . . . . . . . . . . . . . . . . . . . . . . . . . . . . . . . . . . . . . . . . . . . . . . . . . . . . . . . . . . . . . . . . . . . . . . . . . . . . . . . . . . . . . . . . . . . . . . . . . 481
7.7.4
Summary of Global Technical Bioenergy Potential Estimates . . . . . . . . . . . . . . . . . . . . . . . . . . . . . . . . . . . . . . . . . . . . . . . . . . . . . . . . . . . . . . . . . . . . . . . . . . . . . . . . . . . . . 485
7.7.5
Economics of Bioenergy Production and Supply Cost Curves . . . . . . . . . . . . . . . . . . . . . . . . . . . . . . . . . . . . . . . . . . . . . . . . . . . . . . . . . . . . . . . . . . . . . . . . . . . . . . . . . . . . . 485
7.7.6
Social and Environmental Aspects of Bioenergy Use . . . . . . . . . . . . . . . . . . . . . . . . . . . . . . . . . . . . . . . . . . . . . . . . . . . . . . . . . . . . . . . . . . . . . . . . . . . . . . . . . . . . . . . . . . . . . . . . . . 487
7.7.7
Summary . . . . . . . . . . . . . . . . . . . . . . . . . . . . . . . . . . . . . . . . . . . . . . . . . . . . . . . . . . . . . . . . . . . . . . . . . . . . . . . . . . . . . . . . . . . . . . . . . . . . . . . . . . . . . . . . . . . . . . . . . . . . . . . . . . . . . . . . . . . . . . . . . . . . . . . . . . . . . . . . . . 489
7.8
Wind . . . . . . . . . . . . . . . . . . . . . . . . . . . . . . . . . . . . . . . . . . . . . . . . . . . . . . . . . . . . . . . . . . . . . . . . . . . . . . . . . . . . . . . . . . . . . . . . . . . . . . . . . . . . . . . . . . . . . . . . . . . . . . . . . . . . . . . . . . . . . . . . . . . . . . . . . . . . . . . . . . . . . . 489
7.8.1
Overview. . . . . . . . . . . . . . . . . . . . . . . . . . . . . . . . . . . . . . . . . . . . . . . . . . . . . . . . . . . . . . . . . . . . . . . . . . . . . . . . . . . . . . . . . . . . . . . . . . . . . . . . . . . . . . . . . . . . . . . . . . . . . . . . . . . . . . . . . . . . . . . . . . . . . . . . . . . . . . . . . . 489
7.8.2
Theoretical Potential . . . . . . . . . . . . . . . . . . . . . . . . . . . . . . . . . . . . . . . . . . . . . . . . . . . . . . . . . . . . . . . . . . . . . . . . . . . . . . . . . . . . . . . . . . . . . . . . . . . . . . . . . . . . . . . . . . . . . . . . . . . . . . . . . . . . . . . . . . . . . . . . 489
7.8.3
Technical Potential . . . . . . . . . . . . . . . . . . . . . . . . . . . . . . . . . . . . . . . . . . . . . . . . . . . . . . . . . . . . . . . . . . . . . . . . . . . . . . . . . . . . . . . . . . . . . . . . . . . . . . . . . . . . . . . . . . . . . . . . . . . . . . . . . . . . . . . . . . . . . . . . . . . 489
7.8.4
Practical Potential . . . . . . . . . . . . . . . . . . . . . . . . . . . . . . . . . . . . . . . . . . . . . . . . . . . . . . . . . . . . . . . . . . . . . . . . . . . . . . . . . . . . . . . . . . . . . . . . . . . . . . . . . . . . . . . . . . . . . . . . . . . . . . . . . . . . . . . . . . . . . . . . . . . . 490
7.8.5
Environmental and Social Implications. . . . . . . . . . . . . . . . . . . . . . . . . . . . . . . . . . . . . . . . . . . . . . . . . . . . . . . . . . . . . . . . . . . . . . . . . . . . . . . . . . . . . . . . . . . . . . . . . . . . . . . . . . . . . . . . . . . . . . 491
7.8.6
Summary . . . . . . . . . . . . . . . . . . . . . . . . . . . . . . . . . . . . . . . . . . . . . . . . . . . . . . . . . . . . . . . . . . . . . . . . . . . . . . . . . . . . . . . . . . . . . . . . . . . . . . . . . . . . . . . . . . . . . . . . . . . . . . . . . . . . . . . . . . . . . . . . . . . . . . . . . . . . . . . . . . 492
7.9
Solar . . . . . . . . . . . . . . . . . . . . . . . . . . . . . . . . . . . . . . . . . . . . . . . . . . . . . . . . . . . . . . . . . . . . . . . . . . . . . . . . . . . . . . . . . . . . . . . . . . . . . . . . . . . . . . . . . . . . . . . . . . . . . . . . . . . . . . . . . . . . . . . . . . . . . . . . . . . . . . . . . . . . . . 492
7.9.1
Overview. . . . . . . . . . . . . . . . . . . . . . . . . . . . . . . . . . . . . . . . . . . . . . . . . . . . . . . . . . . . . . . . . . . . . . . . . . . . . . . . . . . . . . . . . . . . . . . . . . . . . . . . . . . . . . . . . . . . . . . . . . . . . . . . . . . . . . . . . . . . . . . . . . . . . . . . . . . . . . . . . . 492
428
Chapter 7
Energy Resources and Potentials
7.9.2
Theoretical Potential . . . . . . . . . . . . . . . . . . . . . . . . . . . . . . . . . . . . . . . . . . . . . . . . . . . . . . . . . . . . . . . . . . . . . . . . . . . . . . . . . . . . . . . . . . . . . . . . . . . . . . . . . . . . . . . . . . . . . . . . . . . . . . . . . . . . . . . . . . . . . . . . 493
7.9.3
Technical Potential . . . . . . . . . . . . . . . . . . . . . . . . . . . . . . . . . . . . . . . . . . . . . . . . . . . . . . . . . . . . . . . . . . . . . . . . . . . . . . . . . . . . . . . . . . . . . . . . . . . . . . . . . . . . . . . . . . . . . . . . . . . . . . . . . . . . . . . . . . . . . . . . . . . 494
7.9.4
Environmental and Social Implications. . . . . . . . . . . . . . . . . . . . . . . . . . . . . . . . . . . . . . . . . . . . . . . . . . . . . . . . . . . . . . . . . . . . . . . . . . . . . . . . . . . . . . . . . . . . . . . . . . . . . . . . . . . . . . . . . . . . . . 496
7.9.5
Summary . . . . . . . . . . . . . . . . . . . . . . . . . . . . . . . . . . . . . . . . . . . . . . . . . . . . . . . . . . . . . . . . . . . . . . . . . . . . . . . . . . . . . . . . . . . . . . . . . . . . . . . . . . . . . . . . . . . . . . . . . . . . . . . . . . . . . . . . . . . . . . . . . . . . . . . . . . . . . . . . . . 496
7.10
Geothermal Energy . . . . . . . . . . . . . . . . . . . . . . . . . . . . . . . . . . . . . . . . . . . . . . . . . . . . . . . . . . . . . . . . . . . . . . . . . . . . . . . . . . . . . . . . . . . . . . . . . . . . . . . . . . . . . . . . . . . . . . . . . . . . . . . . . . . . . . . . . . . 496
7.10.1
Overview. . . . . . . . . . . . . . . . . . . . . . . . . . . . . . . . . . . . . . . . . . . . . . . . . . . . . . . . . . . . . . . . . . . . . . . . . . . . . . . . . . . . . . . . . . . . . . . . . . . . . . . . . . . . . . . . . . . . . . . . . . . . . . . . . . . . . . . . . . . . . . . . . . . . . . . . . . . . . . . . . . 496
7.10.2
Present Utilization of Geothermal Resources . . . . . . . . . . . . . . . . . . . . . . . . . . . . . . . . . . . . . . . . . . . . . . . . . . . . . . . . . . . . . . . . . . . . . . . . . . . . . . . . . . . . . . . . . . . . . . . . . . . . . . . . . . . . 497
7.10.3
Theoretical Potential . . . . . . . . . . . . . . . . . . . . . . . . . . . . . . . . . . . . . . . . . . . . . . . . . . . . . . . . . . . . . . . . . . . . . . . . . . . . . . . . . . . . . . . . . . . . . . . . . . . . . . . . . . . . . . . . . . . . . . . . . . . . . . . . . . . . . . . . . . . . . . . . 498
7.10.4
Technical Potential . . . . . . . . . . . . . . . . . . . . . . . . . . . . . . . . . . . . . . . . . . . . . . . . . . . . . . . . . . . . . . . . . . . . . . . . . . . . . . . . . . . . . . . . . . . . . . . . . . . . . . . . . . . . . . . . . . . . . . . . . . . . . . . . . . . . . . . . . . . . . . . . . . . 498
7.10.5
Economic Potential . . . . . . . . . . . . . . . . . . . . . . . . . . . . . . . . . . . . . . . . . . . . . . . . . . . . . . . . . . . . . . . . . . . . . . . . . . . . . . . . . . . . . . . . . . . . . . . . . . . . . . . . . . . . . . . . . . . . . . . . . . . . . . . . . . . . . . . . . . . . . . . . . . . 499
7.10.6
Cost Structure of a Typical Geothermal Electricity Project . . . . . . . . . . . . . . . . . . . . . . . . . . . . . . . . . . . . . . . . . . . . . . . . . . . . . . . . . . . . . . . . . . . . . . . . . . . . . . . . . . . . . . . . . 499
7.10.7
Environmental and Social Implications. . . . . . . . . . . . . . . . . . . . . . . . . . . . . . . . . . . . . . . . . . . . . . . . . . . . . . . . . . . . . . . . . . . . . . . . . . . . . . . . . . . . . . . . . . . . . . . . . . . . . . . . . . . . . . . . . . . . . . 500
7.10.8
Summary . . . . . . . . . . . . . . . . . . . . . . . . . . . . . . . . . . . . . . . . . . . . . . . . . . . . . . . . . . . . . . . . . . . . . . . . . . . . . . . . . . . . . . . . . . . . . . . . . . . . . . . . . . . . . . . . . . . . . . . . . . . . . . . . . . . . . . . . . . . . . . . . . . . . . . . . . . . . . . . . . . 501
7.11
Ocean Energy . . . . . . . . . . . . . . . . . . . . . . . . . . . . . . . . . . . . . . . . . . . . . . . . . . . . . . . . . . . . . . . . . . . . . . . . . . . . . . . . . . . . . . . . . . . . . . . . . . . . . . . . . . . . . . . . . . . . . . . . . . . . . . . . . . . . . . . . . . . . . . . . . . . . . . 501
7.11.1
Overview. . . . . . . . . . . . . . . . . . . . . . . . . . . . . . . . . . . . . . . . . . . . . . . . . . . . . . . . . . . . . . . . . . . . . . . . . . . . . . . . . . . . . . . . . . . . . . . . . . . . . . . . . . . . . . . . . . . . . . . . . . . . . . . . . . . . . . . . . . . . . . . . . . . . . . . . . . . . . . . . . . 501
7.11.2
Ocean Thermal Energy Conversion . . . . . . . . . . . . . . . . . . . . . . . . . . . . . . . . . . . . . . . . . . . . . . . . . . . . . . . . . . . . . . . . . . . . . . . . . . . . . . . . . . . . . . . . . . . . . . . . . . . . . . . . . . . . . . . . . . . . . . . . . . . . 501
7.11.3
Wave Resources. . . . . . . . . . . . . . . . . . . . . . . . . . . . . . . . . . . . . . . . . . . . . . . . . . . . . . . . . . . . . . . . . . . . . . . . . . . . . . . . . . . . . . . . . . . . . . . . . . . . . . . . . . . . . . . . . . . . . . . . . . . . . . . . . . . . . . . . . . . . . . . . . . . . . . . . 502
7.11.4
Tidal Energy . . . . . . . . . . . . . . . . . . . . . . . . . . . . . . . . . . . . . . . . . . . . . . . . . . . . . . . . . . . . . . . . . . . . . . . . . . . . . . . . . . . . . . . . . . . . . . . . . . . . . . . . . . . . . . . . . . . . . . . . . . . . . . . . . . . . . . . . . . . . . . . . . . . . . . . . . . . . . 502
7.11.5
Osmotic Energy . . . . . . . . . . . . . . . . . . . . . . . . . . . . . . . . . . . . . . . . . . . . . . . . . . . . . . . . . . . . . . . . . . . . . . . . . . . . . . . . . . . . . . . . . . . . . . . . . . . . . . . . . . . . . . . . . . . . . . . . . . . . . . . . . . . . . . . . . . . . . . . . . . . . . . . . 502
7.11.6
Environmental and Social Implications. . . . . . . . . . . . . . . . . . . . . . . . . . . . . . . . . . . . . . . . . . . . . . . . . . . . . . . . . . . . . . . . . . . . . . . . . . . . . . . . . . . . . . . . . . . . . . . . . . . . . . . . . . . . . . . . . . . . . . 503
7.11.7
Summary . . . . . . . . . . . . . . . . . . . . . . . . . . . . . . . . . . . . . . . . . . . . . . . . . . . . . . . . . . . . . . . . . . . . . . . . . . . . . . . . . . . . . . . . . . . . . . . . . . . . . . . . . . . . . . . . . . . . . . . . . . . . . . . . . . . . . . . . . . . . . . . . . . . . . . . . . . . . . . . . . . 503
References . . . . . . . . . . . . . . . . . . . . . . . . . . . . . . . . . . . . . . . . . . . . . . . . . . . . . . . . . . . . . . . . . . . . . . . . . . . . . . . . . . . . . . . . . . . . . . . . . . . . . . . . . . . . . . . . . . . . . . . . . . . . . . . . . . . . . . . . . . . . . . . . . . . . . . . . . . . . . . . . . . . . . . . . . . . . . 504
429
Energy Resources and Potentials
Chapter 7
Executive Summary An energy resource is the first step in the chain that supplies energy services (for a definition of energy services, see Chapter 1). Energy services are largely ignorant of the particular resource that supplies them; however, often the infrastructures, technologies, and fuels along the delivery chain are highly dependent on a particular type of resource. The availability and costs of bringing energy resources to the market place are key determinants to affordable and accessible energy services. Energy resources pose no inherent limitation to meeting the rapidly growing global energy demand as long as adequate upstream investment is forthcoming – for exhaustible resources in exploration, production technology, and capacity (mining and field development) and, by analogy, for renewables in conversion technologies. Hydrocarbons and Nuclear Occurrences of hydrocarbons and fissile materials in the Earth’s crust are plentiful – yet they are finite. The extent of the ultimately recoverable oil, natural gas, coal, or uranium is the subject of numerous reviews, yet still the range of values in the literature is large (Table 7.1). For example, the range for conventional oil is between 4900 exajoules (EJ) for reserves to 13,700 EJ (reserves plus resources) – a range that sustains continued debate and controversy. The large range is the result of varying boundaries of what is included in the analysis of a finite stock of an exhaustible resource, e.g., conventional oil only or conventional oil plus unconventional occurrences, such as oil shale, tar sands, and extra-heavy oils. Likewise, uranium resources are a function of the level of uranium ore concentrations in the source rocks that are considered technically and economically extractable over the long run. • Oil production from areas that are difficult to access or from unconventional resources is not only more energy intensive, but also technologically and environmentally more challenging. The production of oil from tar sands, shale oil, natural gas from shale gas or the deep-sea production of conventional oil and gas raises further environmental risks, ranging from oil spillages, groundwater contamination, greenhouse gas (GHG) emissions, and water contamination to the release of toxic materials and radioactivity. A significant fraction of the energy gained needs to be reinvested in the extraction of the next unit, thus further exacerbating already higher exploration and production costs. • Historically, technology change and knowledge accumulation have largely counterbalanced otherwise dwindling resource availabilities or steadily rising production costs (in real terms). They extended the exploration and production frontiers, which to date have allowed the production of all finite energy resources to grow. The question now is whether technology advances will be able to sustain growing levels of finite resource production and what will be the necessary stimulating market conditions? • Resources need first to be identified and delineated before the technical and economic feasibility of their extraction can be determined. However, having identified resources in the ground does not guarantee its prerequisite technical producibility or its economic viability in the market place. The viability is determined by: • the demand for a resource (by the energy service-to-resource chain); • the price it can obtain; and • the technology capability, economic performance and environmental limitations. The last is becoming increasingly difficult to accomplish (see Sections 7.2.6 and 7.3.9). • Thus, timely above-ground investment in exploration and production capacities is essential to unlocking belowground resources. Private sector investment is governed by the expected future market and price developments, while public sector investment competes with other development objectives. The time lag between investment in new production capacities and the actual start of deliveries can be up to 10 years and more, especially for the development of unconventional resources. Until new large-scale capacities come online, uncertainty and price volatility will prevail.
430
Chapter 7
Energy Resources and Potentials
Table 7.1 | Fossil and uranium reserves, resources, and occurrences.a Historical production through 2005
Production 2005
[EJ]
[EJ]
6069
147.9
4900–7610
4170–6150
Unconventional oil
513
20.2
3750–5600
11,280–14,800
Conventional gas
3087
89.8
5000–7100
7200–8900
Conventional oil
Unconventional gas
Reserves [EJ]
Resources
Additional occurrences
[EJ]
[EJ]
113
9.6
20,100–67,100
40,200–121,900
Coal
6712
123.8
17,300–21,000
291,000–435,000
Conventional uraniumb
1218
24.7
2400
7400
34
n.a.
Unconventional uranium
7100
> 40,000
> 1,000,000
> 2,600,000
a The data reflect the ranges found in the literature; the distinction between reserves and resources is based on current (exploration and production) technology and market conditions. Resource data are not cumulative and do not include reserves. b Reserves, resources, and occurrences of uranium are based on a once-through fuel cycle operation. Closed fuel cycles and breeding technology would increase the uranium resource dimension 50–60 fold. Thorium-based fuel cycles would enlarge the fissile-resource base further.
• There appears to be general consensus that the occurrence of fossil and fissile energy resources is large enough to fuel global energy needs for many centuries. There is much less consensus as to their actual future availability in the market place. While the ‘barrels’ of exhaustible resources may well be humongous, the sizes of their taps that enable the flow from the barrels to the market are subject to a variety of components, including: • • • • • •
smaller and smaller deposits in harsher and harsher environments; rising exploration, production, and marketing costs; excessive environmental impacts; diminishing energy ratios; rate of technology change; and environmental policy.
These factors inherently reduce accessible stocks (size of the barrel) and flow rates, while demand, high prices (plus associated investments), innovation, and technology change tend to increase stock sizes and flow rates. The question arises, which of these opposing forces is going to prevail in the mid-to-long term? It suffices to say that because of these constraints only a fraction of these resources is likely to be produced. Renewables Renewable energy resources represent the annual energy flows available through sustainable harvesting on an indefinite basis. While their annual flows far exceed global energy needs, the challenge lies in developing adequate technologies to manage the often low or varying energy densities and supply intermittencies, and to convert them into usable fuels. Annual renewable energy flows1 are abundant and exceed even the highest future demand speculations by orders of magnitude (Table 7.2). The influx of solar radiation2 that reaches the Earth’s surface amounts to 3.9 million EJ/yr. Accounting for cloud coverage and empirical irradiance data, the availability of solar energy reduces to 630,000 EJ/yr. The energy carried by wind flows is estimated at about 110,000 EJ/yr and the energy in the water cycle amounts to 1
The numbers presented here are different than in other reports; please see Table 11.3 for an explanation.
2
A good graphical summary of renewable energy flows can be found in Sorensen (1979).
431
Energy Resources and Potentials
Chapter 7
Table 7.2 | Renewable energy flows, potential, and utilization in EJ of energy inputs provided by nature.a
Biomass, MSW, etc. Geothermal
Utilization 2005
Technical potential
Annual flows
[EJ]
[EJ/a]
[EJ/a]
46.3
160–270
2200
2.3
810–1545
1500
Hydro
11.7
50–60
Solar
0.5
62,000–280,000
Wind
1.3
1250–2250
Ocean
–
3240–10,500
200 3,900,000 110,000 1,000,000
a The data are energy-input data, not output. Considering technology-specific conversion factors greatly reduces the output potentials. For example, the technical 3150 EJ/yr of ocean energy in ocean thermal energy conversion (OTEC) would result in an electricity output of about 100 EJ/yr.
more than 500,000 EJ/yr, of which 200 EJ/yr theoretically could be harnessed for hydro electricity. Net primary biomass production is approximately 2200 EJ/yr, which, after deducting the needs for food and feed, leaves in theory some 1100 EJ/yr for energy purposes. The global geothermal energy stored in the Earth’s crust up to a depth of 5000 m is estimated at 140,000 EJ/yr. The annual rate of heat flow to the Earth’s surface is about 1500 EJ/yr. Oceans are the largest solar energy collectors on Earth absorbing on average some 1 million EJ/yr. These gigantic annual energy flows are of theoretical value and the amounts that can be utilized technically and economically are significantly lower. Renewables, except for biomass, convert resource flows directly into electricity or heat. Their technical potentials are thus a direct function of the performance characteristics of their respective conversion technologies as well as of factors such as geographic location and orientation, terrain, supply density, distance to markets or availability of land and water, while the economic potentials of renewables depend on their competitiveness within a specific local market setting.
432
Chapter 7
Introduction
This chapter reviews the world’s endowment of exhaustible and renewable energy occurrences. It foremost attempts to clarify what nature has to offer, what it may cost to make its resource stocks and flows accessible to the market place, and what the social and environmental implications of their extraction are. It does not per se speculate whether, how, or how much of these resources will be utilized – this is the subject of Chapter 17 (Scenarios) and Chapters 8–16, which cover energyconversion technologies throughout the energy system to the supply of energy services (for a definition of energy services, see Chapter 1). This is not to say that demand is irrelevant. On the contrary, without a demand dimension any resource assessment is a futile undertaking. Indeed, nature’s offerings become relevant resources only in the presence of demand and the existence of an appropriate technology for mining and harvesting at affordable costs. Therefore, in the presence of demand, technology and technology change (innovation) are fundamental in bringing energy resources to the market place. This chapter restricts its assessment to technologies necessary for mining and mobilizing hydrocarbon or fissile materials, for improving land productivity, or for damming up water. Here, advances in geosciences, exploration techniques, mining methods, or biotechnology are examples that will shape our knowledge about resource dimensions, producibility, costs, and potential adverse consequences. This approach works for finite resources, but not for most renewables – the degree of their future use is rather a question of the anticipated technological and economic performance of technologies that feed on these natural flows and not the magnitude of the flows themselves, as these are undeniably enormous. The natural question arises of how to reconcile the apparent contradiction between the approach adopted here and the above statement that resources are determined by demand, technology, and costs (relative to alternatives). To begin, the assessment takes stock of the material volumes contained in the Earth’s crust, the magnitudes of renewable flows, and the land available for energy-crop production. Next, the quantified stocks and flows are divided into separate resource categories or classes to reflect the different degrees of quality or technological challenge of extraction and/or harvesting, whenever possible by way of cost tags. For example, aggregate supply cost curves are developed for oil and coal, while wind energy resources are presented in categories of specific wind speed, general geographical condition, etc. Finally, supply cost curves and resource categories serve as an input to the scenario and technology chapters. These chapters determine the overall call on resource utilization (the demand) depending on the relative merit order of the various conversion technologies (technology and costs) and associated energy inputs (resource categories). Finally, feedback from the technology and scenario chapters helps to refine the resource categories and supply cost curves of this chapter.
7.1.1
Definitions and Classifications
There is no consensus on the exact meanings of the terms reserves, resources, and occurrences. Many countries and institutions have developed their own expressions and definitions, and different authors and institutions have different meanings for the same terms. This lack of consistent definitions is one cause of confusion. Another cause is rooted in the fact that most reserves quantities, estimated as deposits, are often located several kilometers below the surface. The estimates are based on inherently limited information and the geological data derived from exploration activities are subject to interpretation and judgment. “Reserves estimation is a bit like a blindfolded person trying to judge what the whole elephant looks like from touching it in just a few places. It is not like counting cars in a parking lot, where all the cars are in full view” (Hirsch, 2005). Principally, this chapter adopts the concept of the McKelvey box (Figure 7.1), which presents resource categories in a matrix that shows increasing degrees of geological assurance and economic feasibility. This scheme, developed by the US Bureau of Mines and the US Geological Survey (USGS), is reflected in the international classification system used by the United Nations (USGS, 1980; UNESC, 1997; ECE, 2010). In this classification system, ‘resources’ are defined as “concentrations of naturally occurring solid, liquid, or gaseous material in or on the Earth’s crust in such form that economic extraction is potentially feasible.” The geological dimension is divided into ‘identified’ and ‘undiscovered’ resources. ‘Identified’ resources are deposits that have a known location, grade, quality, and quantity – or that can be estimated from geological evidence. Identified resources are further subdivided into ‘demonstrated’ and ‘inferred’ resources, to reflect varying degrees of geological assurance, or lack thereof. ‘Undiscovered’ resources are quantities expected or postulated to exist based on materials found in analogous geological
Identified Reserves Demonstrated Measured
Economic Increasing degree of economic feasibility
7.1
Energy Resources and Potentials
Subeconomic
Not economic
Indicated
Undiscovered Resources Probability range (or)
Inferred
Hypothetical Speculative
Reserves Resources
Unconventional and low-grade occurrences
Increasing degree of geological assurance
Figure 7.1 | Principles of resource classification. Source: McKelvey, 1967.
433
Energy Resources and Potentials
Chapter 7
recovered in the future from known reservoirs under existing economic and operating conditions (BP, 2010).3
conditions. ‘Other occurrences’ are materials that are too low grade or for other reasons not considered technically or economically extractable. For the most part, unconventional resources are included in this category. The boundary between ‘reserves’ and ‘resources’ is the current or expected profitability of exploitation, governed by the ratio of future market prices to the long-run cost of production. Price increases and production cost reductions expand reserves by moving resources into the reserve category and vice versa. Production costs of reserves are usually supported by actual production experience and feasibility analyses, while cost estimates for resources are often inferred from current production experience, adjusted for specific geological and geographical conditions. Reserve outlooks reported by the media are usually framed within a shortterm market perspective, which focuses on prices, who is producing from which fields, where might spare capacity exist to meet short-term demand peaks, the politics of oil, and how this all balances with demand. In contrast, long-term supply, given sufficient demand, is a question of the replenishment of known reserves with new ones presently either unknown, not delineated, or from known deposits currently not producible or accessible for technoeconomic reasons (Rogner, 1997; Rogner et al., 2000). Here the development and application of advanced exploration and production technologies are essential prerequisites for the long-term resource availability. Technologies are continuously shifting resources into the reserve category by advancing knowledge and lowering extraction costs. The outer boundary of resources and the interface to other occurrences is less clearly defined and often subject to a much wider margin of interpretation and judgment. Other occurrences are not considered to have economic potential at the time of classification. Production inevitably depletes reserves and eventually exhausts deposits, yet over the very long term, technological progress may upgrade significant portions of occurrences to resources and later to reserves. In essence, sufficient long-term supply is a function of investment in research and development (R&D) of exploration and new production methods and in extraction capacity, with demand prospects and competitive markets as the principal drivers. More precisely, this assessment uses the following definitions in decreasing order of certainty and economic producibility: • ‘Occurrences’ are hydrocarbon or fissile materials contained in the Earth’s crust in some sort of recognizable form (WEC, 1998). • ‘Resources’ are detected quantities that cannot be profitably recovered with current technology, but might be recoverable in the future, as well as those quantities that are geologically possible, but yet to be found. Undiscovered resources are what remain and, by definition, one can only speculate on their existence. • ‘Reserves’ are generally those quantities that geological and engineering information indicate with reasonable certainty that can be
434
Another major factor in estimating future availabilities of oil, gas, coal, and uranium is the difference between ‘conventional’ and ‘unconventional’ occurrences (e.g., oil shale, tar sands, coal-bed methane [CBM], methane clathrates, and uranium in black shale or dissolved in sea water). Again, terms that lack a standard definition are often used, which adds greatly to misunderstandings, especially in the debates on peak oil, gas, or coal. As the name suggests, unconventional resources generally cannot be extracted with technology and processes used for conventional oil, gas, or uranium. They require different logistics and cost profiles, and pose different environmental challenges. Their future accessibility is, therefore, a question of technology development, i.e., the rate at which unconventional resources can be converted into conventional reserves (notwithstanding demand and relative costs). In short, the boundary between conventional and unconventional resources is in permanent flux. This chapter is based on a comprehensive literature review which revealed a wide range of resource quantifications with particularly high variability for unconventional oil and gas over short time intervals at the national or regional levels. Here the responsible author(s) used their expert judgment on which data to report in this assessment. For renewable energy sources, the concepts of reserves, resources, and occurrences need to be modified as renewables represent, at least in principle, annual energy flows that, if their flows are harvested without disturbing nature’s equilibria, are available indefinitely. In this context, the total natural flows of solar, wind, hydro, and geothermal energy, and of grown biomass are referred to as theoretical potentials and are analogous to ‘occurrences.’ ‘Resources’ of renewable energy are captured by using the concept of ‘technical potential’ – the degree of use that is possible within thermodynamic, geographical, or technological limitations without a full consideration of economic feasibility. ‘Reserves’ of renewable energy would then correspond to the portion of the technical potential that could be utilized cost-effectively with current technology. Future innovations and technology will change and expand the technoeconomic frontier further, so ‘reserves’ will move dynamically in response to market conditions, demand, and advances in conversion technologies. For example, the economic potential of solar is largely a matter of the cost of photovoltaic or concentrated solar
3
The industry associates proved reserves (so-called 1P reserves) with quantities recoverable with at least 90% probability (P90) under existing economic and political conditions and using existing technology. Reserves based on median estimates and at least a 50% probability (P50) of being produced are referred to by industry as probable or 2P (proved plus probable) reserves. 3P (proved plus probable plus possible) reserves characterize occurrences with at least a 10% probability of being produced. 2P and 3P reserves reflect the inherent uncertainties of the estimation process caused by varying interpretations of geology, future market conditions, and future recovery methods (SPE, 2005).
Chapter 7
Energy Resources and Potentials
The reserve, resource, and potential estimates of this chapter serve as inputs to the later chapters that present different energy future pathways and technology reviews. At the same time, feedback from the technology and scenario chapters has helped refine the resource categories and supply cost curves in this chapter. In this context, it is important that there is one fundamental difference between this resource chapter and the technology and scenario chapters. The latter report potentials or utilization in terms of output (e.g., kilowatt-hours [kWh] or megajoules [MJ]), while this chapter presents resources and potential in terms of inputs (e.g., the kinetic energy of the wind hitting the turbine blades of a wind power plant).
7.1.2
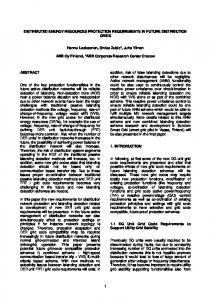
An increasing number of analysts expect the production of oil to peak in the near future, i.e., over the next 10 to 20 years. Some even argue that ‘peak oil is now’ (EWG, 2007). They base their projections on the fact that large oil discoveries (‘super giants’) ended in the mid-1960s, followed by a substantial decline in the discoveries of new reserves (Figure 7.2). Between 1980 and 2009, slightly more than 65% of global oil production was reported to be offset by new additions of oil reserves (Figure 7.3) (BP, 2010). However, it has been argued that the increased levels of reported oil since 1980 are merely the result of belated corrections to previous oil-field estimates. Backdating the revisions to the years in which the fields were discovered reveals that
9
8
8
7
7
6
6
5
5
Discovery
4
4
Production
3
3
2
2
1
1
0 1930 1940 1950 1960 1970 1980 1990 2000
0
Figure 7.2 | Oil discoveries and oil production. Source: adapted from Earth Policy Institute, 2007.
The ‘Peak Debate’
How much oil, gas, coal, or uranium does the Earth’s crust hold? This question has preoccupied resource analysts since the dawn of the 20th century and the answers provided reflect a deep divide between representatives of different disciplines, i.e., between geologists and economists. Over time, the divide appears to have widened rather than narrowed, resulting in what is now termed the ‘peak debate.’ Traditionally, its focus has been on the availability of conventional oil (e.g., Aleklett et al., 2010), but more recently the notions of peak coal (Heinberg and Fridley, 2010), peak gas (Laherrère, 2004), and peak uranium (EWG, 2006) also entered the debate. The arguments brought forward in support or rejection of an imminent peak are largely the same for each resource. Therefore, the following paragraphs summarizing the peak-oil debate are representative for all resources.
9
16
16
14
14
12
12
10
10
8
8
6
6
4
4
2
2
Gt
Conversion technologies are outside the scope of this chapter, but are extensively dealt with in Chapters 8–16. Chapter 17 (Energy Pathways for Sustainable Development) integrates demand, resources, and all technologies throughout the energy system and balances supply and demand. However, some basic assumptions regarding the current and future performance of conversion technologies to harvest renewable energy flows as well as system aspects, distances to demand centers, etc., are necessary to quantify ‘resources.’ Therefore, the term ‘practical potential’ is used in this assessment as proxy for renewable resources.
Gt
conversion systems, electricity system integration, and local market conditions, and not of the overall amount of solar radiation.
0
Discovery Additions Production
0 1981
1991
2001
Figure 7.3 | Oil production, oil reserve discoveries, and oil reserve additions. Source: adapted from Earth Policy Institute, 2007; BP, 2010.
reserves have been falling because of a steady decline in truly newfound oil deposits. On this account, for each barrel of oil newly listed as discovered some 4–6 barrels are removed from the ground (Campbell and Laherrère, 1998; Hirsch, 2005). For example, the reserve additions in 2008, reported by BP, are “primarily due to an upward revision in Venezuela of 73 billion barrels (10 Gt)” (Rühl, 2010). Continuously removing more oil than is offset by new reserve additions will eventually result in reaching a level of “peak oil” at approximately the time when half of the oil reserves have been used. After peak oil, the global availability of oil will decline year after year at a rate depending on the rate of production. The assumed ultimate global oil reserve endowment is therefore a critical parameter in determining both the level of peak production and the point in time when it will occur. ‘Estimated ultimate recoverable oil’4 (EUR) refers to estimates of the total amount of the world’s conventional oil – that which has already 4
EUR includes past production.
435
Energy Resources and Potentials
Chapter 7
Figure 7.4 | Undulating plateau versus peak oil. Source: Witze, 2007.
been taken out of the ground and that which remains. Since the 1950s, approximately 100 different estimates have been made. The majority lie in the range 12.6–16.7 ZJ (300–400 Gt5). By the end of 2008, cumulative oil production amounted to some 6.5 ZJ (156 Gt). For the lower estimates, this means the half-way production mark (the peak) has almost been reached. Using the higher estimates would shift the peak only by a decade or so. The term ‘recoverable’ in ‘estimated ultimate recoverable oil’ means that it is not a measurement of the total amount of oil in place, but refers only to the portion that is recoverable, taking into account geological complexities and economic limitations. Estimates, therefore, include certain (usually tacit) assumptions about costs, markets, and technology. It is this interplay between technology (innovation and knowledge) and prices, but also with demand, that prompts some analysts, especially with an economics background, to be more sanguine about EUR estimates. Not that the economists ignore the ultimate finiteness of exhaustible resources or that peak oil production will eventually take place – this is not the issue. In their view, human ingenuity has kept ahead of reserve depletion and there is no obvious reason why this should change (Bentley and Smith, 2004) as technological innovation will continue to unlock additional reserves currently not identified or understood, or not economically extractable with existing technology and market conditions.
5
1 t = 42 MJ = 7.33 barrels of oil (bbl).
436
In terms of economic factors, higher prices not only push the frontier of marketable resources (exploitation of smaller fields, higher recovery rates, ability to operate in more challenging environments, etc.), but also stimulate upstream technology R&D for expanding exploration and production activities. At the same time higher prices generally suppress demand, lowering pressure on supply. Claims that recent skyrocketing oil prices reflect that the peak has arrived ignore these market fundamentals. As was observed in the second half of 2008, a slight reduction in global oil demand started a precipitous drop in prices along the entire oil chain. ‘Unconventional’ oil resources are not included in EUR estimates until they become economically and technically producible. The inclusion of unconventional oil resources in the standard future production profiles of the ‘peak oil’ analysts would radically change the shape of the global oil production profile (Odell, 2004; McKenzieBrown, 2008). In fact, the notion of ‘peak oil’ is misleading. When total (conventional and unconventional) oil production approaches a maximum level, production is likely to be characterized by an ‘undulating plateau’ (see Figure 7.4) rather than by a peak followed by a sharp drop-off in output (IHS-CERA, 2006; Witze, 2007). However, the ‘peak oil’ proponents would counter that even if the resource base of non-conventional oil is tapped, production would be constrained by high specific investment and production costs as well as environmental regulations. As rising costs continue to push prices, consumers
Chapter 7
Energy Resources and Potentials
would eventually turn to cheaper non-oil alternatives leaving plenty of untapped oil in the ground. Both sides do agree that conventional oil production is going to peak in the foreseeable future, e.g., sometime between now and 2040, with a peak production volume between 4.1–4.5 Gt/yr (82–95 Mbbl/day). Differences in EUR estimates and the role of technology and price explain the variations in time and volume. Both sides see a role for unconventional oil in future oil supply. There is agreement that the overall ‘barrel’ of conventional and unconventional oil resources is large indeed, but there is disagreement about the size of the tap, i.e., the rate at which the barrel’s (finite) contents be developed, and on the related economic and environmental costs. Potential financial, environmental, and sociopolitical constraints that could limit exploitation of unconventional oil include: • the high capital intensity of bringing unconventional oil to the market; • the extraction of unconventional oil is more energy intensive than conventional oil (up to 30% of net output, with corresponding increases in GHG emissions); and • enormous local environmental burdens (severe soil and water contamination by chlorinated hydrocarbons and heavy metals) from processing unconventional oil into marketable oil.
Large-scale exploitation of unconventional oil necessitates conditions of low financial, environmental, and geopolitical risk averseness, which the ‘peak oil’ school simply does not see forthcoming. Indeed, most of the unconventional oil in place may never reach the market place. However, this is less a resource-existence issue, but more a result of sociopolitical choice. Then again, leaving aside such constraints, unconventional oil may well postpone the overall decline of oil into the second half of the 21st century.
7.1.3
Units of Measurement
This chapter uses the International System of Units (SI) and reports on energy resources in exajoules (1 EJ = 1018 joules). Other units are used intermittently for reasons of comparison with the units commonly used by the different trades. Tonnes are metric tonnes (1 t = 106 g). The energy resource-related industry and energy-related statistics or resource surveys report oil occurrences in gigatonnes (1 Gt = 109 tonnes) or gigabarrels using the energy equivalent of 42 GJ/tonne of oil equivalent (GJ/toe) and 5.7 GJ/bbl, respectively (see Table 7.3). Gas resources are usually reported in teracubic meters (1 Tm3 = 1012 cubic meters) and are converted to EJ using 37 GJ/1000 m3.
Table 7.3 | Energy conversion factors and prefixes of the metric system used in Chapter 7.
Tonnes of oil (toe)
Barrel (bbl or boe)
Cubic feet of gas (CFG)
Cubic meter of gas (m3)
Tonnes of coal equivalent (tce)
Megajoule [MJ]
Brtish Thermal Unit (BTU)
Tonnes of oil (toe)
1
7.33
40,000
1124
1.429
41,868
40 × 106
Barrel (bbl or boe)
0.136
5414
153.3
0.195
5712
5.414 × 10⁶
Cubic feet of gas (CFGc)
0.25 × 10
Cubic meter of gas (m3)
1 –6
–3
–6
0.185 × 10
1
0.028
35.997 × 10
1.055
1000
0.890 × 10⁻³
6.523 × 10⁻³
35.31
1
1.271 × 10⁻⁶
37
31.35 × 10³
Tonnes of coal equivalent (tce)
0.7
5.131
27.78 * 103
786.634
1
29,000
27.78 × 10⁶
Megajoule (MJ)
24 × 10–6
0.175 × 10⁻³
0.948
0.0268
34.121 × 10⁻⁶
1
947.867
British Thermal Unit (BTU)
25 × 10–9
0.185 ×10⁻⁶
0.001
28.32×10⁻⁶
35.997 × 10⁻⁹
1.055 × 10⁻³
1
Milli (m)
10–3
Centi (c)
10–2
Kilo (k)
103
Mega (M)
106
Giga (G)
109
Tera (T)
1012
Peta (P)
1015
Exa (E)
1018
Zeta (Z)
1021
437
Energy Resources and Potentials
Chapter 7
Coal resources are usually accounted for in natural units, although the energy content of coal may vary considerably within and between different coal categories. The Bundesanstalt für Geowissenschaften und Rohstoffe (BGR; German Federal Institute for Geosciences and Natural Resources) in Hannover (Germany) is the only institution that converts regional coal occurrences into tonnes of coal equivalent (1 tce = 29.3 GJ). Thus coal resource data comes from the BGR.
resource estimates since 1940. However, it is important that new additions of resources or reserves, especially in recent years, may not be the result of new discoveries, but of improved extraction technologies or processes, deposit reevaluations, changing economic conditions, or underreporting in the first place.
7.2.1.1 Uranium and other nuclear materials are usually reported in tonnes of metal. The thermal energy equivalent of 1 tonne of uranium in average once-through fuel cycles is about 589 terajoules (IPCC, 1996).
7.2
Oil
7.2.1
Overview
Oil is one of the most important sources of global energy because of its high energy density, high abundance and easy transportability at standard temperatures and pressures. In 2009, oil was responsible for over one-third (34.8%) of the world’s total primary energy supply. Almost 70% of global oil production is used for transportation and petrochemistry (IEA, 2010a). Analysts fear resource depletion of oil will produce significant supply scarcities in the near future. Currently, annual oil production exceeds added new oil reserves. Resource estimation is by no means an exact science and is dynamic by nature (see Section 7.1.1). As a result of advances in exploration and production technologies, the borders that distinguish reserves from resources and resources from occurrences are increasingly blurred. To a large extent, this explains the variability of reserve and resource estimates over time, as well as those of different authors. For example, the USGS estimates of oil resources have nearly doubled since the early 1980s. Figure 7.5 shows the evolution of oil
Classifying Conventional and Unconventional Oil
Oil occurrences can be divided into many different subclasses and categories, depending on the physical properties of the oils. Some oils are classified as heavy or extra heavy, which implies that they have high viscosities and do not flow easily. Other oils are sour, which signifies that they contain a certain amount of sulfur. Other oils are considered unconventional, which implies that they are not recoverable using the standard technologies used to extract conventional low-viscosity oils from subsurface reservoirs. The term crude oil typically refers to conventional oils, but many countries or organizations have their own criteria to define the boundary between conventional and unconventional oils. The BGR defines conventional oil as oil having a specific gravity of less than 1.0 g/cm3. This is equivalent to the American Petroleum Institute (API) definition, which specifies API gravity greater than 10°.6 However, the USGS defines conventional oil as oil having API gravity greater than 15°. ‘Conventional oil’ generally also includes gas condensates and natural gas liquids. Unconventional oil includes oils of high viscosity, as well as the oils extracted from kerogen-rich shale (oil shale). The term ‘viscous oil’ is used generically for all oil with viscosities greater than 100 mPa·s. Kerogen is semisolid organic matter that can be directly converted into oil through pyrolysis. While other definitions exist (e.g., Head et al., 2003; Meyer and Detzman, 1979), the definitions used in this report for the various subclasses of oils are given in Table 7.4.
40,000
Many also consider unconventional oil to include products such as biomass oil, synthetic oil from conversion of natural gas, and coal liquefaction (Farrell, 2008; IEA, 2008a). While these are, indeed, potential sources of liquid hydrocarbon fuels, they are not considered unconventional oil in this assessment. Natural gas, coal and biomass are covered in Sections 7.3, 7.4, and 7.7, respectively.
35,000 30,000
EJ
25,000 20,000 15,000 10,000 5,000 0 1940
1950
1960
1970
1980
1990
2000
2010
Figure 7.5 | World oil resource (reserves and resources) estimates, 1940–2007. Sources: adapted from Ahlbrandt and Klett, 2005; NPC, 2007; IEA, 2008; BGR, 2009.
438
The distinction between conventional and unconventional oil is further distorted when regarding deep offshore or Arctic oil. Despite having API gravity greater than 10°, some assessments consider these as ‘unconventional’ because of the novelty of deep-sea drilling or Arctic production. It is also important that some unconventional oils are cheaper to recover than some high-end conventional oils, e.g., oil sands versus arctic oil. 6
10° = 1.0 g/cm3
Chapter 7
Energy Resources and Potentials
Table 7.4 | Definitions of oil terms. Term Oil type
Rock strata
Definition
Physical properties
Conventional oil
Oil that is mobile in situ and can be produced economically using conventional methods
μ < 100 mPa.sa Low S content
Viscous oil
Inclusive term for the next three categories below
μ > 100 mPa.s
Heavy oil
Oil that is only slightly mobile in situ, usually requiring stimulation techniques to improve mobility
μ 100–10,000 mPa.s S content 1.0) that has some mobility because of high in situ temperatures (particularly used to refer to Orinoco, Venezuela oils)
μ 1.0 S content >1%
Bitumen
Oil that is immobile in situ so that large viscosity reductions or mining methods are needed
μ >10,000 mPa.s ρ >1.0b S content >1%
Oil sands
Sand strata > 25% porosity, containing extra-heavy oil or bitumen, more viscous than heavy oil
k >0.5 Darcy, usually μ > 1000 mPa.s
Heavy-oil NFCRs
Naturally fractured carbonate reservoirs (NFCRs) containing viscous oil
μ >100 mPa.s Porosity 10–20%
Oil shale
Kerogenous shales and marls that produce more than 50 l/t of product during Fischer Assay tests
Porosity >15–20%
a
μ = measure of viscosity in mPa.s = cP = 0.01 g/cm.s.
b
ρ = specific gravity in g/cm3.
The boundary is further blurred with respect to currently mined deposits. Using standard conventional extraction technologies, only around 20–40% of oil in place is recoverable by natural depletion of the reservoir. To extract further quantities, improved oil-recovery technologies, which can extract 30–60% of the oil in place, need to be applied (DOE, 2010). The goal of enhanced oil recovery is to alter the original properties of the oil, to restore formation pressure, or to improve oil-displacement efficiency or fluid-flow patterns in the reservoir. There are three major types: chemical flooding (e.g., alkaline flooding or polymer injection), miscible displacement (e.g., carbon dioxide [CO2] or solvent injection), and thermal processes (e.g., steam flooding or in situ combustion). The application of each technology depends on reservoir temperature, pressure, depth, permeability, net pay, residual oil and water saturation, porosity, and fluid viscosities (Schlumberger, 2010).
7.2.2
Estimates of Conventional Oil
Estimates of the amount of oil are derived from only a limited number of sources. While both production and reserves data are collected by
government agencies at several levels, reserves data are less commonly published than production statistics. Several private companies (e.g., IHS Energy Inc., Wood Mackenzie, BP p.l.c., and others), industry journals (e.g., Oil and Gas Journal), and government agencies (e.g., International Energy Agency [IEA], US Energy Information Administration [US EIA]) compile and publish these data. Reserve estimates are burdened with uncertainty as some countries hold such data as confidential. Estimates published in databases and in the literature are often made by the authors themselves. Growth potentials for undiscovered resources and reserves understandably suffer from greater uncertainties than those of proven reserves. Most reports provide estimates for yet-to-be-discovered resources, but only a few give estimates for reserves-growth potential. Some reports give aggregate estimates for the world as a whole, others for individual countries or regions, but few sources cover the entire world in detail, which adds a further difficulty to a general synthesis of reserves estimations. The USGS and BGR provide the most comprehensive set of estimates. Table 7.5 compares recent estimates of conventional oil reserves. The estimates vary between 116.3 Gt (EWG, 2008) and 181.7 Gt (BP, 2010). Importantly, some estimates include reserves of oil sands, which are, by definition, unconventional oils. The low estimate of the Energy Watch Group stems from their suspicion that the reserve data reported by the governments of the Middle East are politically motivated and hence unrealistically high. The USGS estimate, which dates back to the year 2000, appears low as well. However, the USGS reports much higher oil resources than the recent BGR (2009) assessment (see Table 7.6), which suggests that some resources of 2000 became reserves in 2009. As previously mentioned, terms like ‘resources’ and ‘reserves’ are used with varying definitions by different authors. Further confusion arises when resource statistics are interpreted to be more comprehensive than in actuality. While reserves reporting in the United States require a 90% (1P) probability of recovery under existing economic, technological, and political conditions, other reporting bodies typically declare reserves at a median, 50% (2P), probability. Despite this, reserve estimates given at 1P have tended to increase over time. While some growth may be legitimate because of better extraction or surveying technology, this cannot explain all the reserves growth experienced. Some reports claim that reserves have been deliberately underreported so that estimates could be revised upwards over time to give a comforting yet misleading image of steady growth (WEC, 2007). Considering oil reserves in a narrow sense, largely conventional oil, cumulative production to date is roughly equal to the remaining proven reserves – for the proponents of ‘peak oil’ a clear indication of the imminent peak. Table 7.6 summarizes the conventional oil reserves and resource quantities for the 18 GEA regions. An additional region is added to account
439
Energy Resources and Potentials
Chapter 7
Table 7.5 | Comparison of estimates of conventional oil reserves.a OGJ
EWG
EIA
EXXON
BP
BGR
OPEC
USGS
[Mt]
[Mt]
[Mt]
[Mt]
[Mt]
[Mt]
[Mt]
[Mt]
Region Europe CIS Africa Middle East Asia
1942
3469
1977
1913
1849
2264
2164
4632
13,452
20,952
16,784
13,453
16,808
17,543
17,450
22,773
15,622
17,007
15,192
15,366
17,404
17,276
16,268
9,973
101,808
49,252
98,301
101,610
102,803
102,366
100,893
70,866 7167
4673
7007
4893
4628
5749
5600
5208
North America
28,737
11,429
7921
28,442
8392
6121
5111
5221
Latin America
14,946
7143
9600
15,225
28,706
9854
16,369
10,174
181,180
116,259
154,668
180,637
181,712
161,024
163,463
130,806
181,712
161,024
163,463
130,806
World Oil sands
23,665
World w/o oil sands
23,665
157,515
116,259
154,668
156,972
OGJ = Oil and Gas Journal (2007); EWG = Energy Watch Group (2008); EIA = Energy Information Agency (2008); Exxon (2008), BP = British Petrol (2010), OPEC = Organization of Petroleum Exporting Countries (2008), USGS = U.S. Geological Survey (2000). a
Conventional oil reserves include NGLs.
Source: adapted from BGR, 2009; 2010.
Table 7.6 | Conventional oil reserves and resources.a Oil production 2009
Historical production till 2009
Reserves BP
Reserves BGR
Reserves USGS
Resources BGR
Resources USGS
Reserves + Resources BGR
Reserves + Resources USGS
[EJ]
[EJ]
[EJ]
[EJ]
[EJ]
[EJ]
[EJ]
[EJ]
[EJ]
USA
15.00
1246
162
162
183
420
476
582
659
CAN
6.70
200
189
28
36
101
21
129
57
WEU
8.98
329
74
88
179
186
492
275
671
Region
EEU
0.28
47
4
6
15
13
11
19
26
FSU
27.64
1017
704
735
953
1008
952
1743
1906
NAF
10.38
336
389
388
252
184
158
573
410
EAF
0.00
0
0
4
0
13
7
17
7
WCA
6.07
214
263
254
142
302
375
556
517
SAF
3.78
48
77
77
24
150
97
227
121
MEE
50.78
1823
4308
4286
2967
889
1654
5175
4621
CHN
7.90
220
85
84
142
97
95
181
237
OEA
1.02
11
26
26
0
32
1
58
1
IND
1.57
46
33
33
40
17
18
50
58
OSA
0.14
4
4
2
3
13
11
15
13
JPN
0.01
2
0
0
0
0
0
1
0
OCN
1.20
41
25
24
94
44
108
69
202
PAS
4.90
203
68
65
22
88
63
153
86
LAC
20.30
862
1203
479
426
614
853
1093
1279
166.68
6647
7615
6742
5477
4172
6161
10914
11,638
Circum-Arctic Total
768
a
768
Includes natural gas liquids (NGLs). USA = United States of America; CAN - Canada; WEU = Western Europe, incl. Turkey; EEU = Central and Eastern Europe; FSU = Former Soviet Union; NAF = Northern Africa; EAF = Eastern Africa; WCA = Western and Central Africa; MEE = Middle East; CHN =China; OEA = Other East Asia; IND = India; OSA = Other South Asia; JPN =Japan; PAS = Other Pacific Asia; OCN = Australia, New Zealand, and other Oceania; LAC = Latin America and the Caribbean Sources: author’s estimate; BP, 2010; USGS, 2000; 2008; BGR, 2009; 2010.
440
Chapter 7
Energy Resources and Potentials
for resources located within the Arctic Circle (USGS, 2008). The table compiles reserves estimates from BP, BGR, and the USGS – the three organizations that regularly assess global oil reserves or resources. While reserve estimates exhibit only slight variance, less than 15% between the highest (7615 EJ by BP) and lowest estimates (6635 EJ by BGR), resource estimates show almost a 50% difference (4170 EJ by BGR and 6150 EJ by USGS).
diversifying its oil supply, China will inevitably become more dependent on Middle Eastern oil to fuel its economic development.
The discrepancies arise because of different definitions, boundaries, and classifications of different oil types. While reserves estimation is somewhat better defined, resource estimation has very few guidelines and is thus subject to greater institutional subjectivity. For example, the USGS resource estimate includes oil occurrences in the Arctic (768 EJ). Furthermore, estimates of resources in undiscovered fields, despite their inherent ambiguity, have also grown over time. This is mainly because technology changes that have either shifted resources from the unconventional to conventional category, or have opened new territories to exploration (e.g., deep-water areas).
Anaerobic biodegradation of light oil is recognized as the main process responsible for the large viscous oil deposits around the world (Atlas and Bartha, 1992; Head et al., 2003). Aitken et al. (2004) investigated the hydrocarbon degradation of 77 oil samples from around the world, including Canadian tar sands deposits, and concluded that the hydrocarbon biodegradation must have been an anaerobic process, at least at some point, and this is certainly the case for viscous oil deposits at depths where aerobic biodegradation was unlikely. Thus, light oil generated deep in megasynclinal structures migrated up-dip because of density differences and hydrodynamic forces until geochemical conditions suitable for biodegradation were encountered. Archaeobacteria then fed on the light oil, generating viscous oil and CH4. Furthermore, at shallow depths, some aerobic effects may occur, and light-oil fractions can also be removed by hydrodynamic washing and diffusion, further increasing the viscosity. As a result of increasing temperature and the biodegradation origins of viscous oil, it is rarely found below depths of ~2000 m; probably greater than 85% of the resource base is shallower than 1000 m (Figure 7.7).
Figure 7.6 displays the regional distribution of conventional oil reserves and resources. Almost two-thirds of global conventional oil is shared between the Middle Eastern countries (48.6%) and the Former Soviet Union (FSU) (16.7%), while the remaining regions, except Latin America (9.0%) and the United States (5.7%) hold less than 5% (BGR, 2009). The regional distribution of oil resources has significant implications for rapidly developing economies such as China and India. China’s ability to provide for its own needs is limited because its proven oil reserves are small compared to its consumption. Despite recent attempts at
7.2.3
Types of Unconventional Oil
7.2.3.1
Viscous Oil
Many of the molecules of high molecular weight, such as asphaltenes, that give the oil its high viscosity are the remnants of the cell walls (lipids) of the bioorganisms. The oil contains sulfur, as well as heavy
140
6000
5000
100 4000 80 3000
EJ
Conven�onal oil reserves and resources Gt
120
60 2000 40 1000
20
0 JPN
EAF
OSA
EEU
OEA
IND
OCN
SAF
CAN
PAS
CHN
WEU
WCA
NAF
USA
LAC
FSU
MEE
0
Figure 7.6 | Regional distribution of conventional oil reserves and resources. Source: BGR, 2010.
441
Energy Resources and Potentials
Chapter 7
Figure 7.7 | The ‘standard’ model for viscous oil formation. Source: Head et al., 2003.
metals such as vanadium and nickel. The concentration of these elements in viscous oil is a function of density: oils of ρ>1.0 can have sulfur concentrations greater than 4% and heavy metal contents as high as 500 parts per million (ppm). Viscous oils with ρ