information Article
Enhancement of RWSN Lifetime via Firework Clustering Algorithm Validated by ANN Ahmad Ali 1, * 1 2 3
*
ID
, Yu Ming 1, *, Tapas Si 2 , Saima Iram 3 and Sagnik Chakraborty 3
School of Electronics and Information Engineering, Hebei University of Technology, Tianjin 300401, China Department of Computer Science and Engineering, Bankura Unnayani Institute of Engineering, Bankura, West Bengal 722146, India;
[email protected] School of Energy and Environmental Engineering, Hebei University of Technology, Tianjin 300401, China;
[email protected] (S.I.);
[email protected] (S.C.) Correspondence:
[email protected] (A.A.);
[email protected] (Y.M.)
Received: 26 January 2018; Accepted: 8 March 2018; Published: 9 March 2018
Abstract: Nowadays, wireless power transfer is ubiquitously used in wireless rechargeable sensor networks (WSNs). Currently, the energy limitation is a grave concern issue for WSNs. However, lifetime enhancement of sensor networks is a challenging task need to be resolved. For addressing this issue, a wireless charging vehicle is an emerging technology to expand the overall network efficiency. The present study focuses on the enhancement of overall network lifetime of the rechargeable wireless sensor network. To resolve the issues mentioned above, we propose swarm intelligence based hard clustering approach using fireworks algorithm with the adaptive transfer function (FWA-ATF). In this work, the virtual clustering method has been applied in the routing process which utilizes the firework optimization algorithm. Still now, an FWA-ATF algorithm yet not applied by any researcher for RWSN. Furthermore, the validation study of the proposed method using the artificial neural network (ANN) backpropagation algorithm incorporated in the present study. Different algorithms are applied to evaluate the performance of proposed technique that gives the best results in this mechanism. Numerical results indicate that our method outperforms existing methods and yield performance up to 80% regarding energy consumption and vacation time of wireless charging vehicle. Keywords: WRSN; WSN; FWA-ATF; swarm intelligence; vacation time; energy minimization
1. Introduction Wireless communication and networks have become very popular in the last decade because of the increasing status and popularity of devices like wearables, vehicles, smart phones, sensors, actuators, and tablets having powerful multimedia applications and capabilities. According to the Wireless World Research Forum, in 2020 there will be 7 trillion wireless devices that will provide services to around 7 billion users [1]. The research report of CISCO suggests that global mobile data traffic would be 49 Exabytes by 2021 [2]. It envisages that annual mobile data traffic would exceed half a zettabyte. Internet of Things has played the pivotal and inevitable role in the evolution of wireless communication. Now it has a great significance on the technical, social and economic perspectives. The role of IoT is significant and impressive for the economy. The current studies show that 100 billion connected IoT devices are currently in use, but they would become 11 trillion by 2025 [3]. Machine-to-machine (M2M)-driven IoT would be different from the traditional or classic internet that emphasizes on the human to human communication. M2M communication would be used to demonstrate the magnitude more nodes, many of them will be having quite low-power or self-powered devices. The role of IoT has led to the extensive increase in the use of sensor network. Wireless sensor networks (WSNs) are constituted of a large number of small sensor nodes and they are being used in Information 2018, 9, 60; doi:10.3390/info9030060
www.mdpi.com/journal/information
Information 2018, 9, 60
2 of 13
large scale in many applications, monitoring of environments, for instance [4]. At present, existing sensor networks are mostly operated by batteries. This reduces the age of these sensor nodes. To avoid the high cost of replacing batteries, some research experts have adopted energy-efficient routing protocols to minimize the energy consumption of the sensor nodes. The key concern related to the Internet of Things (IoT)’s applications aims to prolong the battery life of machine-to-machine devices. Thereby, it will ascertain the working of the Internet of Things (IoT)’s devices for a long period [5]. The primary objective of resource allocation of the Internet of things (IoT)’s devices will have a more sustainable energy supply. The latter exposes an even more critical issue because of the ever growing presence of machine-to-machine devices; they are deployed in the areas which reflect that even frequent human maintenance or replacing the battery will not be possible [6]. This study aims to improve the energy efficient communication as found in wireless sensor networks which aims to eradicate the congestion problem. Promising solutions of joint clustering of devices and resource management have been proposed in the recent study. Ultimately, the solution will hinder signal interference, noise ratio, transmission delay, etc. [7]. The use of clustering methods will show immediate effects and benefits at large scale. Data priority will be for devising energy efficient clustering algorithms for congestion alleviation. The energy harvesting technique is an emerging technology which offers a solution to the challenge of finite battery life in sensor nodes [8]. Presently, researchers are focusing on applying energy harvesting techniques to eradicate the energy limitations, exist in battery-operated WSNs. The energy harvesting techniques may integrate with WSNs to enhance the network age and sensor nodes to gather ambient energy. These harvesting technologies are powered by sensor nodes via renewable energy resources like solar, wind, heat, radio frequency (RF) signal, etc. [9]. Nevertheless, due to the dynamic nature of such energy sources, either replacing or charging batteries could prove inconvenient due to the hazardous atmosphere. Renewable energy sources make deployment of wireless rechargeable sensor network (WRSN) possible by enabling sensor nodes to charge their batteries without any physical connection or even to make the WRSN battery-less. This advancement and great enhancement in wireless power transfer (WPT) can transfer energy wirelessly. The wireless power transfer technology can enhance battery-operated devices and exterminate complications due to wired networking [10]. WPT has become a significant and promising substitute for addressing the deliverance of energy for sensor nodes. However, wireless charging technology has ubiquitous potential research area for both industry and academia. When WRSN system uses efficient energy usage, it will become a crucial task. Particularly, optimal energy management has a basic rule to ensure the lifetime of low-powered devices like the IoT and sensor networks. The most promising solutions based on duty cycles arise during the use of WRSN. The development of clustering algorithms for improving the energy efficiency and the energy supply to the sensors has become an essential task for enhancing their life as well as the functional life of the Internet of Things (IoT)’s network [11]. The WRSN has come forth as a promising substitute for the traditional method of battery-powered operation and the energy harvesting techniques. RF can harvest and stably store energy from the corresponding devices such as cluster-head during WET cycle. Further, the stored energy utilizes by adopting energy efficient transmission techniques. Various research works have been proposed concerning the use of energy efficiency through using the WRSN technique and utilizing intelligently [12]. In the current study, an energy efficient firework algorithm has proposed for the wireless charging vehicle. The charging scenario in this study is similar to multi-hop provisioning, and the dynamic charger is replaced by wireless charging vehicles (WCV) which consist of Ni-MH batteries. Additionally, wireless charging vehicles will move from one sensor node to another throughout the entire network and recharge the batteries of sensor nodes wirelessly via multi-hop power transfer. Our approach uses the firework algorithm with the adaptive transfer function (FWA-ATF) to optimize the cluster head and chooses the cluster head nodes within each cluster. Firstly, firework algorithm divides the network into many regions. Further, it will choose the nearby cluster head based on the requirement of the remaining energy of the sensor node with position and center of the distance given in the region of gravity.
Information 2018, 9, x
3 of 13
of the remaining energy of the sensor node with position and center of the distance given in the 3 of 13 region of gravity.
Information 2018, 9, 60
2. Prior 2. Prior Knowledge Knowledge Rault et et al. al. proposed proposed an an energy energy optimization optimization model model to to deploy deploy the the minimum minimum number number of of static static Rault chargers to ensure the energy requirement of the sensor nodes in a multi-hop scenario. The authors chargers to ensure the energy requirement of the sensor nodes in a multi-hop scenario. The authors utilize aa modified modified Dijkstra’s Dijkstra’s algorithm algorithm to to build build the the shortest shortest path path tree tree to to minimize minimize the the energy energy transfer transfer utilize loss during data transmission. Furthermore, the authors run a MILP model to decrease the total loss during data transmission. Furthermore, the authors run a MILP model to decrease the total number of chargers required to fulfill the energy constraint of every node [13]. number of chargers required to fulfill the energy constraint of every node [13]. Chen et et al. al. proposed minimize the the energy energy Chen proposed an an energy-efficient energy-efficient geometric geometric routing routing protocol protocol to to minimize consumption of the sensor nodes regarding maximizing the network lifetime. Their proposed consumption of the sensor nodes regarding maximizing the network lifetime. Their proposed solution solution to suggests divides sensorinto network into applies grids and the single point to recharging numerous suggests dividestothe sensorthe network grids and theapplies single point to numerous recharging schemes and Moore curve the to calculate the routing path. Their is to ensure the schemes and Moore curve to calculate routing path. Their objective is toobjective ensure the sensor nodes sensor nodes can be operational forever with sufficient remaining energy [14]. can be operational forever with sufficient remaining energy [14]. Aslam et et al. al. proposed Aslam proposed aa grid grid clustering clustering routing routing algorithm algorithm to to balance balance the the network network lifetime, lifetime, considering the vacation time, energy consumption, and remaining energy of the network. They They considering the vacation time, energy consumption, and remaining energy of the network. deployed the shortest path model to enhance the vacation time of the network and grid clustering deployed the shortest path model to enhance the vacation time of the network and grid clustering to to balance energy consumption [15]. balance thethe energy consumption [15]. Wang et al. employed a dynamic optimalscheduling schedulingmethod methodtotomaximize maximizethe thevacation vacationtime time Wang et al. employed a dynamic optimal ofof a a single mobile charger for the wireless rechargeable sensor network. Their proposed scheme single mobile charger for the wireless rechargeable sensor network. Their proposed scheme divided divided the network into many sub-networks to the prolong the network lifetime [16]. the network into many sub-networks to prolong network lifetime [16]. Vamvakaset al. studied the problem of user-centric energy-efficient power management management in in aa Vamvakaset al. studied the problem of user-centric energy-efficient power rechargeable wireless wireless sensor sensor network. network. Their WIT phases phases to to rechargeable Their proposed proposed algorithm algorithm adopts adopts WET WET and and WIT provide the energy-efficient communication [17]. provide the energy-efficient communication [17]. Eirini et et al. al. proposed of clustering clustering such such as as devices devices of of the the Eirini proposed an an approach approach which which enables enables the the use use of cluster with with the thehelp helpofofmember membercluster clusterheads. heads.Their Their approach harvest stably store energy cluster approach cancan harvest andand stably store energy via via RF signals adopting the wireless rechargeable sensor network paradigm [18]. RF signals adopting the wireless rechargeable sensor network paradigm [18]. 3. The Framework of of the the Present Present Study Study 3. The Framework The current currentproblem problemfocuses focuses wireless rechargeable sensor network (WRSN), The onon thethe wireless rechargeable sensor network (WRSN), sensor sensor nodes nodes deploy over a two-dimensional area in an open environment in N distributed waysinshown deploy over a two-dimensional area in an open environment in N distributed ways shown Figurein 1. Figure 1. Furthermore, notations used in this paper appended in Table 1. Furthermore, notations used in this paper appended in Table 1.
Figure 1. A WRSN with a wireless charging vehicle deployed over single-hop and and multi-hop multi-hop link. link.
Information 2018, 9, 60
4 of 13
Table 1. The notations used in the paper. Notation WCV BS N Emax Emin V Ri Rc gij (t) or giB (t) ρ Cij or CiB pi (t) τ τi τvac Xc , Yc xi , yi CH D T
Definition Wireless charging vehicle Base station Sensor nodes deploy in WSN Maximum battery capacity of nodes Minimal battery level of a node to remain operational Moving velocity of wireless charging vehicle The rate of generating sensing data at sensor node i Communication Radius of wireless charging vehicle Data flow rate over a link from node i to node j and the BS Energy consumption coefficient for retrieving the information Energy consumption per transmitting the data rate from node i to j and the BS Energy consumption rate Overall time consumed by the wireless charging vehicle in a charging cycle Time consumed by wireless charging vehicle to charge the battery of node i Vacation time of wireless charging vehicle to recharge itself Center of gravity Coordinates of sensor Cluster head Distance between the sensor node and center of gravity Each round of data transmission cycle in the network
WCV is responsible for refilling energy for all the sensors. Each sensor node equipped with identical energy. The energy consumption rates with a maximum energy Emax and it is assumed to be charged fully at the initial level. If the battery level of sensor node exhausted below the threshold Emin , a recharge request is immediately triggered and would be sent to the base station. Further, the base station will inform about the application to WCV and responses back either to recharge the battery or to replace the battery. In our proposed model, each node sends data to the base station through multi-hop routing, and WCVs is responsible for recharging the battery of all the nodes. Each sensor node generates sensing data with a rate of Ri . WCV is equipped with a robust battery pack capacity of Emax and consumes Cij KJ energy while moving. During each cycle, WCV starts from the service station to charge each sensor nodes on its charging cycle. The WCV travels as a given velocity (V m/s) and visits each node in the network to recharge the sensor nodes. The sensor nodes are chosen by the WCV for recharging based on the shortest distance. The WCV has its communication radius which is denoted by (Rc ). The WCV calculates the distance to each neighboring node within its communication radius and chooses the node with the minimum distance for recharging. Additionally, when the battery of WCV is about to be exhausted completely, it returns to the service station for SOS action, such as recharging of the cell or replacement of the battery. 3.1. Energy Consumption Model The proposed model is used for controlling the data flow and energy, used for each sensor node for the rechargeable wireless sensor network (WRSNs). This model brings forth a routing scheme with the use of following data flow balance constraints. k 6 =i
j 6 =i
k ∈N
j ∈N
∑ gki (t) + Ri = ∑ gij (t) + giB (t) (i ∈ N, t ≥ 0)
(1)
Here, gij (t) and giB (t) denotes as data flow traveling over a link from sensor node i to sensor node j and to the base station respectively. Two important requirements are requisites for the energy consumption of a sensor node during a renewable energy phase.
Information 2018, 9, 60
1. 2. 3.
5 of 13
During the renewable energy process, the energy of each sensor node remains equal both at the beginning and at the end of the renewable cycle with the time of t. The battery of each sensor node is fully charged initially and has a capacity of Emax . To make a sensor node operational; the energy of the sensor node is never less than the Emin . The following energy constraint handles the issues above: k 6 =i
pi (t) = ρ ∑ gki (t) + k ∈N
j 6 =i
∑ Cij gij (t) + CiB giB (t) (i ∈ N, t ≥ 0)
(2)
j ∈N
In a recent study, the following equation is used as the energy consumption model. Here, it is defined as energy consumption for data reception and data transmission. The pi (t) represents the energy consumption rate at the node i ∈ N, t ≥ 0. Whereas ρ denoted as energy consumption for retrieving the information, Cij is the energy consumption per transmitting the data rate from sensor k 6 =i
node i to j and the base station. In this energy consumption model, ρ ∑ gki (t) represents the energy k ∈N
j 6 =i
consumption rate for collecting the information (reception) and ∑ Cij gij (t) + CiB giB (t) is the energy j ∈N
consumption rate for transmitting the information (transmission) from the sensor nodes. According to the proposed model, when the residual energy falls below a given threshold Emin , this sensor node cannot be operational anymore. A charging cycle can be summarized into three parts. 1. 2.
3.
The charging tour of the wireless charging device starts from the service station and reach sensor node i on the given path. During the time, the wireless charging device charges the battery of sensor node i wirelessly via wireless energy transfer (WET). Then, wireless charging device moves towards the next sensor node to charge it. After completion of the one energy cycle, the wireless charging device will return to the service station to recharge itself (e.g., recharging and replacing its battery). This period is called vacation time, denoted as τvac . After servicing itself, the wireless charging device will start its next energy cycle. The τ represents the overall time spent during one energy cycle by the wireless charging device.
Furthermore, the primary goal of the study aims to recharge the battery of each sensor node in the wireless rechargeable sensor network (RWSNs) that energy of each sensor node never falls below given threshold Emin . In the current study, the major objective to enhance the vacation time over a cycle (i.e., τvac τ ), and minimize the total energy consumption of the network. However, Shi et al. [19] considered a static multi-hop routing scheme to cope with above-mentioned issues, and in the current study, it has proposed a firework algorithm-based hard clustering technique for dynamic selection of cluster head using multi-hop routing. 3.2. Proposed Method In this section, a wireless charging vehicle is employed to gather the information from different WSNs divisions. Therefore, the clustering and firework algorithm (FWA-ATF) methods are applied together while considering the whole WSNs performance regarding network lifetime, vacation time, energy consumption, etc. Sensor network deploys N sensors, and the network is subdivided into M clusters. The partition line for the network region calculated with the help of a firework algorithm (FWA-ATF). Fireworks algorithm (FWA) is a recently developed swarm intelligence algorithm, and it simulates the explosion process of fireworks in the sky at night [20]. Each location of fireworks represents a solution in the search space. There are two types of sparks, and they are “explosion spark” and “gaussian spark”.
Information 2018, 9, 60
6 of 13
In FWA-ATF, initially, objective values are normalized within the range (0,1) which has determined by the equation f ( xi ) − ymin 0 fi = (3) ymax − ymin 0
f i values are sorted in ascending order. ymin is minimum function value and ymax is maximum function value. The difference of normalized fitness values is calculated as 0
0
d p+1 = | f p − f p+1 |, p = 1, 2, 3, . . . , N − 1 and d p = 0
(4)
The following equation calculates the adaptive score value n
scoren = n + ∑ di , n = 1, 2, 3, . . . , N
(5)
i =1
The adaptive score use in transfer based on the equation T (n) =
1
(6)
1 + e(scorek )
The number of “explosion sparks” produced by the firework is evaluated by the equation Si = M ×
T (i )
(7)
∑iN=1 T (i )
where M, is designated the maximum number of sparks produced by a firework. The amplitude of the “explosion sparks” is determined as Ai = A ×
T ( N − i + 1) ∑iN=1 T (i )
(8)
where A, represents the maximum amplitude generated by the explosion sparks, when the explosion sparks are generated, a randomly selected element of firework position oscillates with different displacement. The displacement ∆x j is determined as ∆x j = An × rand(−1, 1)
(9)
Here, j ∈ [1, D ], is an arbitrary index of the nth firework dimension. rand(−1,1) is the equally distributed arbitrary value within the range (−1,1). Subsequently, generation of explosion spark, arbitrary mutation operator applied to generate the mutated sparks from the fireworks. Initially, a firework is randomly chosen. Furthermore, the locations of the fireworks are arbitrarily chosen and individual chosen kth location in nth firework is mutated as xnk = xmin + ( xmax − xmin ) × rand(0, 1)
(10)
Here, rand(0,1) is an equally dispersed arbitrary number within the range (0,1). The detailed information regarding FWA-ATF algorithm provided in the literature [21]. Cluster validity index Davis–Bouldin (DB) index [22] use as an objective function. The DB-index is a function of the ratio of the sum of intra-cluster scatter to the inter-cluster separation. The ith intra-cluster scatter defined as 1
Si,q
1 = Ni
q
∑
→
∀ x ∈Ck
→
|x
→ q − mi |
(11)
Information 2018, 9, 60
7 of 13
The inter-cluster distance between the ith and the jth cluster defined as " Dij =
d
∑ |mi,p − m j,p |
#1 t
t
(12)
p =1
→
where mi is the mid-point of the ith cluster, q, t ≥ 1, q, t an integer, Ni = |Ci | are the values present in the ith cluster Ci . q and t set as to 2 in this current work. Ri, qt is calculated as ( Ri,qt =
max j∈K j 6= i
Si,q + S j,q Dij
) (13)
Finally, the DB-index is determined by the equation DB(K ) =
1 K Ri,qt K i∑ =1
(14)
The calculated DB-index is significantly low, suggesting good clustering. 3.3. Cluster Head (CH) Selection As each sensor node keeps limited energy, the cluster heads are required to gather needed information of the sensor nodes and then send it forward. The remaining energy of the sensor node should be kept in mind while selecting the cluster head. The selection process of cluster head (CH) is given below. 1.
The center of gravity is determined according to the coordinates of each sensor node. The center of gravity (Xc , Yc ) must be fulfilled, based on the least square and minimum distance of sensor node given in the region. The formula below can evaluate the concrete calculation method. N
( Xc , Yc ) = min ∑ [( x − xi )2 + (y − yi )2 ]
(15)
i =1
2.
(xi , yi ) represent coordinates of each sensor node. Node’s coordinates can calculate the distance between the sensor node and center of gravity. d=
3. 4. 5.
q
( xc− xi )2 + (yc − y j )2
(16)
The remaining average energy of all nodes evaluated in each cluster. If the remaining energy of a node is higher than the other nodes of the average leftover energy, the sensor node will be elected as the head. Otherwise, next node can be chosen. After completion of one energy cycle and wireless charging, vehicle visits all cluster heads (CH), a round of reception and data transmission is completed. T represents each series of data transmission cycles in the network. T can be evaluated by using the formula. n −1
T=
∑
i =0
q
( x i + 1 − x i )2 + ( y i + 1 − y i )2 V
where V represents the moving velocity of wireless charging vehicle.
(17)
Information 2018, 9, 60
8 of 13
4. Simulation and Numerical Analysis In the simulation experiments, it is evident that numerical results illustrated the performance of the proposed algorithm for the rechargeable wireless sensor network. The goal of the simulation is to assess the performance of the proposed algorithm. To evaluate the performance of existing algorithms—such as GR protocol and the grid clustering algorithm—that utilize a multi-hop network scenario, the comparative analysis conducted on the performance metrics that include energy consumption, vacation time, and remaining energy of the network. The maximum energy (Emax ) of each sensor node at the initial stage of the simulation is considered to be 10,800 J and fully charged. The minimum energy (Emin ) of a sensor node is supposed to be 540 J, and the sensor node with less Information 2018, 9, x of 13 energy than the minimum energy (Emin ) is deemed to be exhausted. The details of proposed 8simulation parameters represent in Table 2. The represent corresponding simulations were performed in MATLAB proposed simulation parameters in Table 2. The corresponding simulations were2012a usingperformed a desktopinPC with an2012a Intelusing (i5-2520) Processor @ 2.50 GHz with 8Processor GB of RAM. MATLAB a desktop PC with an Intel (i5-2520) @ 2.50 GHz with 8 GB of RAM. Table 2. Simulation parameters [23–25]. Table 2. Simulation parameters [23–25].
Parameters Parameters Number of sensor nodes, N N Number of sensor nodes, Length Length Breadth Breadth Emax —Maximum energy of a node Emax—Maximum energy of a node Emin —Minimum energy of a node EminBase —Minimum energy of a node station location Base station location WCV location WCV location Speed of WCV Speed U of WCV Path loss U Antenna Path loss Algorithm Antenna Simulation time Algorithm Data communication radius Simulation time Data communication radius
Values Values 50 50 1000 1000 m m 1000 m 1000 m 10800 J 10800 J 540 J 540 J 500] m [500, [500, 500] [0,m0] [0, 0]5 m/s 5 m/s5 W Log-Normal Shadowing 5W OmniShadowing Directional Log-Normal FWA-ATF Omni Directional 1h FWA-ATF 100 m 1h 100 m
Numerical Analysis Numerical Analysis
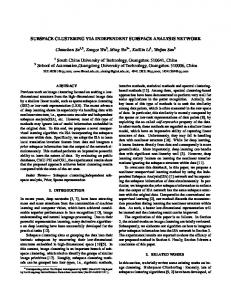
Figure 2 depicted the total residual energy of the proposed scheme as well as existing schemes Figure 2 depicted total residual energy the proposed scheme as to well as existing with the comparison. The the remaining energy is theofmost crucial parameter estimate the schemes performance with the comparison. The remaining energy is the most crucial parameter to estimate the of the wireless rechargeable sensor network. The remaining energy is computed after the completion performance of the wireless rechargeable sensor network. The remaining energy is computed after of one energy cycle of the system. The evaluation shows that the total remaining energy of the system the completion of one energy cycle of the system. The evaluation shows that the total remaining with energy the help of firework algorithm with the adaptive transfer function (FWA-ATF) significantly of the system with the help of firework algorithm with the adaptive transfer function improved as compared to existing techniques. (FWA-ATF) significantly improved as compared to existing techniques.
Remaining Energy (KJ)
10.8
10.6
10.4
10.2
10.0
Single Hop GR Protocol Grid Clustering FWA-ATF
500
1000
1500
2000
2500
3000
Time (s)
Figure2.2. Remaining Remaining energy Figure energyofofnodes. nodes.
Energy consumption refers to the total energy conserved by the network reception, transmission, and data processing. In the proposed model, a comparison is performed among the different techniques such as single hop, GR protocol [10], grid clustering [11], and firework algorithm with the adaptive transfer function (FWA-ATF) based on energy consumption. Energy consumption helps to predict the lifetime of the network. Figure 3 shows the comparison of power
Information 2018, 9, 60
9 of 13
Energy consumption refers to the total energy conserved by the network reception, transmission, and data processing. In the proposed model, a comparison is performed among the different techniques such as single hop, GR protocol [10], grid clustering [11], and firework algorithm with the adaptive transfer function (FWA-ATF) based on energy consumption. Energy consumption helps to predict the lifetime of the network. Figure 3 shows the comparison of power consumption of proposed and existing algorithms regarding energy consumption. It is evident that swarm intelligence based Information Information 2018,2018, 9, x 9, x 9 of913of 13 clustering algorithm achieves the best results compared with existing algorithms. KJ KJ 54.86434.8643
5
4
2
Energy consumption(KJ)
Energy consumption(KJ)
4
3
1. Single 1. Single Hop Hop GR Protocol 2. GR 2. Protocol Grid Clustering 3. Grid3.Clustering 4. FWA-ATF 4. FWA-ATF
KJ KJ 3.16553.1655
3 KJ KJ 2.48392.4839
2
1
1
0.49480.4948 KJ KJ
0
0
1
1
2
2
3
3
4
4
Algorithms Algorithms Figure 3. Consumption. Figure 3. Energy Consumption. Figure 3. Energy Energy Consumption.
5
5
4
4
3
2
Vacation Time (h)
Vacation Time (h)
Vacation time refers to the time of wireless charging vehicle after completion of one energy Vacation time refers to the idleidle time of wireless charging vehicle after completion of one energy Vacation time refers to the idle time of wireless charging vehicle after completion of one energy cycle. WCV return to the service station to recharge itself. Figure 4 shows maximum vacation cycle. WCV willwill return to the service station to recharge itself. Figure 4 shows maximum vacation is is cycle. WCV will return to the service station to recharge itself. Figure 4 shows maximum vacation significantly improved with the help the firework algorithm with the adaptive transfer function significantly improved with the help the firework algorithm with the adaptive transfer function is significantly improved the helphigher the firework algorithm with the adaptive transfer and function (FWA-ATF), achieving anwith almost vacation time in comparison to GR protocol (FWA-ATF), achieving an almost 80%80% higher vacation time in comparison to GR protocol and gridgrid (FWA-ATF), achieving an almost 80% higher vacation time in comparison to GR protocol and grid clustering algorithms. clustering algorithms. clustering algorithms. hr hr 10.10410.104
1. Single 1. Single Hop Hop GR Protocol 2. GR 2. Protocol Grid Clustering 3. Grid3.Clustering 4. FWA-ATF 4. FWA-ATF
3
hr 2.01332.0133 hr
2 hr 1.44221.4422 hr hr 1.02791.0279 hr
1
1
0
0
1
1
2
2
3
3
4
4
Algorithms Algorithms Figure 4. Time. Figure 4. Vacation Time. Figure 4. Vacation Vacation Time.
5. Validation of the Present Study 5. Validation of the Present Study In this study, swarm intelligence method been implemented to improve network In this study, swarm intelligence method hashas been implemented to improve the the network lifetime. Further, obtained experimental results of the swarm intelligence were validated by the lifetime. Further, the the obtained experimental results of the swarm intelligence were validated by the machine learning approach artificial neural network (ANN). three-layer architecture of the machine learning approach artificial neural network (ANN). TheThe three-layer architecture of the ANN model depicted in Figure 5 was employed study. layer consists of three ANN model depicted in Figure 5 was employed for for thisthis study. TheThe firstfirst layer consists of three neurons-like nodes. location of the nodes, transfer output layer, a single neurons-like nodes. ForFor the the location of the nodes, datadata transfer rate,rate, andand output layer, onlyonly a single neuron employed, remaining energy of nodes selected. neural network neuron waswas employed, i.e.,i.e., the the remaining energy of nodes waswas selected. TheThe neural network
Information 2018, 9, 60
10 of 13
5. Validation of the Present Study In this study, swarm intelligence method has been implemented to improve the network lifetime. Further, the obtained experimental results of the swarm intelligence were validated by the machine learning approach artificial neural network (ANN). The three-layer architecture of the ANN model depicted in Figure 5 was employed for this study. The first layer consists of three neurons-like nodes. For the location of the nodes, data transfer rate, and output layer, only a single neuron was employed, i.e., the remaining energy of nodes was selected. The neural network complexity was evaluated by the presence of hidden nodes in the layer. Although, the presence of several neurons may lead to over fitting for the model [26]. After several trials and training, the best model was generated. Information 2018, 9, x 10 of 13 The greatest number of epochs was found by trial and error method. The performance goal and minimum performance gradient were usually for the affirmation of the good performance. The total performance. The total dataset was separated into three subsets—50% data for training, a further 25% dataset was separated into three subsets—50% data for training, a further 25% for validation, and the for validation, and the remaining 25% of the data was employed as an investigation set. The dataset remaining 25% of the data was employed as an investigation set. The dataset was normalized (0,1) [27] was normalized (0,1) [27] by applying the equation by applying the equation − Xmin X − 0 xi = 0.8( i ) + 0.1 (18) (18) Xmax − − Xmin Here, X Xii represents represents input input or denote the the minimum minimum and and Here, or output output variable variable of of X, X, XXmin min,, and and X Xmax max denote maximum value of X. The artificial neural network (ANN) is performed by applying the Toolbox of maximum value of X. The artificial neural network (ANN) is performed by applying the Toolbox of MATLAB Version 2012a in this present study. MATLAB Version 2012a in this present study.
Figure Figure 5. 5. Artificial Artificial neural neural network network (ANN) (ANN) architecture. architecture.
The evaluation affirms that 10 neurons generate at fewest errors in the training and The evaluation affirms that 10 neurons generate at fewest errors in the training and endorsement endorsement sets. The remaining energy in the nodes was selected as an output and the best sets. The remaining energy in the nodes was selected as an output and the best coefficient correlation coefficient correlation (R) among the model prediction and obtained experimental results showed (R) among the model prediction and obtained experimental results showed close to 1 recognized to close to 1 recognized to be an ideal model for this present study. The maximum ANN architecture be an ideal model for this present study. The maximum ANN architecture is based on feed forward is based on feed forward networks and it has been trained via a backpropagation algorithm. The networks and it has been trained via a backpropagation algorithm. The linear transfer function linear transfer function “PURELIN” was selected for the input to the hidden layer further “Tansig” “PURELIN” was selected for the input to the hidden layer further “Tansig” functions were selected functions were selected for the hidden layer to the output layer. The obtained data of correlation for the hidden layer to the output layer. The obtained data of correlation coefficient (R) calculated the coefficient (R) calculated the best match among 20 consecutive runs. The regression plot is shown in best match among 20 consecutive runs. The regression plot is shown in Figure 6. After completion Figure 6. After completion of the ANN training, the network provides the correlation coefficient of the ANN training, the network provides the correlation coefficient value of 0.992. In the present value of 0.992. In the present study, conjugate gradient backpropagation with Polak–Ribiere study, conjugate gradient backpropagation with Polak–Ribiere (Traingcp), resilient back propagation (Traingcp), resilient back propagation (Trainrp), gradient descent with momentum, adaptive (Trainrp), gradient descent with momentum, adaptive learning rate backpropagation (Traingdx), scaled learning rate backpropagation (Traingdx), scaled conjugate gradient (Trainscg), and conjugate gradient (Trainscg), and Levenberg–Marquardt backpropagation (Trainlm) were evaluated Levenberg–Marquardt backpropagation (Trainlm) were evaluated for the best output result. It for the best output result. It suggests that Resilient Backpropagation fits well with the obtained data suggests that Resilient Backpropagation fits well with the obtained data as demonstrated in Table 3. as demonstrated in Table 3. After training the ANN, the resilient backpropagation (Trainrp) fit well After training the ANN, the resilient backpropagation (Trainrp) fit well compared to other compared to other algorithms applied in this present study. algorithms applied in this present study. Table 3. Summary of algorithms employed in this present study. Hidden Layer Algorithm Resilient backpropagation Conjugate gradient backpropagation with Polak–Ribiere updates Gradient descent with momentum and
Output Layer Function Trainrp
Transfer Function Poslin
Transfer Function Tansig
Correlation Coefficient (R) 0.992
Traincgp
Poslin
Tansig
0.756
Information 2018, 9, 60
11 of 13
Table 3. Summary of algorithms employed in this present study. Hidden Layer Algorithm
Output Layer Function
Transfer Function
Transfer Function
Correlation Coefficient (R)
Resilient backpropagation
Trainrp
Poslin
Tansig
0.992
Conjugate gradient backpropagation with Polak–Ribiere updates
Traincgp
Poslin
Tansig
0.756
Gradient descent with momentum and adaptive learning rate backpropagation
Traingdx
Poslin
Tansig
0.731
Levenberg–Marquardt backpropagation
Trainlm
Poslin
Tansig
0.674
Scaled conjugate gradient backpropagation
Trainscg
Poslin
Tansig
0.66811 of 13
Information 2018, 9, x
Figure 6. Regression plot (experimental vs. predicted) employing 3 factors, 10 neurons present in Figure 6. Regression plot (experimental vs. predicted) employing 3 factors, 10 neurons present in the the hidden layer, and 1 output factor applying the ANN model. hidden layer, and 1 output factor applying the ANN model.
6. Conclusions 6. Conclusions The current study represents the problem of prolonging the network lifetime in a rechargeable The current represents problem of prolonging network lifetime in athe rechargeable wireless sensorstudy network scenario,the where a wireless chargingthe vehicle travels through network wireless sensor network scenario, where a wireless charging vehicle travels through the network and and recharge the battery of randomly deployed sensor nodes. It has been attempted to minimize the recharge battery ofand randomly deployed sensor nodes. It has charging been attempted to minimize energy the consumption maximize the vacation time of wireless vehicle considering thethe overall network lifetime. The FWA-ATF algorithm evaluate the selection of thethe energy consumption and maximize the vacation timeisofproposed wireless to charging vehicle considering cluster head based on the sensor node position and energy. Numerical resultsofverify our overall network lifetime. The FWA-ATF algorithm is remaining proposed to evaluate the selection the cluster design, which shows that our methodology outperforms in extension of network lifetime compared head based on the sensor node position and remaining energy. Numerical results verify our design, to the baseline Moreover,outperforms we have validated our approach efficiently employing which shows that method. our methodology in extension of network lifetimebycompared to athe three-layered neural network. Five algorithms are used in the artificial neural network training to baseline method. Moreover, we have validated our approach efficiently by employing a three-layered evaluate the performance of the proposed method. The simulation results corroborate the neural network. Five algorithms are used in the artificial neural network training to evaluate the superiorityofofthe theproposed resilient backpropagation over the results other algorithms applied in this study. performance method. The simulation corroborate the superiority of the resilient backpropagation over the other algorithms applied in this study. Acknowledgments: The authors would like to express their deepest gratitude to the Hebei University of Technology for extending all the essential materials required for the successful completion of this research Acknowledgments: The authors would like to express their deepest gratitude to the Hebei University of paper. Myfor special thanks all arethe dueessential to China materials Scholarship Council for (CSC) providingcompletion timely funds my Technology extending required thefor successful oftowards this research Doctoral study. thanks are due to China Scholarship Council (CSC) for providing timely funds towards my paper. My special Doctoral study. Author Contributions: All the authors have contributed equally to this research work. Author Contributions: All the authors have contributed equally to this research work. Conflicts of Interest: The authors declare no conflicts of interest. Conflicts of Interest: The authors declare no conflicts of interest.
References 1. 2.
David, K.; Dixit, D.; Jefferies, N. 2020 Vision: The Wireless World Research Forum Looks to the Future. IEEE Veh. Technol. Mag. 2010, 5, 22–29. Cisco Visual Networking Index. Global Mobile Data Traffic Forecast Update, 2016–2021 White Paper; Cisco: San Jose, CA, USA, 2017.
Information 2018, 9, 60
12 of 13
References 1. 2. 3. 4. 5.
6. 7.
8. 9. 10. 11. 12. 13.
14.
15. 16. 17.
18. 19.
20.
21.
David, K.; Dixit, D.; Jefferies, N. 2020 Vision: The Wireless World Research Forum Looks to the Future. IEEE Veh. Technol. Mag. 2010, 5, 22–29. [CrossRef] Cisco Visual Networking Index. Global Mobile Data Traffic Forecast Update, 2016–2021 White Paper; Cisco: San Jose, CA, USA, 2017. Rose, K.; Eldridge, S.; Chapin, L. The Internet of Things (IoT): An Overview–Understanding the Issues and Challenges of a More Connected World; The Internet Society (ISOC): Reston, VI, USA, 2015. Ali, A.; Ming, Y.; Chakraborty, S.; Iram, S. A comprehensive survey on real-time applications of WSN. Future Internet 2017, 9, 77. [CrossRef] Tsiropoulou, E.E.; Paruchuri, S.T.; Baras, J.S. Interest, energy and physical-aware coalition formation and resource allocation in smart IoT applications. In Proceedings of the 2017 51st Annual Conference on Information Sciences and Systems (CISS), Baltimore, MD, USA, 22–24 March 2017; pp. 1–6. Elappila, M.; Chinara, S.; Parhi, D.R. Survivable path routing in WSN for IoT applications. Pervasive Mob. Comput. 2018, 43, 49–63. [CrossRef] Tefek, U.; Lim, T.J. Clustering and radio resource partitioning for machine-type communications in cellular networks. In Proceedings of the 2016 IEEE Wireless Communications and Networking Conference (WCNC), Doha, Qatar, 3–6 April 2016; pp. 1–6. Sherazi, H.H.R.; Grieco, L.A.; Boggia, G. A comprehensive review on energy harvesting MAC protocols in WSNs: Challenges and tradeoffs. Ad Hoc Netw. 2018, 71, 117–134. [CrossRef] Sudevalayam, S.; Kulkarni, P. Energy harvesting sensor nodes: Survey and implications. IEEE Commun. Surv. Tutor. 2011, 13, 443–461. [CrossRef] Liu, Q.; Golinnski, ´ M.; Pawełczak, P.; Warnier, M. Green wireless power transfer networks. IEEE J. Sel. Areas Commun. 2016, 34, 1740–1756. [CrossRef] Lu, X.; Wang, P.; Niyato, D.; Kim, D.I.; Han, Z. Wireless charging technologies: Fundamentals, standards, and network applications. IEEE Commun. Surv. Tutor. 2016, 18, 1413–1452. [CrossRef] Niyato, D.; Kim, D.I.; Maso, M.; Han, Z. Wireless powered communication networks: Research directions and technological approaches. IEEE Wirel. Commun. 2017, 24, 88–97. [CrossRef] Rault, T.; Bouabdallah, A.; Challal, Y. Multi-hop wireless charging optimization in low-power networks. In Proceedings of the 2013 IEEE Global Communications Conference (GLOBECOM), Atlanta, GA, USA, 9–13 December 2013; pp. 462–467. Chen, S.-H.; Cheng, Y.-C.; Lee, C.-H.; Wang, S.-P.; Chen, H.-Y.; Chen, T.-Y.; Wei, H.-W.; Shih, W.-K. Extending sensor network lifetime via wireless charging vehicle with an efficient routing protocol. In Proceedings of the 2016 SoutheastCon, Norfolk, VA, USA, 30 March–3 April 2016; pp. 1–2. Aslam, N.; Xia, K.; Haider, M.T.; Hadi, M.U. Energy-aware adaptive weighted grid clustering algorithm for renewable wireless sensor networks. Future Internet 2017, 9, 54. [CrossRef] Wang, Q.; Kong, F.; Wang, M.; Wang, H. Optimized charging scheduling with single mobile charger for wireless rechargeable sensor networks. Symmetry 2017, 9, 285. [CrossRef] Vamvakas, P.; Tsiropoulou, E.E.; Vomvas, M.; Papavassiliou, S. Adaptive power management in wireless powered communication networks: A user-centric approach. In Proceedings of the 2017 IEEE 38th Sarnoff Symposium, Newark, NJ, USA, 18–20 September 2017; pp. 1–6. Tsiropoulou, E.E.; Mitsis, G.; Papavassiliou, S. Interest-aware energy collection & resource management in machine to machine communications. Ad Hoc Netw. 2018, 68, 48–57. Xie, L.; Shi, Y.; Hou, Y.T.; Lou, W.; Sherali, H.D.; Midkiff, S.F. On renewable sensor networks with wireless energy transfer: The multi-node case. In Proceedings of the 2012 9th Annual IEEE Communications Society Conference on Sensor, Mesh and Ad Hoc Communications and Networks (SECON), Seoul, Korea, 18–21 June 2012; pp. 10–18. Si, T.; Ghosh, R. Explosion sparks generation using adaptive transfer function in firework algorithm. In Proceedings of the 2015 3rd International Conference on Signal Processing, Communication and Networking (ICSCN), Chennai, India, 26–28 March 2015; pp. 1–9. Misra, P.R.; Si, T. Image segmentation using clustering with fireworks algorithm. In Proceedings of the 2017 11th International Conference on Intelligent Systems and Control (ISCO), Coimbatore, India, 5–6 January 2017; pp. 97–102.
Information 2018, 9, 60
22. 23. 24. 25. 26. 27.
13 of 13
Davies, D.L.; Bouldin, D.W. A cluster separation measure. IEEE Trans. Pattern Anal. Mach. Intell. 1979, 224–227. [CrossRef] Hou, Y.T.; Shi, Y.; Sherali, H.D. Applied Optimization Methods for Wireless Networks; Cambridge University Press: New York, NY, USA, 2014. Shi, L.; Han, J.; Han, D.; Ding, X.; Wei, Z. The dynamic routing algorithm for renewable wireless sensor networks with wireless power transfer. Comput. Netw. 2014, 74, 34–52. [CrossRef] Kurs, A.; Karalis, A.; Moffatt, R.; Joannopoulos, J.D.; Fisher, P.; Soljaˇci´c, M. Wireless power transfer via strongly coupled magnetic resonances. Science 2007, 317, 83–86. [CrossRef] [PubMed] Kumar, K.V.; Porkodi, K. Modelling the solid–liquid adsorption processes using artificial neural networks trained by pseudo second order kinetics. Chem. Eng. J. 2009, 148, 20–25. [CrossRef] Chakraborty, S.; Chowdhury, S.; Saha, P.D. Artificial neural network (ANN) modeling of dynamic adsorption of crystal violet from aqueous solution using citric-acid-modified rice (Oryza sativa) straw as adsorbent. Clean Technol. Environ. Policy 2013, 15, 255–264. [CrossRef] © 2018 by the authors. Licensee MDPI, Basel, Switzerland. This article is an open access article distributed under the terms and conditions of the Creative Commons Attribution (CC BY) license (http://creativecommons.org/licenses/by/4.0/).