1
Enhancement of Spin Coherence using Q-factor engineering in Semiconductor Microdisk Lasers S. Ghosh1, W. H. Wang2, F. M. Mendoza1, R. C. Myers1, X. Li2, N. Samarth2, A. C. Gossard1, and D. D. Awschalom1. 1
Center for Spintronics and Quantum Computation, University of California, Santa
Barbara, CA 93106, USA 2
Materials Research Institute, Penn State University, University Park, PA 16802, USA
Semiconductor microcavities offer unique means of controlling light-matter interactions, which have led to the development of a wide range of applications in optical communications1 and inspired proposals for quantum information processing and computational schemes2,3. Studies of spin dynamics in microcavities – a new and promising research field – have revealed novel effects such as polarization beats, stimulated spin scattering, and giant Faraday rotation4-7. Here, we study the electron spin dynamics in optically-pumped GaAs microdisk lasers with quantum wells (QWs) and interface-fluctuation quantum dots8 (QDs) in the active region. In particular, we address the question of how the electron spin dynamics are modified by the stimulated emission in the disks, and observe an enhancement of the spin lifetime when the optical excitation is in resonance with a high quality (Q ~ 5000) lasing mode. This resonant enhancement, contrary to what is expected from the Purcell effect9 observed in the cavities, is then manipulated by altering the cavity design and dimensions.
2
Semiconductor microdisk lasers, based on whispering gallery (WG) optical resonances10, have been the subject of considerable interest, given their fast response time, scalability and in-plane emission11. These features make them attractive components for on-chip integration in optoelectronic devices. The fabrication of microdisks embedded with quantum dots12 has led to proposals of quantum computational schemes based on the mediation of interactions between distant QD spins coherently coupled through a single microdisk mode2. In this letter, we study the coupling between the microdisk emission and the localized spins in its active region, as a first step towards the realization of using light-matter information exchange for quantum information processing schemes in a solid-state system. Our samples are fabricated from GaAs/AlGaAs heterostructures grown by molecular beam epitaxy. Figure 1a (inset) is a scanning electron microscope (SEM) image of a representative microdisk with a diameter ~ 4 µm. The optically active region contains five 4.2 nm thick GaAs QWs, separated by 10 nm thick Al0.31Ga0.69As barriers. The total thickness of the disk is ~ 110 nm, ensuring that only the lowest order cavity modes are supported10. At each QW/barrier interface, growth interruptions of 2 minutes are introduced to induce monolayer fluctuations, leading to the formation of QDs. Control samples, consisting of disks of identical dimensions, are fabricated from heterostructures with the same design but with only 5 seconds of growth interruptions. Low temperature micro-photoluminescence measurements at low excitation power (P < 10 µW) show clear, resolution-limited spectral features (FWHM ~ 200 µeV) only in the former samples, confirming the presence of QDs in the active region13. At higher excitation powers both samples support WG resonant modes, but the Q-factor is consistently higher in the QD samples (Q ~ 5500) than in the control samples (Q ~ 2000).
3
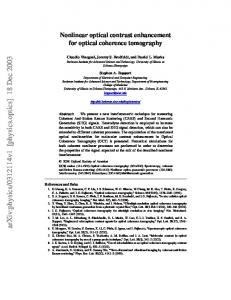
Spectroscopic and dynamic details of the stimulated emission at temperature T = 5.5 K from a microdisk with QDs are shown in Fig.1. A tunable, pulsed Ti:Sapphire laser, producing ~150 fs wide pulses at a repetition rate of 76 MHz, is tuned to 740 nm to optically pump the disks for photoluminescence (PL) measurements. The samples are mounted in an optical cryostat with a variable temperature insert and a 7 T superconducting magnet. The incident laser is focused to a spot ~ 30 µm in diameter at an angle of 45 degrees to the sample normal. The PL is collected perpendicular to the excitation direction in reflection geometry. The inter-disk distance is 50 µm, allowing us to address a single structure within the laser spot. At low incident power (P < 200 W/cm2) the emission is mostly spontaneous, with the beginnings of cavity coupling exhibited through the emergence of a few modes. With increasing power, one of these modes starts to dominate, and the spectrum shows resonant emission at 770 nm with a transparency Q = 5500. Figure 1a shows the PL emission of the mode at P =1.3 kW/cm2 and Fig. 1b, the contrast between the power dependence of the time-integrated intensities of the lasing mode and the spontaneous emission. A fit to the logarithmic plot of the mode output intensity as a function of input power14 indicates stimulated emission with a threshold of 450 W/cm2. Fig. 1c shows time-resolved PL traces of the spectrally-resolved lasing emission at different pump powers, taken with a streak camera (time resolution ~ 2 ps). Above the threshold power, the delay time, defined as the time interval between the arrival of the laser pulse (marked t = 0) and the maximum of the cavity emission, starts decreasing with increasing pump power, as shown in Fig. 1b. This is another indication of the onset of stimulated emission15. The decrease in the recombination time is a result of the Purcell effect16.
Time-resolved Kerr rotation (TRKR), an optical pump-probe spectroscopic technique17,18, is used to probe the electron spin dynamics in the cavities (in the Voigt geometry, detailed in Fig. S1a). A circularly-polarized pump pulse, incident on the sample surface, injects spin-polarized electrons, with the circular polarization being
4
modulated with a photoelastic modulator at 50 kHz for lock-in detection. The Kerr rotation angle of a linearly-polarized probe pulse (tuned to the same wavelength as the pump) applied after a time delay ∆t measures the projection of the electron spin magnetization as it precesses about the applied magnetic field. We extract a spin lifetime, T2*, from the exponentially decreasing envelope of the spin precession curve and the Larmor precession frequency, ωL, from the transverse oscillations (Fig. S1b). Figure 2a is a map of T2*, at T = 5.5 K with an applied magnetic field B = 4 T, as we vary both the pump wavelength (λ) and power (P). We immediately notice an anomaly near the lasing wavelength at λ = 770 nm. T2* first increases to 456 ps when P ~ 0.5 kW/cm2, and then decreases to 158 ps as P is increased to 1.5 kW/cm2. Such drastic variations in T2* are not observed at any other wavelengths, as shown further by the line-cuts taken at fixed λ (770 nm and 775 nm) and plotted in Fig. 2b. For comparison, we also plot T2* as a function of P for the unprocessed heterostructure (with QDs but no cavity) and for a resonant mode in a cavity in the control sample (no QDs). Neither of these shows a comparable variation of T2* with P as seen in the QD sample. While this is expected in the unprocessed heterostructure, the lack of resonant enhancement in the control sample may be attributed to the lower quality of the mode. A careful look at Fig. 2a reveals that the value of P where the increase in T2* occurs in the QD sample is very close to the threshold power for lasing in the disk. The lasing threshold is characterized by changes in various parameters, such as an increase in the mode output intensity, a decrease in the delay time, and a change of the mode Qfactor as the system crosses over from spontaneous to stimulated emission. Plotting Q of the resonant mode (obtained from PL) as a function of P in Fig. 2c shows an increase at the threshold and a subsequent decrease at higher powers. The qualitative variation of Q with P traces the evolution of the spin lifetime very well, revealing the possibility that T2* can be enhanced by engineering cavities with larger Q. Figure 2d shows the Larmor
5
frequency ωL in the QD sample at B = 4 T with λ = 770 nm and 775 nm (on and off resonance, respectively) as P is varied. It also increases at the resonant wavelength, over the same range in power as T2*. In addition to varying P, we may also vary the temperature to alter the lasing characteristics of the microdisk. In Fig. 3a we map out T2* as a function of P at different temperatures with the pump fixed at 770 nm. The modulations in T2* with P decrease with temperature, disappearing by T = 35 K, shown by the line-cuts at three different temperatures (Fig. 3b). In Fig. 3c we follow the change in T2* with temperature at P = 0.5 kW/cm2 (black) and once again, it agrees qualitatively with the variation of the mode Q-factor (red) with temperature; both decrease exponentially. Not only is the mode quality degraded, but the emission at 770 nm is no longer dominated by stimulated emission, evident in the sharp increase in the delay time around 35 K (Fig. 3d).
Due to the spectral overlap of the emission from the QWs and the QDs, it is not possible to unequivocally identify either as the sole source of the lasing emission in the disks. However, the samples with QDs have (a) consistently higher Q-factors, implying lower dissipation, and (b) shorter delay times, resulting from less carrier diffusion to the edges. This suggests the involvement of the QDs, which provide confinement of the carriers and hence prevent non-radiative recombination at the sidewalls, at least under conditions of “moderate” excitation and low temperature. As the pump power (temperature) increases, QD states saturate (depopulate) and recombination is favoured from QW states. The carriers not only diffuse to the sidewalls and recombine nonradiatively, but also begin to couple extensively to radial modes, which is borne out by the PL data13, where we see “mode hopping” – the lasing emission cascading to longer wavelengths by coupling to second and third order radial modes (which are far more dissipative, and consequently, have lower Q) as T and P increase.
6
In an attempt to reduce the losses at higher excitation powers and temperature, we designed and fabricated disks with a smaller diameter (~ 1.5 µm). Fig. 4a is an SEM image of such a disk. The chief advantage of these smaller disks is that the spectral width of the gain supports only one mode (the mode spacing of the WG modes is inversely proportional to the radius of the disk) and should, in principle, lead to reduced losses. PL emission from the disk consists of a single lasing mode at 776 nm, with a Qfactor that increases at low powers. However, in sharp contrast to larger disks, the Qfactor remains nearly constant at ~ 4500 over a large power range (Fig. 4c, red squares), showing no indication of mode quality degradation or emergence of higher order radial modes. The spin lifetime plotted in Fig. 4b, exhibits resonant enhancement at the lasing mode, and also does not decrease with increasing power, unlike in the larger disks. It persists until the pump power is quite high (2.2 kW/cm2). The line-cuts in Fig. 4c show T2* on- and off-resonance, and in the unprocessed heterostructure. T2* in the cavity once again follows the variation in mode Q-factor. The Larmor precession frequency ωL for two different pump wavelengths is shown in Fig. 4d, and it is found to be larger onresonance than off.
In summary, we have demonstrated the possibility of increasing spin lifetime at selective wavelengths in a cavity, by coupling to high-Q modes. This resonant enhancement would be of great interest in microdisks with embedded self-assembled quantum dots, for which very high Q values have been reported19. At this point, we do not have an explanation for the resonant increase in the spin lifetime or the Larmor precession frequency, although it is a clear indication of the existence of some form of coupling between the cavity emission and the carrier dynamics. However, our results show that we can engineer control over the cavity-spin coupling via microcavity designs that robustly enhance the spin lifetime by reducing mode degradation. Recent results have shown the possibility of creating entanglement between resonant states of optically coupled disks20, and of efficient read-out by fibre coupling to disks21. These
7
advancements taken together make these systems very promising candidates for quantum information processing.
‘Supplementary Information accompanies the paper on www.nature.com/nmat.’
The authors would like to acknowledge support from DARPA/QUIST and NSF, and thank E. L. Hu, R. J. Epstein and F. Meier for illuminating discussions.
Correspondence and requests for materials should be addressed to D. D. A. at
[email protected].
1
Vahala, K. J. Optical microcavities. Nature 424, 839-846 (2003).
2
Imamoglu, A., Awschalom, D. D., Burkard, G., DiVincenzo, D. P., Loss, D., Sherwin,
M., and Small, A. Quantum information processing using quantum dots spins and cavity QED. Phys. Rev. Lett. 83, 4204-4207 (1999). 3
Meier, F., and Awschalom, D. D. Spin-photon dynamics of quantum dots in two-mode
cavities. Phys. Rev. B, 70 205329-1-6 (2004). 4
Hallstein, S., Berger, J. D., Hilpert, M., Schneider, H., Ruhle, W. W., Jahnke, F.,
Koch, S. W., Gibbs, H. M., Khitrova, G., and Oestrich, M. Manifestation of coherent spin precession in stimulated semiconductor dynamics. Phys. Rev. B 56, R7076-R7079 (1997). 5
Lagoudakis, P., Savvidis, P. G., Baumberg, J. J., Whittaker, D. M., Eastham, P. R.,
Skolnick, M. S., and Roberts, J. S. Stimulated spin dynamics of polaritons in semiconductor microcavities. Phys. Rev. B 65, 161310-1/4 (2002). 6
Cubian, D.P., Haddad, M., Andre, R., Frey, R., Roosen, G., Diego, J. L. A., Flytzani,
C. Photoinduced magneto-optic Kerr effects in asymmetric semiconductor microcavities. Phys. Rev. B 67, 45308-1-8 (2003).
8
7
Martin, M. D., Aichmayr, G., Vina, L., and Andre, R. Polarization control of nonlinear
emission of semiconductor microcavities. Phys. Rev. Lett. 89, 077402-1/4 (2002). 8
Brunner, K., Abstreiter, G., Bohm, G., Trankle, G, and Weimann, G. Sharp-line
photoluminescence of excitons localized at GaAs/AlGaAs quantum well inhomogneities. Appl. Phys. Lett. 64, 3320-3323 (1994). 9
Purcell, E. M. Spontaneous emission probabilities at radio frequencies. Phys. Rev. 69,
681 (1946). 10
McCall, S. L., Levi, A. F. J., Slusher, R. E., Pearton, S. J., and Logan, R. A.
Whispering gallery mode microdisk lasers. Appl. Phys. Lett. 60, 289-91 (1992). 11
Baba, T., Inoshita, K., Sano, D., Nakagawa, A., and Nozaki, K. Microlasers based on
photonic crystal concept. Int. Soc. Opt. Eng. 5000, 8-15 (2003). 12
Young, D. K., Zhang, L., Awschalom, D. D. and Hu, E. L. Coherent coupling
dynamics in a quantum-dot microdisk laser. Phys. Rev. B. 66, 081307-1-4 (2002). 13
Wang, W. H., Ghosh, S., Mendoza, F. M., Li, X., Awschalom, D. D., and Samarth, N.
Static and dynamic spectroscopy of (Al,Ga)As/GaAs microdisk lasers with interface fluctuation quantum dots. Phys. Rev. B. 71, 155306-1-5 (2005). 14
Bjork, G., Karlsson, A., and Yamamoto, Y. Definition of a laser threshold. Phys. Rev.
A 50, 1675-80 (1994). 15
Luo, K. J., Xu, J. Y., Cao, H., Ma, Y., Chang, S. H., Ho, S. T., and Solomon, G. S.
Dynamics of GaAs/AlGaAs microdisk lasers. Appl. Phys. Lett. 77, 2304-2306 (2000). 16
Gayral, B., Gerard, J.-M., Sermage, B., Lemaitre, A. and Dupuis, C. Time-resolved
probing of the Purcell effect for InAs quantum boxes in GaAs microdisks. Appl. Phys. Lett. 78, 2828-2830 (2001).
9
17
Crooker, S. A., Awschalom, D. D., Baumberg, J. J., Flack, F., and Samarth, N.
Optical spin resonance and transverse spin relaxation in magnetic-semiconductor quantum wells. Phys. Rev. B 56, 7574-88 (1997). 18
Crooker, S. A., Awschalom, D. D., and Samarth, N. Time-resolved Faraday rotation
spectroscopy of spin dynamics in digital magnetic heterostructures. IEEE J. Select. Topics Quantum Electron. 1, 1082-92 (1995). 19
Michler, P., Kiraz, A., Zhang, L., Becher, C., Hu, E., and Imamoglu A. Laser
emission from quantum dots in microdisk structures. Appl. Phys. Lett. 77, 184-186 (2000). 20
Nakagawa, A., Satoru, I., and Baba, T. Photonic molecule laser composed of
GaInAsP microdisks. Appl. Phys. Lett. 86, 041112-1-3 (2005). 21
Srinivasan, K., Borselli, M., Johnson, T. J., Barclay, P. E., and Painter, O. Optical
loss and lasing characteristics of high-quality-factor AlGaAs microdisk resonators with embedded quantum dots. Appl. Phys. Lett. 86, 151105-1-3 (2005).
Figure 1 Static and dynamical characteristics of microdisks. a, Photoluminescent (PL) spectral emission from a disk (diameter ~ 4 µm) excited by a pulsed laser at 740 nm, exhibiting a resonant mode at 770 nm with Q ~ 4800. (inset) SEM image of a disk. b, Time-integrated intensity of the resonant emission (red) and the spontaneous emission (black triangles) as a function of pump power P. Fit to the mode intensity (red line) yields the lasing threshold. c, Timeresolved emission at 770 nm with varying pump power. The delay time decreases with increasing input power, starting at the threshold, as shown in b (black circles).
Figure S1 Time-resolved Kerr rotation. a, Set-up for time-resolved Kerr rotation. The circularlypolarized pump and linearly-polarized probe are incident along z, perpendicular to the magnetic field B along x. The time delay ∆t between the pump and the probe is varied to trace out the variation in the Kerr rotation angle θK. The sample geometry is the same as for the PL measurements. b, Time-resolved spin dynamics measured by Kerr rotation spectroscopy. The pump and probe are resonantly tuned to the cavity mode at 770 nm. The spin lifetime (T2*) varies non-monotonically with incident pump power (P). Figure 2 Resonantly enhanced spin coherence. a, Map of T2* as a function of pump wavelength (λ ) and power (P). Spin coherence is enhanced at the lasing mode at low pump powers, and decreases as the power increases. b, T2* as a function of pump power from line-cuts across a, illustrating the resonant coupling at 770 nm (black). A similar line cut at 775 nm (red), off-resonance, shows no such enhancement. T2* in the unprocessed heterostructure (open circles), as well as in a control sample (blue), both shown here at 770 nm, remain unchanged with P. c, Variations in T2* and the cavity Q-factor at 770 nm with pump power. d, The Larmor precession frequency, ωL, in the cavity, obtained from fits to spin precession data, as a function of P. For all the Kerr rotation measurements, the probe power is ~ 15 W/cm2. Figure 3 Temperature dependence. a, T2* as a function of temperature (T) and pump power (P) at the cavity resonance (770 nm). b, Line cuts across a, at T = 5, 20 and 30 K, showing the
resonant enhancement of T2* diminishing with increasing T. c, T2* (black, λ = 770 nm, P = 0.5 kW/cm2) decreases with T. Variation of the mode Q-factor (red), and of the delay time of disk emission (d), point to the decrease being related to the reduction of stimulated emission with increasing temperature. Lines in c are exponential fits.
Figure 4 Robust spin-coherence enhancement in smaller cavity. a, SEM image of microdisk with diameter ~ 1.5 µm. This reduced size causes the resonance wavelength to shift to 776 nm. b, T2* as a function of pump wavelength (λ ) and power (P). The resonant increase in T2* at 776 nm is robust to higher values of P. c, Line cuts across b for 776 nm (black) and 771 nm (blue) along with the power dependence of T2* in the unprocessed heterostructure (red circles) and of Q (red squares). d, ωL at 776 and 771 nm, showing a similar trend with P as T2*.
Pw = 1.3 kW/cm2
2
2 µm
Intensity (a.u.)
0.16 nm
b
6
770
780
50
0
c
1
2
P (kW/cm2) 0.03 kW/cm2 0.8 kW/cm2 1.8 kW/cm2
200
150
100
Wavelength (nm)
0
mode QW
0
0 760 Intensity (normalized)
Intensity (a.u.)
FWHM
T = 5.5 K
Delay time (ps)
a 1
12
400 Time (ps)
Figure 1
600
a B
∆t
sample
θK
pump
probe x z
probe B = 4 T, λ = 770 nm
KR (normalized)
b
P = 0.3 kW/cm2 T2* = 265 ps 0.5 kW/cm2 466 ps 1.5 kW/cm2 182 ps
0
200 400 Delay time (ps)
Figure S1
600
800
765
T2* (ps)
200
400
T = 5.5 K, B = 4 T
T2* (ps)
770
350 250 150
b 0.5
1.0
4.5
c
138 ωL (GHz)
T2* (ps)
770 nm 775 nm Control QW
770 nm 775 nm
135
132 d
1.5
P (kW/cm2)
0.5
1.0
P (kW/cm2)
Figure 2
5.5 5.0
300 200
a
775
λ = 770 nm
Q (× 1000)
λ (nm)
400
1.5
200
5
T2* (ps)
400
λ = 770 nm, B = 4 T 400
T2* (ps)
a
T2* (ps)
35 400
b
300 5K 20 K 30 K
0.5
300 Delay time (ps)
T (K)
25
200
5 4 3
c
2 2000
d
1000
0
1.0
1.5
10
20 T (K)
P (kW/cm2)
Figure 3
Q (× 1000)
15
30
40
T = 5.5 K, B = 4 T
a 1 µm
c
T2* (ps)
776 nm
150
100
4.0
771 nm
200
3.5
75
QW
b
d
115
773
ωL (GHz)
λ (nm)
771
T2* (ps)
d
775
110
776 nm 771 nm
777 0.5
1.0 P
1.5
2.0
4.5
0.5 1.0 1.5 2.0 P (kW/cm2)
(kW/cm2)
Figure 4
Q (× 1000)
225