Nov 10, 2010 - The adaptive web: methods and strategies of web personalization, 2007. [19] Y. Koren. ... BPC_BellKor.pdf, 2009. [20] W. Li, J. Han, and J. Pei.
Enhancing Group Recommendation by Incorporating Social Relationship Interactions Mike Gartrell1 , Xinyu Xing1 , Qin Lv1 , Aaron Beach1 , Richard Han1 , Shivakant Mishra1 , Karim Seada2 1 University of Colorado at Boulder, 2 Nokia Research Center Palo Alto {mike.gartrell, xinyu.xing}@colorado.edu
ABSTRACT Group recommendation, which makes recommendations to a group of users instead of individuals, has become increasingly important in both the workspace and people’s social activities, such as brainstorming sessions for coworkers and social TV for family members or friends. Group recommendation is a challenging problem due to the dynamics of group memberships and diversity of group members. Previous work focused mainly on the content interests of group members and ignored the social characteristics within a group, resulting in suboptimal group recommendation performance. In this work, we propose a group recommendation method that utilizes both social and content interests of group members. We study the key characteristics of groups and propose (1) a group consensus function that captures the social, expertise, and interest dissimilarity among multiple group members; and (2) a generic framework that automatically analyzes group characteristics and constructs the corresponding group consensus function. Detailed user studies of diverse groups demonstrate the effectiveness of the proposed techniques, and the importance of incorporating both social and content interests in group recommender systems.
Categories and Subject Descriptors H.5.3 [Group and Organization Interfaces]: Collaborative Computing; H.3.3 [Information Search and Retrieval]: Information Filtering
General Terms Algorithms, Design, Experimentation, Human Factors
1.
INTRODUCTION
We are quickly moving into a digital society. As more information is generated every day and more people become digitally connected, group recommender systems, which make suggestions to a group of people, have become increasingly important. Group recommendation can be targeted at very different scenarios, different groups and different types of
Permission to make digital or hard copies of all or part of this work for personal or classroom use is granted without fee provided that copies are not made or distributed for profit or commercial advantage and that copies bear this notice and the full citation on the first page. To copy otherwise, to republish, to post on servers or to redistribute to lists, requires prior specific permission and/or a fee. GROUP2010, November 7–10, 2010, Sanibel Island, Florida, USA. Copyright 2010 ACM 978-1-4503-0387-3/10/11 ...$10.00.
items. For instance, a group recommender system may be used to suggest TV programs to a family, movies to a group of friends, music at a social event, or brainstorming topics among coworkers. Effective group recommendation can therefore have a positive impact on both people’s work performance and social activities. Group recommendation is a challenging problem, due to the dynamics and diversity of groups. A group may be formed at any time by an arbitrary number of people with diverse interests, and the same person may participate in multiple groups of different nature, e.g., a coworker group vs. a family group. An effective group recommender system needs to capture not only the preferences of individual group members, but also the key factors in the group decision process, i.e., how a group of people reaches a consensus. The problem of individual-based recommendation has been extensively studied and a number of techniques have been proposed [5, 26, 21, 12, 19]. More recently, researchers have started investigating the problem of group recommendation [25, 8, 35, 11, 33, 30, 13, 18]. They propose solutions that either create a “pseudo-user” profile for each group, or merge the recommendation lists of individual users at runtime using different group decision strategies, such as average satisfaction, minimum misery, or maximum satisfaction. The dissimilarity among group members has also been studied [8]. These techniques focus mainly on the content interests of group members and do not consider the social relationships among group members. Given a group of people with diverse interests, to make a decision on which item(s) (e.g., movie, TV program, restaurant) to choose, we need to consider not only the dissimilarity among the group members, but more importantly, the weights (i.e., importance or influence) of individual members within this group. Instead of assuming equal weights of all the members, we want to identify members who are more influential and can “persuade” others to agree with him/her. In other words, the social characteristics of a group and its members play an important role in the group decision process. For example, intuition suggests that a more uniform or equal social group would tend to make democratic decisions, i.e., maximizing average satisfaction, while a group of strangers with weak social ties would, out of politeness, try to avoid choosing items that are disliked by at least one of the members, i.e., minimizing maximum misery. To capture these types of influences, in this work, we propose a group recommendation solution that incorporates both social and content interest information to generate consensus among a group (the group consensus function), thereby identifying items that are most suitable for a group. Our work makes the following contributions:
• A detailed analysis of key group characteristics and their impacts on the group decision making process; • A novel group consensus function that integrates social, expertise, and interest dissimilarity of group members; • A generic framework that automatically analyzes group characteristics and generates the corresponding group consensus function; and • A detailed evaluation of our work using data collected from real-world user groups with diverse social and interest characteristics. The rest of the paper is organized as follows. We survey related work in Section 2. Section 3 gives an overview of the group recommender system and discusses the three most common group decision making strategies. Section 4 discusses the group characteristics that impact the group decision process, presents in detail the proposed group consensus function, and describes the framework for automatically analyzing groups and generating the corresponding group consensus function. Section 5 discusses the user studies we have conducted and performance of the proposed techniques. Finally, Section 6 concludes the paper and discusses some of our future work.
2.
RELATED WORK
In this work, we investigate the problem of group recommendation and propose consensus functions that integrate both content and social characteristics of group members. This work is closely related to recommender systems in general and in particular, group-based recommendation. Recommender systems have been an area of active research since the mid-1990s [27, 17, 29, 16, 5]. A number of recommendation techniques have been proposed, ranging from content-based similarity analysis, to collaborative filtering and hybrid recommendation techniques. These techniques target various real-world recommendation needs, such as identifying interesting web sites [26], Amazon’s product recommendation [21], Google’s news personalization [12], and Netflix’s movie recommendation [19]. The work by Liu and Maes [23] also considers individual users’ social network profiles and uses an interest map to identify interconnecting interests and identities for recommendation. All these techniques focus on making recommendations for individual users and do not consider the problem of group recommendation. This line of research is complementary to our work, and state-of-the-art recommendation techniques for individual users can be easily integrated into our solution. The problem of group recommendation has also been investigated recently [25, 8, 35, 11, 33, 30, 13, 18]. Various techniques have been proposed, targeting different types of recommendation items (e.g., movie, TV program, music) and different groups (e.g., family, friends, dynamic social groups). For instance, the PartyVote [30] system provides a simple democratic mechanism for selecting and playing music at social events, i.e., each group member is guaranteed to have at least one of his/her preferred songs played. This mechanism is not practical when only one or a few items can be recommended, e.g., movies or TV programs. Vildjiounaite et al. present a family-based TV program recommender system that makes recommendations based on the view history of each household, instead of combining the TV preferences of individual family members [33]. This method
assumes static family groups and does not work for dynamic groups, e.g., just parents or a random social group. Most group recommendation techniques consider the preferences of individual users and propose different strategies to either combine the individual user profiles into a single group profile (i.e., a pseudo user) and make recommendations for the pseudo user, or generate recommendation lists for individual group members and merge the lists for group recommendation. Jameson and Smyth summarize three main strategies for merging individual recommendations: average satisfaction, minimum misery, and maximum satisfaction [18]. Average satisfaction, which assumes equal importance across all group members, is used in several group recommender systems [36, 35, 11]. Besides using the average satisfaction strategy, Berkovsky et al. suggest using different weights (e.g., weights of family members) in the aggregation models [10]. However, we are not aware if the weight-based strategy has been investigated. Other studies have compared the three aggregation strategies [13, 24, 8]. Based on a user study of two 3-member groups, Masthoff suggests that both average satisfaction and minimum misery are plausible candidates for group decisions. Recent work by Amer-Yahia et al. propose a consensus function that utilizes not only the average satisfaction and minimum misery strategies, but also the dissimilarity among group members [8]. However, the consensus function does not take other factors that may affect a group decision into consideration. O’Connor et al. have developed PolyLens, a groupbased movie recommender [25]. While the PolyLens system targets small, private, and persistent groups, they have also investigated several group characteristics, including the nature of groups, rights of group members, social value functions, and interfaces for displaying group recommendations. To the best of our knowledge, this is the first work that formally utilizes both social and content interests for the group consensus function and group recommender systems.
3.
OVERVIEW
In this section, we first present the architectural design of our group recommender system, highlighting the role of the group consensus function. Next, we review the most common group decision making strategies. Based on our analysis of group characteristics and how they impact the group decision making process as described in Section 4.1, we then propose a new group consensus function in Section 4.2 and a generic framework for automatic generation of group consensus functions in Section 4.3.
3.1
Group Recommender System Architecture
Group recommender systems are usually designed using one of two architectures. In the first architecture, a “pseudo user” profile is generated from all group members, and an individual-based recommender system is then used at runtime to generate recommendations for the “pseudo user”, i.e., the group. This approach generally has good efficiency but does not work well for dynamic groups. In the second architecture, an individual-based recommender system is first used to generate recommendations for each group member, then a group consensus function is used to merge the individual recommendations and select ones that are most suitable for the whole group. In this work we adopt the second architecture, as shown in Figure 1), i.e., individual-based recommendation plus group consensus function. By considering the recommendations for individual group members and merging them at run-
? ? Group
. . .
. . .
Our focus Individual Recommender System
f (x)
. . .
? Group members
Unrated movies for each group member
Consensus Function
Predicted group rating
Predicted ratings for each group member Group Descriptors
Figure 1: Group recommender system architecture. time to generate group recommendations, this group recommender system architecture can easily accommodate dynamic groups and tailor its recommendations for each specific scenarios. In addition, the use of group consensus function makes it easy to incorporate various group characteristics that can potentially impact the group decision process. In this group recommender system architecture, our work focuses on the design of the group consensus function. Various individual-based recommender systems can be easily adopted into our architecture.
Maximum Satisfaction: In some scenarios, a group may choose to rate an item using the highest rating among its group members. This happens when one or a few group members really like an item and the remaining group members either agree or have reasonable satisfaction. As shown in Table 3, Tom is highly interested in the Harry Potter movies and these movies are acceptable for Mike. Therefore, the final decision of the group may reflect the highest rating within the group:
3.2
While the three group decision strategies described above are most commonly used, none of them is dominant across all groups [24]. It is unclear which group decision strategy should be applied under what specific group characteristics. Next, we analyze in detail the different group characteristics and how they lead to different group consensus functions.
Group Decision Strategies
Over the past decades, a variety of group decision strategies have been devised. One of the key purposes of investigating group decision strategies is to understand how a group of individuals reach a consensus, i.e., given individual preferences for an item, how does the group come up with a decision for the item? To illustrate this, we review the three most common group decision strategies, including average satisfaction, minimum misery, and maximum satisfaction. Average Satisfaction: The most straightforward group decision strategy is to assume equal importance among all group members and compute the average satisfaction of the whole group for any given item. Let n be the number of users in a group, ri,j be the rating of user j for item i, then the group rating for item i is computed as follows: Pn j=1 ri,j GRi = average(ri,j ) = (1) n Table 1 illustrates an example where the group preference for two different types of movies is consistent with the average satisfaction (rating) of its group members. Minimum Misery: Computing the average satisfaction within a group, though simple and straightforward, may not always be desirable. This happens when one or a few members really dislike an item, but their low ratings for this item may be averaged out by higher ratings by other group members. For example, Mike and Tom gave very different ratings to two horror movies (see Table 2). Tom really dislikes horror movies and gave these two movies the lowest 1-star rating, whereas these two horror movies are acceptable for Mike. To please the least happy member (i.e., Tom in our example), the final decision of the group is to rate each movie using the movie’s lowest rating among its group members, i.e., minimum misery: GRi = min(ri,j )
(2)
GRi = max(ri,j )
4.
(3)
SYSTEM DESCRIPTION
Based on the group recommender system architecture and the three base group decision strategies, we propose a group recommendation solution that fills the gap between specific group characteristics and the dominant group decision strategy. Specifically, our solution consists of three key components: (a) group descriptors that capture social, expertise, and dissimilarity information of a group; (b) a heuristicbased group consensus function; and (c) a rule-based generic framework that automatically generates the most suitable group consensus function for a group.
4.1
Group Descriptors
As discussed above, different group decision strategies may be used, such as average satisfaction, minimum misery, and maximum satisfaction. However, groups are diverse in nature and no single group decision strategy works best for all groups. To address this issue, we need to identify the inherent characteristics of different groups and determine their specific impacts on the group decision process. In this work, we investigate three crucial factors that may affect a group’s decision and quantify these three factors as the following group descriptors: social descriptor, expertise descriptor, and dissimilarity descriptor. Social Descriptor: We first investigate how the social factor affects a group’s decision. A group consists of two or more individuals who are either directly or indirectly connected to each other by some social relationships. Since they interact with and influence each other, the group decision is
The Matrix Star Wars
Tom 3 4
Mike 5 4
G. 4 4
The Shining Drag Me to Hell
Table 1: Average satisfaction
Forrest Gump Big Fish
Tom 5 4
Nicole 3 2
Table 4: Strong social ties
Tom 1 1
Mike 4 3
G. 1 1
Harry Potter I Harry Potter II
Table 2: Minimum misery G. 5 4
Forrest Gump Big Fish
Tom 5 4
John 3 2
where |G| is the size (number of members) of group G and wi,j is the social level between group members i and j. Note that the social level is defined as zero if a pair of group members do not know each other. Consider the example of a wedding ceremony where the groom’s friends may not know the bride’s friends in advance. In this case, it is reasonable to consider their social levels to be zero. Expertise Descriptor: In addition to social relationship, another important factor that may affect a group’s decision is the expertise of group members. To reach a consensus, the group decision process usually involves mild or 1 The examples used in this paper are based on real-world users, but user names are anonymized to protect privacy.
Mike 4 3
G. 5 5
Table 3: Maximum satisfaction
G. 4 3
The Godfather Goodfellas
Jack 5 5
Bob 2 2
G. 5 4
Table 6: Expertise dominant
Table 5: Weak social ties
affected by the strength of the social relationships. To illustrate this, let us consider the following examples. Suppose a couple – Nicole and Tom1 – want to select a movie to watch together. The movie preferences for each of them and the movie preferences for the couple (group) are listed in Table 4. An interesting observation is that the couple’s final decision matches perfectly with the decision generated by the maximum satisfaction strategy. Table 5 shows a different example. In this case, two acquaintances – Tom and John – have the same movie preferences as the couple. However, the final decision that the acquaintances make is more likely to correspond with the final decision generated by the average satisfaction strategy. Intuitively, the difference between the two groups is the strength of their social relationships. Consequently, we believe that the social relationship strength of a group should be taken into consideration in the group decision process. The social descriptor is devised to measure the social relationship strength of a group. Intuitively, a husband-andwife family group usually has tighter and stronger social relationship than a group of people who are merely acquaintances. For a two-member group, its social relationship can be easily defined as the strength of the pairwise social link between the two members. In order to quantify the social relationship strength of the pairwise member social link, we categorize the social relationship strength into five different contact levels based on the average daily contact frequency between two members. These contact levels are shown in Table 7. For example, the social strength of a family that consists of a husband and wife is usually perfectly suitable for level 5 because they meet each other almost daily, while a faculty member and his Ph.D. student may fit level 2 if they have regular meetings twice a week. To measure the social relationship strength of a group with any number of members (at least two), we extend the two-member social measure and define the social group descriptor as follows: P 2 · 1≤i 0.8 V
Table 7: Categorization of social levels based on daily contact frequency. Percentage of movies watched Expertise Level
< 20% I
20% ∼ 40% II
40% ∼ 60% III
60% ∼ 80% IV
> 80% V
Table 8: Categorization of expertise levels based on percentage of movies watched. expertise belongs to the fourth level (60% – 80% of movies has been watched). Recall that the expertise descriptor is intended to measure the relative expertise of different group members. Therefore, we utilize the following equation to normalize the expertise levels into the range from 0 to 1: ei Ei (G) = P|G|
j=1
ej
(5)
where Ei (G) is the normalized relative expertise level of group member i in group G, and ej is the absolute expertise level of each group member j. Clearly, the sum of the relative expertise levels of a group equals to 1. Dissimilarity Descriptor: Dissimilarity also influences the final decision of a group. As suggested by Amer-Yahia et al. [8], dissimilarity should be considered in the context of a group decision strategy because dissimilarity describes the disagreement between any two group members. Intuitively, the closer the preference for an item between two members, the lower their disagreement for the item. In this work, we therefore devise the dissimilarity descriptor to measure the preference difference among a group. Here we use two metrics, average pairwise dissimilarity (APD) and variance dissimilarity (VD), to describe preference difference. Given a group G and an item x, we define average pairwise dissimilarity as AP Dx (G) =
X 2 · |ri,x − rj,x |, |G| · (|G| − 1)
(6)
∀i,j∈G
where |G| is the number of members in group G, and ri,x and rj,x denote item x’s ratings given by group members i and j, respectively. Notice that i 6= j. As we can see, AP Dx (G) measures the average difference of any two group members’ ratings for item x. For example, Table 4 and 5 show that Tom, Nicole, and John’s ratings for the movie Forrest Gump are 5, 3, and 3. Using the average pairwise dissimilarity metric, the dissimilarity descriptors for this movie and the 3-member group has a value of 1.333. Another metric for the dissimilarity descriptor is variance dissimilarity, defined as V Dx (G) =
X 1 · (ri,x − avgx )2 |G|
(7)
∀i∈G
where |G| is the number of members in group G, ri,x is group member i’s rating for item x, and avgx is the mean of all individual members’ ratings for item x. This metric computes the mathematical variance of the preferences for the item among group members. Let us return to the example of Tom, Nicole, and John (see Table 4 and 5). Using the variance dissimilarity metric, we compute the dissimilarity descriptors for the first movie, which equals to 0.889. Note that the two different dissimilarity metrics usually result in different values.
4.2
A Heuristic Group Consensus Function
As discussed in Section 4.1, to choose the appropriate group decision strategy, we should take the three factors – social factor, expertise factor and dissimilarity factor – into consideration. Here we propose a heuristic group consensus function that incorporates all three factors in order to generate the final group rating for a given group and a given item. Recall the social descriptor is used to identify the social relationship strength of a group. Our observations of group dynamics suggest that when the social relationship strength is strong and tight, the final decision that a group makes tends to reflect the maximum satisfaction of the group members. When the social descriptor value is low (i.e., weak social ties), the final decision that a group makes tends to follow the average satisfaction or minimum misery strategies. Unlike the social relationship descriptor, the expertise descriptor is mainly used to apply a weight to each of the group members. A group member with more expertise, and thus more influence, receives a higher weight than other group members with less expertise. The dissimilarity descriptor mainly accounts for the fact that group members may not always have the same tastes. Our experiments suggest that when a disagreement occurs in a group, the final decision that a group makes reflects the level at which group members disagree with each other. Considering the three group factors collectively, we combine these three descriptors into a heuristic group consensus function that uses the three most common group decision strategies. Equation 8 quantifies the group decision strategy. GRx = w1 · avg(Ei · ri,x ) + w2 · (1 − disx ), if β < S < α GRx = w1 · max(Ei · ri,x ) + w2 · (1 − disx ), if S > α GR = w · min(E · r ) + w · (1 − dis ), if S < β x 1 i i,x 2 x (8) where disx represents the dissimilarity descriptors, which can be either average pairwise dissimilarity or variance dissimilarity. w1 and w2 denote the relative importance of preference and dissimilarity in the final decision, w1 + w2 = 1. α and β are the thresholds that are used to identify the social relationship strength. As indicated in Equation 8, we harness the social relationship strength to choose the group decision strategy. Different social relationship strengths mean that a group makes its decision using different decision functions – average satisfaction, minimum misery or maximum satisfaction. According to our experience, we assign the threshold values for social relationship strength – α and β – 0.67 and 0.33 respectively. In addition, Equation 8 also incorporates expertise weights (Ei ) into each of the individual ratings (ri,x ), and utilizes two parameters to adjust the disagreement. Here, these two values for w1 and w2 (0.8 and 0.2, respectively) are chosen after observing the data that we have collected from our user studies. An evaluation of this equation is presented in Section 5.
4.3
Rule-Based Group Consensus Framework
While our results show that our heuristic group consensus function works well, it is developed based on the specific cases we have observed. Ideally, we would like to develop a more general technique that would be applicable not only for example to movies, but also to other data items and groups. Accordingly, we have designed a generic framework that automatically analyzes group characteristics and generates the corresponding group consensus function to predict group preferences. The basis for the design of this framework is associative classification [20, 22]. In data mining and machine learning, classification involves the construction of a model or classifier to predict categorical labels for data, such as “good” or “bad”. We cast the group movie recommendation task as a classification task, where the goal is to predict a group movie rating of 1, 2, 3, 4, or 5. Associative classification uses association rules to perform classification. The following provides background on association rules and describes our general framework that uses association rules to generate appropriate consensus functions for any group. Our framework generates association rules by mining the training data set (e.g., from user studies). Association rule mining is a popular method for discovering interesting relations or patterns between variables in a dataset [6, 7]. For example, if two group members individually rate a movie with a rating of four, then this group of two also tends to agree on a group rating for four for this movie. This pattern can be represented as the following association rule: {minRating = 4}∧{maxRating = 4} ⇒ {groupRating = 4} (9) To identify association rules, we must first search for frequent itemsets in the dataset. For example, in the case of a transaction dataset for a supermarket, a set of items, such as bread and butter, that appear frequently together in the dataset is a frequent itemset. In the simplified group movie rating example above, {minRating = 4}, {maxRating = 4}, and {groupRating = 4} would be a frequent itemset. One well-accepted algorithm for mining frequent itemsets is FP-growth [15]. FP-growth has been shown to be an efficient and scalable method for mining both long and short frequent itemsets. After finding frequent itemsets, we generate strong association rules from these frequent itemsets. These strong association rules must satisfy minimum values for support and confidence. The support of an association rule is defined as the percentage of transactions in the dataset containing all of the items in the rule. The confidence of an association rule is defined as the percentage of transactions in the dataset, containing the items in the rule, for which the rule is correct. More formally, for the rule A ⇒ B, support(A ⇒ B) = P (A ∪ B) conf idence(A ⇒ B) = P (B|A) =
support(A ∪ B) support(A)
(10)
Input: Dataset containing attributes and values for these attributes Output: Associative classification rules 1 begin 2 for attribute ∈ dataset do 3 discretizedAttributes.add(discretize(attribute)) 4 end 5 for attribute ∈ discretizedAttributes do 6 newAttribute = N ominalT oBinominal(attribute) binomialAttributes.add(newAttribute) 7 end 8 f requentP atterns = F P Growth(binomialAttributes); 9 associationRules = AssociationRuleGenerator(f requentP atterns); 10 for associationRule ∈ associationRules do 11 lhs = associationRule.lhs(); 12 classif ierRules.add(associationRule); 13 if classif ierRules.lhsM atch(lhs) then 14 classif ierRules.removeLowestConf idence(lhs) 15 end 16 end 17 end Algorithm 1: Construct associative classification rules
rating. We define expertise as an estimate of the number of movies a group member has previously watched. The expert member identifier is the identifier for the group member with the highest expertise. Average pairwise expertise dissimilarity is defined as P i,j∈G |eG,i − eG,j | (12) EG,dissim = |P airs(G)| and average pairwise preference dissimilarity for item x is defined as P i,j∈G |rx,G,i − rx,G,j | rx,G,dissim = (13) |P airs(G)| where eG,i and rx,G,i are the expertise and movie ratings values, respectively for group member i, and |P airs(G)| is the number of pairs of members (users) in group G. After defining these attributes, we use FP-growth to identify frequent itemsets in the data. Since FP-growth can only handle binomial (binary) attributes, we must discretize the numeric attributes in our data [32]. These numeric attributes are discretized using user-specified binning strategies for each attribute. For example, the minimum expertise attribute is discretized into the following bins: low : minExpertise(0 . . . 0.249) low − med : minExpertise(0.25 . . . 0.49)
(11)
The following describes Algorithm 1, which we use to mine association rules from the dataset obtained from our user studies. First, we define meaningful attributes (items) in our data set. Based on our experience with the user studies, we identify the following attributes: social strength (S), maximum group member rating, minimum group member rating, average group member rating, standard deviation of member ratings, average pairwise preference dissimilarity, average pairwise expertise dissimilarity, minimum expertise, maximum expertise, expert member identifier, and group
(14)
med : minExpertise(0.5 . . . 0.749) high : minExpertise(0.75 . . . 1.0) Next, we generate quantitative association rules from these frequent predicate sets. Using the strong association rules mined from our data, we write classification heuristics that compute predicted group ratings for a movie given the individual group member ratings for that movie. These heuristics organize the rules in order of decreasing precedence based on their confidence and support, which is similar to the approach used in the CBA (Classification-Based Association) algorithm [22]. If a new rule has the same antecedent
(left-hand side) as another rule already in the classifier, then the rule with lowest confidence for the antecedent is removed from the classifier. When predicting a group movie rating by classifying a new data item, the first rule satisfying the item is used to classify it. Intuitively, these heuristics capture how groups make decisions about which movie to watch based on the attributes indicated previously.
5.
EVALUATIONS
In this section, we evaluate the proposed group recommender system using real-world group-based user studies. Our goal is to evaluate the effectiveness of the social, expertise, and dissimilarity group descriptors, and the quality of both the heuristic-based group consensus function and the rule-based generic framework for group consensus.
5.1
Participants and Groups
From 2009 to 2010, we have recruited 10 groups (32 individuals) to participate in our user studies. All participants are college or graduate students with an approximate average age of 28. For each group, individual group members are asked to describe his or her social relationships with other members in the group. The social relationships between two peers mainly contain the following four types of relationships: couple, close friends, acquaintances and first acquaintances. The strength of these four social relationships are sequentially decreasing. Additionally, in order to quantify the strength of their social relationship, each of the participants is asked to provide his or her contact frequency with other group members (i.e., how frequently the participant interacts with other group members). Based on these reported social relationships, we categorize the 10 groups into four different types: four couple groups (with two members per group), two close-friend groups (three members per group), three acquaintance groups (two members per group) and one first-acquaintance group with 12 members. We believe the composition of our groups is representative of many scenarios in the real world. Typically, a firstacquaintance group is fairly large, such as a group in college student orientation in which group members do not know each other very well. On the other hand, groups with strong relationships are usually relatively small, since it is difficult for all group members to know each other in a large group. For example, at a party some people may know a majority of their fellow partygoers, whereas others may not. Though our user studies can represent many groups in the real world, there are a few cases that we have not investigated, such as a very large group where classmates know each other to varying degrees (e.g. a big high school class). We plan to continue investigating more diverse groups, including very large groups.
5.2
Experimental Methodology
The goal of our user studies is to collect information regarding social relationships, movie preferences, and expertise levels for the members of each group and then utilize this data to evaluate the performance of our proposed group consensus functions. To obtain the movie preferences and expertise levels of each participant, we selected 20 movies out of the top 250 popular movies from IMDB [4]. For our study, it is impractical to select the 20 movies from the pool randomly, since random selection may give rise to a situation in which the selected movies may all belong to a small set of genres. For example, the 20 selected movies may belong to only two genres – horror and science fiction. In this case,
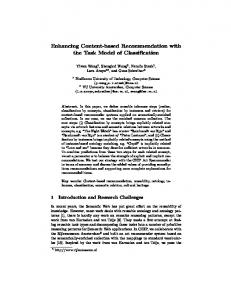
Figure 5: Still frame from 12-person group user study, showing group members discussing their opinions about a movie. the expertise levels that we collect from our participants may contain a strong bias, since it is possible that some participants are big fans of horror movies or science-fiction movies and have watched a lot of movies in these genres, but they cannot be considered as movie experts in all movie genres. To avoid this potential bias, we select the movies used for our user study across 10 different movie genres including Action, Comedy, Crime, Family, Horror, Science Fiction, Thriller, Romance and War. In our study, each movie genre contains two movies. Asking each participant to view all 20 movies and provide ratings for each movie is impractical. Instead, we ask each participant to watch the trailers of these 20 movies, because each trailer is usually 2∼3 minutes long. A previous study has indicated that using movie trailers to capture people’s preferences is realistic and efficient [31]. All participants are instructed to provide ratings on a scale of 1 to 5 (1 being the worst and 5 being the most favorite) for these 20 movie trailers according to their movie preferences. In addition, for the purpose of expertise information collection, we ask participants to identify those movies that they have previously watched. Since the study is conducted in an independent environment (i.e., making personal decision without discussion and interruption), we believe that the ratings that each participant provides for us correctly represent the movie preferences of the participant. After we collect the movie preferences of each participant, the participants are asked to return to their groups and begin discussion about these 20 movie trailers. The purpose of this discussion is to provide group ratings for the movies. Intuitively, group ratings are quite diverse and may not have correlations with each group member, regardless of the size of the group (see Figure 3). Both the group ratings from the 10 groups and the participants’ individual ratings are used for verifying our group consensus functions. Figure 5 shows a video still frame from our 12-person user study. This still frame was captured soon after the group had finished watching a movie trailer and provided their individual ratings, and shows the group members discussing their opinions about the movie.
5.3 5.3.1
Experimental Results Evaluation Measures
In the context of prediction, Root Mean Square Error (RMSE) is a widely used evaluation metric. RMSE mea-
5
4
4
Movie Rating
Movie Rating
5
3 2 1
User 1
User 2
Group
3 2 1
0 1 2 3 4 5 6 7 8 9 10 11 12 13 14 15 16 17 18 19 20 Movie ID
User 1
User 2
Group
0 1 2 3 4 5 6 7 8 9 10 11 12 13 14 15 16 17 18 19 20 Movie ID
Figure 3: Individual ratings vs. group rating in a regular group.
Figure 4: Individual ratings vs. group rating in an expertise-based group.
sures the differences between values predicted by a model and the values actually observed from the process or entity being modeled. It is generally accepted as a good measure of precision. In our setting, we are interested in the precision of our prediction with respect to movie ratings provided by a given group. RMSE can be formalized as follows: Given two vectors, where the first vector contains the actual group ratings for n movies, called ground truth, GT = [r1 , r2 , ..., rn ], and the second vector contains predicted group ratings for n movies, P R = [r10 , r20 , ..., rn0 ], RMSE is calculated by the following equation r Pn 0 2 i=1 (ri − ri ) (15) RM SE = n
initially compute the Pearson product-moment correlation coefficient between each group member’s ratings and group ratings. In this case, the correlation coefficient between user 1’s ratings and the group’s ratings is equal to 0.9388 (highly correlated), and the correlation coefficient between the other group member’s ratings and the group’s ratings is 0.1320 (low correlation). These results indicate that user 1’s decisions are highly correlated with the group’s final decisions, while user 2’s decisions are weakly correlated. Therefore, we conclude that the final decision of this group is strongly dominated by user 1. To better understand why the preferences of user 2 carry less weight than user 1’s preferences in the group decision process, we further investigate the movie expertise of each group member. According to the expertise information that the two members have provided – 17 watched movies out of the 20 movies (for user 1) vs. 7 watched movies out of the 20 movies (for user 2) – we observe that the expertise of the group members clearly has a significant impact on the group decision. This effect is apparent in many groups that participated in our user studies. Next, we investigate how social relationships can affect a group’s decision. To examine the impact of social relationships, we select three different groups: a couple group2 , an acquaintance group, and a first-acquaintance group. These groups are selected based on the varying social relationship strengths present in these groups. Intuitively, the social relationship strength of these groups follows a descending trend (i.e., based on social relationship strength, couple group > acquaintance group > first-acquaintance group). Furthermore, the three groups that we select all claim similar member expertise within a group, thus the expertise factor does not have impact on the group decision process. To understand how social relationship affects a group’s decision, we use three of the most common group decision strategies, average satisfaction, minimum misery, and maximum satisfaction, to predict the group decision, and then compare the predicted ratings with the actual group ratings (ground truth) by computing the Pearson correlation coefficient between each prediction and the ground truth. For the couple group, the computed Pearson correlation values of the three decision strategies are 0.7393 (average satisfaction), 0.8324 (maximum satisfaction) and 0.4866 (minimum misery). As we can see from these results, of the three decision strategies, the group rating predicted by maximum satisfaction has the highest correlation with the actual group decision. Therefore, we conclude that the maximum satis-
When the predicted group ratings are very close to the actual group ratings, the value of ri − ri0 is close to zero, and the RMSE is also close to zero. Therefore, smaller RMSE values indicate better predictions. One other measure we use for evaluation is Pearson productmoment correlation coefficient [28] , which measures the correlation between two variables X and Y . Pn i=1 (Xi − X) · (Yi − Y ) corr = , (16) (n − 1) · σX · σY where σX and σY are standard deviation of variable X and Y , respectively. A value close to 1.0 indicates strong positive correlation between the two variables; a value close to -1.0 indicates strong negative correlation, and a value close to 0 indicates low correlation. Therefore, we harness the Pearson correlation coefficient to investigate which group members or characteristics dominate a group’s decision.
5.3.2
Analysis of Evaluation Results
The purpose of our real-world user study based experiments is to help us to answer the following questions: (1) Is the group decision process affected by the group’s social and expertise characteristics? (2) Is there a general group consensus function (i.e., group decision model) that can capture the group behaviors? (3) If there is a group consensus function that captures group behaviors, can it be applied to all groups or a majority of groups? (4) How well do our heuristic-based and rule-based group decision models, or consensus functions, perform in comparison to a state-of-the-art group decision model [8]? We first evaluate the impact of members’ expertise on a group’s decision. Figure 4 shows, for a two-member group in our study, individual members’ ratings and group ratings for the 20 movies we have selected. To examine how an expert in the group dominates the group’s final decision, we
2
Since the couple group and close-friend group have the same behaviors and social relationship strength, we believe that couple group can also represent the close friend group, and thus we only consider the couple group.
2.4
Avg. Pairwise Diss. (PD) Var. Diss. (VD) Heuristic PD
RMSE
2 1.6
Heuristic VD Rule-based
1.2 0.8 0.4 0
G
G
G
G
G
G
G
G
G
G
10
9
8
7
6
5
4
3
2
1
Group ID
Figure 6: RMSE comparison of different group consensus functions across 10 different user groups.
Mean Stdev
Avg. Pairwise Diss. (PD) 0.8730 0.3528
Var. Diss. (VD) 0.9149 0.3695
Heuristic PD 0.5847 0.1775
Heuristic VD 0.5866 0.1706
Rule-based 0.7216 0.4336
Table 9: Aggregated RMSE (mean and standard deviation) comparison of different group consensus functions. faction strategy captures the group decision of the couple group relatively well. Similar to the couple group, the acquaintance group also consists of two group members. In contrast to the couple group, the members in the acquaintance group have a weaker social relationship. Furthermore, the values of the Pearson correlations for the acquaintance group also differ from the values for the couple group. For the acquaintance group, the values of Pearson correlation are 0.9290 (average satisfaction), 0.8386 (maximum satisfaction), and 0.8693 (minimum misery). We observe that the performance of the average satisfaction strategy exceeds the other two strategies. Finally, we also compute the Pearson correlation values for the first-acquaintance group, which consists of 12 group members. The Pearson correlation values for this group are 0.5927 (average satisfaction), 0.1808 (most satisfaction), and 0.9485 (minimum misery). In this case, the best decision strategy is the minimum misery strategy. Observing the three groups and the variation in their Pearson correlation values, we conclude that a decrease in the social relationship strength results in a variation in group decision strategy. Based on the data from our user studies, we conclude that a group with a strong social relationship tends to maximize the satisfaction of a user in the group, while a group with a weak social relationship tends to minimize the misery of a user in the group. We next investigate whether our heuristic group consensus function that combines the social, expertise, and dissimilarity descriptors (described in Section 4.2) can accurately predict a group’s decision. Here we use a state-of-the-art group decision model [8] as the baseline for comparison with our group consensus functions. To make the comparison we compute each group’s RMSE between the predicted ratings and the actual group ratings (see Figure 6), as well as the average RMSE of the 10 groups in our user studies (see Table 9). As shown in Table 9, the 2nd and 3rd columns represent the baseline (i.e., group decision prediction using the two consensus functions introduced in [8]), the 4th and 5th columns represent the group decision predicted using our heuristic functions that use either pairwise dissimilarity (PD) or variance dissimilarity (VD), and the last column is the group decision predicted using our associative classifier (called “rule-based” in the table). As shown in Table 9, in comparison with the baseline functions, our heuristic group consensus functions provides approximately
33% ∼ 35% improvement and our rule-based group decision strategy provides 17% ∼ 21% improvement in comparison with the baseline. Consequently, we believe our group consensus functions more efficiently and precisely capture group behaviors and predict group decisions. Although our group consensus functions show great improvement in terms of overall prediction precision, Figure 6 indicates that the improvement is not present for all groups. As shown in Figure 6, we can observe that for Group 3, Group 8, and Group 10, our association rule-based consensus function has a higher RMSE than the baseline. In contrast, the heuristic group decision strategy shows optimal prediction precision in all 10 groups. The primary reason behind this is that the rule-based function is designed using an associative classification method which needs a sufficiently representative training dataset. Our 10-group user studies may not provide sufficient data to train our associative classifier such that it provides accurate predictions for all groups. We believe that with more user studies, our rule-based consensus function can perform well in terms of prediction precision for a variety of groups. Overall, our evaluation results demonstrate that our group consensus functions accurately predict a majority of group decisions.
6.
CONCLUSIONS AND FUTURE WORK
In this work, we propose a novel group recommendation solution that incorporates both social and content interests of group members. We study the key group characteristics that impact group decisions, and propose a group consensus function that captures the social, expertise, and interest dissimilarity among group members. What is more, we propose a generic framework that can automatically analyze various group characteristics and generate the corresponding group consensus function. Both the consensus function we propose and the generic framework perform well on real-world user studies consisting of groups of various sizes, user interests, and social relationships. Recent work [34, 14] has shown that relationship strength can be accurately inferred from a model based on profile similarity and interaction activity on online social networks (OSNs), such as Facebook and LinkedIn. Context-aware data fusion systems, such as [9], enable context-aware applications that can automatically detect user presence and take appropriate actions based on inputs available from mo-
bile, sensor, and social data sources. Combining a model for inferring relationship strength with a context-aware data fusion system and our techniques for group recommendation would allow us to develop applications that detect the presence of group members, automatically infer the strength of the social connections within the group, and provide accurate recommendations to the group. We plan to explore this space of novel context-aware applications. The class of context-aware applications described above requires data sources for individual preference information. While OSN profiles provide some information about preferences, such as favorite movies found on Facebook profiles, such preference information may be inadequate for group recommender systems. In the case of movies, Netflix rating profiles provide a wealth of preference information. We plan to investigate linking social network profiles with such sources of detailed item ratings. Recent developments, including the Facebook Graph API [1], Facebook social plugins [2], and the Freebase API [3], may simplify the linkage of disparate data sources like Facebook and Netflix. While sophisticated context-aware applications will allow us to automatically detect the presence of group members, infer their social connections, and obtain detailed individual preference information, the problem of obtaining ground truth data regarding actual group preferences remains. We are not aware of any existing repository of group preference information. To that end, we plan to continue our group user studies in an effort to learn more about the group decision making process in a variety of contexts.
[14] [15]
[16] [17]
[18] [19] [20] [21] [22] [23] [24]
7.
REFERENCES
[1] Facebook graph api. http://developers.facebook.com/docs/api. [2] Facebook social plugins. http://developers.facebook.com/plugins. [3] A freebase implementation of the facebook graph api. http://blog.freebase.com/2010/04/29/ a-freebase-implementation-of-the-facebook-graph-api/. [4] IMDB. http://www.imdb.com. [5] G. Adomavicius and A. Tuzhilin. Toward the next generation of recommender systems: A survey of the state-of-the-art and possible extensions. IEEE Transactions on Knowledge and Data Engineering, 17:734–749, 2005. [6] R. Agrawal, T. Imieli´ nski, and A. Swami. Mining association rules between sets of items in large databases. In Proc. of SIGMOD 1993, pages 207–216, 1993. [7] R. Agrawal and R. Srikant. Fast algorithms for mining association rules. In Proc. of VLDB 1994, volume 1215, pages 487–499, 1994. [8] S. Amer-Yahia, S. B. Roy, A. Chawla, G. Das, and C. Yu. Group recommendation: Semantics and efficiency. In Proc. of VLDB 2009. [9] A. Beach, M. Gartrell, X. Xing, R. Han, Q. Lv, S. Mishra, and K. Seada. Fusing mobile, sensor, and social data to fully enable context-aware computing. In Proc. of HotMobile 2010, pages 60–65, 2010. [10] S. Berkovsky, J. Freyne, and M. Coombe. Aggregation trade offs in family based recommendations. In Proc. of the 22nd Australasian Joint Conference on Advances in Artificial Intelligence, 2009. [11] L. Boratto, S. Carta, A. Chessa, M. Agelli, and M. L. Clemente. Group recommendation with automatic identification of users communities. In Proc. of WI-IAT ’09, 2009. [12] A. S. Das, M. Datar, A. Garg, and S. Rajaram. Google news personalization: Scalable online collaborative filtering. In Proc. of WWW ’07, pages 271–280, 2007. [13] L. de Campos, J. Fern´ andez-Luna, J. Huete, and M. Rueda-Morales. Managing uncertainty in group
[25]
[26] [27]
[28] [29] [30] [31] [32]
[33]
[34] [35] [36]
recommending processes. Journal of User Modeling and User-Adapted Interaction, 19, 2009. E. Gilbert and K. Karahalios. Predicting tie strength with social media. In Proc. of CHI ’09, pages 211–220, 2009. J. Han, J. Pei, Y. Yin, and R. Mao. Mining frequent patterns without candidate generation: A frequent-pattern tree approach. Data mining and knowledge discovery, 8(1):53–87, 2004. J. L. Herlocker, J. A. Konstan, A. Borchers, and J. Riedl. An algorithmic framework for performing collaborative filtering. In Proc. of SIGIR ’99, pages 230–237, 1999. W. Hill, L. Stead, M. Rosenstein, and G. Furnas. Recommending and evaluating choices in a virtual community of use. In Proc. of CHI ’95, pages 194–201, 1995. A. Jameson and B. Smyth. Recommendation to groups. In The adaptive web: methods and strategies of web personalization, 2007. Y. Koren. The bellkor solution to the netflix grand prize. http://www.netflixprize.com/assets/GrandPrize2009_ BPC_BellKor.pdf, 2009. W. Li, J. Han, and J. Pei. Cmar: accurate and efficient classification based on multiple class-association rules. In Proc. of ICDM 2001, pages 369–376, 2001. G. Linden, B. Smith, and J. York. Amazon.com recommendations: Item-to-item collaborative filtering. IEEE Internet Computing, 7:76–80, 2003. B. Liu, W. Hsu, and Y. Ma. Integrating classification and association rule mining. Proc. of KDD 1998, pages 80–86, 1998. H. Liu and P. Maes. Interestmap: harvesting social network profiles for recommendations. In International Conference on Intelligent User Interface, 2005. J. Masthoff. Group modeling: Selecting a sequence of television items to suit a group of viewers. Journal of User Modeling and User-Adapted Interaction, 14(1), 2004. M. OConnor, D. Cosley, J. A. Konstan, and J. Riedl. Polylens: A recommender system for groups of users. In European Conference on Computer-Supported Cooperative Work, 2001. M. Pazzani and D. Billsus. Learning and revising user profiles: The identification of interesting web sites. Machine Learning, 27:313–331, 1997. P. Resnick, N. Iacovou, M. Suchak, P. Bergstrom, and J. Riedl. Grouplens: an open architecture for collaborative filtering of netnews. In Proc. of CSCW ’94, pages 175–186, 1994. J. L. Rodgers and W. A. Nicewander. Thirteen ways to look at the correlation coefficient. The American Statistician, 42(1), 1988. U. Shardanand and P. Maes. Social information filtering: algorithms for automating “word of mouth”. In Proc. of CHI ’95, pages 210–217, 1995. D. Sprague, F. Wu, and M. Tory. Music selection using the partyvote democratic jukebox. In Proc. of AVI 2008, 2008. J. E. Squire. The movie business book, third edition. R. Srikant and R. Agrawal. Mining quantitative association rules in large relational tables. In Proc. of SIGMOD 1996, pages 1–12, 1996. ˜ unen, and T. Hannula. E. Vildjiounaite, V. KyllA˝ Unobtrusive dynamic modelling of tv programme preferences in a finnish household. Journal of Multimedia Systems, 15, 2009. R. Xiang, J. Neville, and M. Rogati. Modeling relationship strength in online social networks. In Proc. of WWW 2010, pages 981–990, 2010. Z. Yu, Z. Yu, X. Zhou, and Y. Nakamura. Handling conditional preferences in recommender systems. In Proc. of IUI 2009. Z. Yu, X. Zhou, Y. Hao, and J. Gu. Tv program recommendation for multiple viewers based on user profile merging. Journal of User Modeling and User-Adapted Interaction, 16(1), 2006.