Enhancing I/O Throughput via Efficient Routing and Placement for Large-scale Parallel File Systems David A. Dillow∗ , Galen M. Shipman∗ , Sarp Oral∗ , Zhe Zhang† , and Youngjae Kim∗ ∗ Oak
Ridge National Laboratory, † IBM T.J. Watson Research Center {dillowda, gshipman, oralhs, kimy1}@ornl.gov,
[email protected] Abstract—As storage systems get larger to meet the demands of petascale systems, careful planning must be applied to avoid congestion points and extract the maximum performance. In addition, the large data sets generated by such systems makes it desirable for all compute resources to have common access to this data without needing to copy it to each machine. This paper describes a method of placing I/O close to the storage nodes to minimize contention on Cray’s SeaStar2+ network, and extends it to a routed Lustre configuration to gain the same benefits when running against a center-wide file system. Our experiments using half of the resources of Spider – the center-wide file system at the Oak Ridge Leadership Computing Facility – show that I/O write bandwidth can be improved by up to 45% (from 71.9 to 104 GB/s) for a direct-attached configuration and by 137% (47.6 GB/s to 115 GB/s) for a routed configuration. We demonstrated up to 20.7% reduction in run-time for production scientific applications. With the full Spider system, we demonstrated over 240 GB/s of aggregate bandwidth using our techniques. Index Terms—Network congestion, SeaStar network, Lustre file systems, Spider.
I. I NTRODUCTION The Oak Ridge Leadership Computing Facility (OLCF), located at Oak Ridge National Laboratory, houses Jaguar – a 200 cabinet Cray XT5 system. Jaguar [6] offers 18,688 compute nodes with two hex-core AMD Opterons each, and provides 224,256 cores and 2.3 petaflops of compute performance and nearly 300 terabytes of system memory. The OLCF also hosts a number of smaller systems used for analysis and visualization work, software development, and integration of evolving storage and compute technologies such as accelerator-enhanced systems. Supporting the I/O demands of these systems falls to Spider [22], our Lustre [25] based center-wide file system. Spider is designed to provide reliable global accessibility and high performance. Time on Jaguar is a limited resource. The majority of compute time on Jaguar is managed as part of the US Department of Energy’s Innovative and Novel Computational Impact on Theory and Experiment (INCITE) program. For 2011, the average allocation for each accepted project was 27 million CPU-hours [1]. While this may seem to be all the time in the world, it represents just over 120 hours (5 days) at full scale on Jaguar. In these situations, it is desirable to achieve as much efficiency as possible to conserve resources. Much of this work † This work was performed while Zhe Zhang was a staff member at Oak Ridge National Laboratory.
is focused on improving the computational performance of the scientific codes, as that is where they spend the bulk of their time. However, attention should also be paid to the time spent reading the input deck, writing out results, and performing defensive I/O (checkpointing) to protect against system failure during long-running simulations. Time spent performing these operations is time that could be used to more quickly perform the science and/or improve the resolution and detail of the subject being studied. Our activities during the acceptance of Jaguar and Spider revealed a substantial digression between the expected and actual I/O performance of the system. While we had made provisions during the design of the system to spread the I/O load throughout the network in a manner inspired by Azeez et al [5], we found that congestion and the associated load imbalance degraded our aggregate performance. This was clearly visible when watching the bandwidth statistics of the back-end storage. We would see impressive sustained performance at the expected peak bandwidth numbers, only to see the average bandwidth numbers plummet as the bulk of the writes completed their task, leaving several stragglers writing their share of the work at a small fraction of the available aggregate speed. This reduction from the peak bandwidth represents the loss of over 134 GB/s when utilizing the full resources of Spider. Much research has been done to optimize network communications in high-performance computing (HPC) environments. In [26] the authors present an adaptive routing mechanism that is capable of eliminating deadlocks in 2D torus networks. While adaptive routing strategies have shown significant performance improvements for long-lived communication patterns [15], their effectiveness in short-lived, highlydynamic communication patterns such as HPC I/O has not been demonstrated. The Quadrics network [20] uses a network operating system and specialized hardware to support highperformance data transfers. PaScal [16] is an I/O networking infrastructure which employs several novel technologies, including multi-level switch-fabric interconnection network, bandwidth on demand, and so forth. It has been implemented and evaluated on a 1024 node Linux cluster in LANL installed with the Panasas parallel filesystem. The storage architecture and networking technologies used in the Panasas parallel file system are presented in [19]. This paper makes the following contributions as a result
of our detailed investigation and analysis of the performance issues discovered during the development and deployment to production of the Spider center-wide file system: • We identified sources of file system performance loss, and characterized their impact (Sections IV-A2, IV-B1, and IV-B2). • We characterized the link saturation bandwidth of the Cray SeaStar2+ network, and verified the impact of round-robin packet arbitration on network fairness (Section IV-A3). • We developed techniques to minimize network congestion using a nearest-neighbor communication pattern, resulting in better aggregate performance and improved balance between clients performing I/O (Section IV-A4). • We extended our techniques to improve LNET route configurations to minimize congestion on the InfiniBand fabric and allow our placement strategy to work in a routed file system environment (Section III-B). • We demonstrated a 20.7% reduction in run-time for production scientific workloads using our projection routing method (Section IV-B3). II. BACKGROUND A. Jaguar XT5 Jaguar, the primary computational platform for the OLCF, is a Cray XT5 massively parallel, distributed memory system [6]. Each of Jaguar’s 18,688 compute nodes is a powerful general purpose computer in its own right, powered by two hexcore AMD Opterons running at 2.6 GHz. These nodes are specifically designed to support large-scale, high-performance computing applications in a dense physical footprint. In addition, there are 256 service and I/O (SIO) nodes to provide access to storage and other system services such as user logins and batch system management. These nodes are less powerful, with a single dual-core 2.6 GHz AMD Opteron. The XT5 is a descendant of the Red Storm system developed by a partnership between Cray and Sandia National Laboratories (SNL). Each node in the system is connected into a 3D torus network via the SeaStar 2+ network interconnect chip (NIC). SeaStar [10] is a networking technology combining high-speed serial links with a router ASIC wired into a 3D torus topology. While it has been widely studied [9], [4], [8], these studies have focused on MPI-level performance evaluation, without investigating network routing and data object placement issues. Each SeaStar ASIC acts as a router for the network, with six independent, full duplex links to the rest of the system. Each input port has a dedicated set of look-up tables that determines the egress port of a packet based on the destination address of the packet. These tables are initialized to implement dimension-order routing during the process of booting the machine, and remain static until the next boot. Barring accommodations for failed or missing components that prevent a uniform torus topology, packets are routed in a fix dimension order (X+, Y+, Z+, X-, Y-, Z-) [2].
The XT5 system runs Compute Node Linux (CNL), a stripped-down version of the Linux operating system enhanced for HPC environments. CNL implements the Portals data movement interface for communication among the nodes of the system. Portals was developed at Sandia National Laboratories in collaboration with the University of New Mexico [7]. Its connectionless semantics provides the scalability necessary to grow a distributed memory system to tens of thousands of nodes. Earlier versions of Portals ran on several large-scale machines of their time, including a 1024-node nCUBE-2, a 1800-node Intel Paragon, and the 4500-node Intel ASCI Red machine.
B. Spider Spider is one of the world’s fastest and largest POSIX complaint parallel file systems. Intended for the write-heavy workloads found on scratch file systems, Spider is designed for high performance in a small footprint, and built from scalable building blocks. Each building block is comprised of a DataDirect Networks (DDN) S2A9900 storage system [14], driven by four Lustre Object Storage Servers (OSS). S2A9900 controllers are configured to run in pairs for increased reliability. Each controller is called a singlet and a pair is called a couplet. Each couplet is configured with five high density drive trays, with 300 drives housed in 20U of rack space. For Spider, we populate those trays with 280 SATA drives, each with a capacity of 1 TB. Write-back caching is disabled to prevent unrecoverable data loss in the event of a controller failure. These drives are grouped into 28 DirectRAID tiers (RAID3 with two parity drives), with seven 7.2 TB LUNs exposed over DDR InfiniBand for each OSS. Each OSS is a Dell PowerEdge 1950, with 16 GB of memory and two quad core Xeon E5410 running at 2.3GHz. Each OSS serves seven Object Storage Targets (OST). This building block is capable of delivering over 5.5 GB per second of raw block storage. There are 48 of these building blocks in the Spider system, giving it an aggregate of 13,440 TB raw storage, or over 10 PB of capacity after accounting for the parity overhead of DirectRAID. There are 192 OSS servers, providing 14 teraflops of compute and 3 TB of memory dedicated to our Lustre file systems. This aggregate capability is broken up into three disjoint chunks to spread the metadata load. Widow1 has half the storage – 672 OSTs – while widow2 and widow3 equally and disjointly split the other half, each with 336 OSTs. Metadata services are provided by three identical MetaData Servers (MDS). Each MDS is a Dell R900 with 64 GB of memory and four quad core Xeon E7330 running at 2.6 GHz. The MetaData Target (MDT) for each file system is stored on a shared Engineo 7900 (XBB2) storage system, connected via four 4Gbps Fibre Channel connections to each MDS. Each MDT is configured as a RAID10 volume on the XBB2 with 80 SATA 1 TB drives, short stroked to provide an 8 TB LUN. Details of the Lustre parallel file system can be found in [25].
a particular network on an LND when multiple networks of a given type are in use. Most importantly, LNET supports routing between these different networks in the Lustre Networking layer using a simple algorithm. In order to chose the router to use for a given message to a remote network, LNET keeps each router of a weight class on a list. For each message to be sent, the first alive router is selected from the list, and that router is then placed at the tail of the list. In this manner, LNET will distribute the load among all alive routers in a weight class for a remote network. III. C ONGESTION AVOIDANCE T ECHNIQUES A. I/O Placement
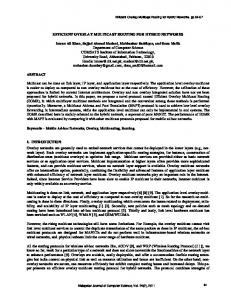
Fig. 1.
Scalable I/O Network (SION) architecture.
C. Scalable I/O Network (SION) Spider was intended to be used as a center-wide file system, and we designed our Scalable I/O Network (SION) to support its performance goals. SION is deployed as a multi-stage DDR InfiniBand fabric, and provides over 889 GB/s of bi-sectional bandwidth. The network infrastructure is based on 288-port Cisco 7024D DDR InfiniBand switches. Two switches are dedicated to providing connectivity between Jaguar and Spider, while other switches provide links to the MDS and management services, as well as the smaller compute resources in the center. The 7024D switches each provide 288 user-facing ports via 24 leaf modules with 12 external ports and 12 uplinks into the internal fat-tree topology. As shown in Figure 1, the 192 storage servers in Spider – and 192 SIO nodes on Jaguar – are grouped into 32 sets of 12 connections (6 storage servers, 6 SIO nodes). Each of the members of these groups are plugged into the external ports on the same leaf module. In this manner, they share a single crossbar and traffic among the members avoids traversing the fabric. D. LNET and Routing Lustre uses an API called LNET (Lustre Networking) [23], [25] which was derived from Portals. LNET provides communication among Lustre servers and between Lustre servers and clients. LNET uses a Lustre Networking Device (LND) layer to implement different network types. An LND exists for Portals as well as TCP/IP, InfiniBand, Quadrics, Myrinet, and other high-performance interconnects. The term “LNET” is also used to refer to the network served by an LND. A Lustre address is of the form @LNET[X], where is specific to the LND in use, and LNET determines which LND to use – “ptl” uses the Portals LND, “o2ib” uses the InfiniBand, and so on. “X” is an optional number identifying
To avoid congestion on the 3D torus, we must carefully control which client talks to a particular OSS. We achieve this by drawing from the well known pattern of “nearest-neighbor” communication often found in HPC applications. Client nodes are chosen such that each client is a minimum number of hops (distance) from the OSS responsible for the file it is writing. Given a sufficient set of nodes from which to select active clients, it is possible to avoid saturating a link. B. Avoiding Link Congestion via Routing When combined with simple routing configurations, the basic properties of LNET routing described in Section II-D preclude using I/O placement to avoid congestion. Worse still, they will often inject traffic into the InfiniBand fabric in nonoptimal locations, leading to significant congestion on both networks in the system. To minimize the congestion on the InfiniBand network and to allow application developers the ability to optimize their I/O using our placement strategy, we consider the following three routing configurations: • Nearest-neighbor. In this configuration, the servers and routers are broken up into 32 sets. Membership in a set is governed by the module in the core switch the element is connected to. This configuration leads to 32 remote LNETs, with each one accessible by 6 routers. Each client is configured to communicate with a remote LNET using the router for that set that is topologically nearest in the 3D torus. As the distribution of routers is not perfectly even throughout the torus, static load-balancing is performed to balance the number of clients serviced by each router. This configuration would increase variability in performance as the bandwidth available to a job will have a greater dependency on its location within the torus. Smaller jobs will see reduced bandwidth as the set of routers in active use grows proportionally to the job size. • Round-robin. In this configuration, the servers and routers are again broken up into 32 sets as with Nearest-neighbor. Instead of using the nearest router, one of the 6 optimal routers is chosen in a round-robin fashion for each remote LNET. While this configuration allows for placement and avoids congestion on the InfiniBand fabric, it unnecessarily distributes I/O traffic throughout the torus.
Projection. In this configuration, each server gets a unique remote LNET. There are 192 remote LNETs, and the clients are configured with a single router for each remote LNET. This is effectively a projection of the OSS servers into the torus. It allows placement of clients to avoid congestion on the torus and avoids congestion on the InfiniBand fabric. Each client may see significant variances in distance to particular servers, but this is no worse than encountered in traditional direct-attached storage. In all cases, I/O for a particular OSS is directed to a router attached to a crossbar in the InfiniBand fabric common to that OSS. This ensures that there is no traversal of the switch’s internal fat-tree thereby avoiding the issue of link saturation and head-of-line blocking in the fabric. •
160
Block Write IOR Write (Improved) IOR Write (Default)
GBytes per second
140 120 100 80 60 40 20 0 0
10 20 30 40 50 60 70 80 90 100
IV. E XPERIMENTAL R ESULTS AND D ISCUSSION
A. Direct Attached Storage As a first step to deployment, 96 SIO nodes on Jaguar were configured to be OSSes. Each OSS was configured virtually identically to the eventual Spider system – 7 OSTs, one per exported LUN, with one LUN per DDN 9900 tier. Using the properties of SION noted in section II-C, we carefully paired each SIO node with storage that would be directly accessible from the same leaf module in the 7024D switch as the SIO node. This allowed us to avoid any potential source of congestion on the InfiniBand network as all network traffic from the OSS to the back-end storage was isolated to the crossbar and did not traverse the fat-tree fabric. 1) Performance of the Block Storage System: To establish a baseline for potential performance, we measured the blocklevel bandwidth of the storage system. We configured seven LUNs on each XT5 SIO node, and exercised all LUNs on each OSS simultaneously. Each LUN received a steady workload of sequential 1 MB requests, with 4 requests in flight at all times. In this manner, each OSS had a total of 28 I/O requests outstanding at any given point during the testing. Each test was
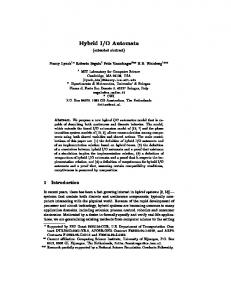
Fig. 2. Write performance for direct-attached Lustre file system. The solid line denoted “Block Write” is the raw storage system performance, and sets the expectations for performance scaling.
100 Percent of ranks complete
Developing Spider presented multiple technical challenges consummate with breaking new technical ground. As well as being the first routed file system deployed at this scale, it was the largest Lustre file system in the world at the time of its deployment. No Lustre file system had been deployed with such number of servers and amount of disk storage, and it served the largest number of clients in terms of core count. To mitigate technical risk and to separate scaling issues from routing issues, we initially deployed a direct-attached Lustre file system with Jaguar. This allowed us to address any issues in the back-end storage and provide early users a more stable platform while we proceeded to develop and test Lustre’s routing capabilities at this unprecedented scale. Once we had proven the stability of Lustre at this scale using the direct-attached file system, we proceeded to reconfigure the storage for use as a routed file system to allow access to all of the OLCF’s resources. After testing and developing our improved routing configurations, this configuration was then deployed to production.
Number of OSSes
80 60 40 20 Default Placed
0 12
14
16
18
20
22
24
26
28
Seconds Fig. 3. Cumulative Distribution Function plot of per-writer completion time. “Default” series is from best run without placement, “Placed” series is from worst run with placement.
run for 60 seconds, and the maximum bandwidth achieved from three trials is presented in Figure 2. The aggregate performance of the system scales nearly linearly as each additional OSS is added to the test. We reach a peak bandwidth of 120 GB/s when running with 96 OSSes (672 LUNs, half of the available storage), with each LUN contributing nearly 180 MB/s. The slight ripple in the results as the number of OSSes increases is due to internal limits of the DDN 9900 architecture – while each InfiniBand port is capable of 1,500 MB/s when tested in isolation, running two ports on a single controller (singlet) reaches a maximum bandwidth of approximately 2,500 MB/s. More recent versions of the DDN firmware lift the per-controller bandwidth to slightly more than 2,800 MB/s in our configuration. 2) Initial Performance of the Direct Attached File System: Having demonstrated that half of the back-end storage is capable of delivering a raw performance of over 120 GB/s, we
MBytes per second
7000 MBytes per second
6000 5000 4000 3000 2000
Actual 1000 100 10 1 0.1
1000
0
Half-duplex Duplex
0 0
2
4
6
8
10
12
2
4
6
8
10
12
14
16
Distance from primary congestion point 14
16
Fig. 5.
SeaStar link balance under congestion.
Transmitting Pairs Fig. 4.
Unidirectional and bidirectional link bandwidths on SeaStar.
pressed forward with a Lustre configuration on the XT5. Each of the 18,688 compute nodes was configured to be a client of the direct-attached file system, communicating directly over Cray’s proprietary network to the OSS servers. We used IOR (an MPI-level file system benchmark [21]) in file-per-process mode to load the file system for the Lustre level testing. We configured the job launcher to only place one process per node to avoid any host-level bottlenecks in the client code, allowing us to focus on the network and storage performance. We precreated the output files for the IOR runs to avoid file creation overheads and ensure that we did not have multiple ranks and/or files sharing an OST and reducing the performance of the storage system. IOR was configured to insert a barrier between each phase of its operation to ensure that all ranks had their respective file open prior to testing bulk I/O performance. Each rank transferred 3 GB of data with a transfer size of 8 MB. The maximum bandwidth achieved from five trials is presented in Figure 2. Testing at small OSS counts demonstrated performance that was in line with our expectations of approximately 1250 MB/s per OSS. This performance scaled linearly up to 6 OSSes. However, above 6 OSSes, the performance fell below our expectations of near-linear scaling. Beyond 40 servers in this scaling study, performance became highly erratic, achieving at best 86% of the raw baseline, and 61% in the worst case. As illustrated by the “Default” series in the cumulative distribution function (CDF) presented in Figure 3, there is a large difference in completion times persists between the fastest and slowest ranks. A large number of writers complete near the 18 second mark, but after 19 seconds a number of writes straggle in over the course of 10 seconds. Investigating the cause of this behavior led us to network-congestion on Jaguar’s SeaStar2+ network as a primary cause. 3) Measurement of SeaStar Bandwidth: There are two orders of magnitude more compute nodes than service nodes on Jaguar; this presents natural hot spots in the torus surrounding the SIO nodes. To fully understand the link capacity of SeaStar, we performed bandwidth testing at the Portals level.
Pairing nodes on each side of the link under test, we offered a streaming load of 1 MB requests. We varied the number of participating node pairs from 1 to 16, as Jaguar has 32 nodes in its largest dimension. As shown in Figure 4, injection bandwidth from user space on a single node was observed to be 1,705 MB/s. We observed the link bandwidth to be approximately 3,020 MB/s. There is little variation in performance across the range of pairings. We find that there is minimal degradation when operating in full duplex mode. There is a slight loss at 16 nodes pairs; this is believed to be an issue with the test harness and was not investigated. Now that we know the link capacity of the SeaStar network, we can determine the number of client-OST pairs possible without link saturation. With each OST contributing 180 MB/s (§ IV-A2), a link can support the communications of 17 clientOST pairs before reaching saturation. Examination of the routes in use on the torus during the file system level testing in Figure 2 reveals that 70% of the tests using the Default placement had at least one link with 18 or more client-OST pairs traversing it. 42% had at least one link with over 34 pairs, 21% with over 60 pairs, and 3% had over 70 pairs. This magnitude of bandwidth sharing is a significant contributing factor to the poor scaling results initially demonstrated. Our link bandwidth test revealed an additional contributing factor to our poor aggregate performance at scale – unfair link balance under congested conditions. In their discussion of age-based packet arbitration, Abts and Weisser [3] describe the behavior of the SeaStar network when using round-robin packet arbitration. Traffic traveling over more hops receives geometrically less bandwidth. The bandwidth each node receives in the link bandwidth test is governed by the equation Bnode =
Blink (2n)H
where n is the number merging streams (1 for the farthest node from the congestion point, 2 for all other nodes) and H is the number of hops to the network segment under test. The transmitting node adjacent to the tested link has n = 2, H = 1, and is expected to receive half of the available bandwidth; the next node from the test link has n = 2, D = 2 and receives a
h(n1 , n2 ) = dx (n1 , n2 ) + dy (n1 , n2 ) + dz(n1 , n2 ) where daxis (n1 , n2 ) = min
(
(n1,axis − n2,axis ) mod Laxis (n2,axis − n1,axis ) mod Laxis
The best client(s) to use for a specified OSS nOSS is given by calculating h(n, nOSS ) for each n in the set of compute nodes available. Choose the N nodes with minimum distance to nOSS , and remove them from the set of available nodes. These are the best clients to use for the OSS. Repeat these steps for each OSS involved in the test. Placing all 18,688 compute nodes into the available set for the algorithm, we ran another scaling study of the direct attached Lustre file system. We placed the file for each rank on a known OST – and thereby known OSS – and used a feature of the job launch facility to place the ranks of the IOR job onto the compute nodes such that the clients were paired up with OSTs on the nearest OSS to the client. The results were dramatic; as seen in Figure 2, aggregate bandwidth was increased an average of 18% when more than 40 OSSes were involved in the test. We see a minimum gain of 5%, and realize increases of over 45% in the best cases. Using placement of the I/O to avoid saturating links of the torus, IOR is able to achieve 87 to 92% of the aggregate raw performance of the back-end storage system. In these tests, no more than 7 client-OST pairs shared a common link in the torus for their communication. This compares favorably to the default placement, where over 70% of the links had 18 or more clientOST pairs, overwhelming the links with offered load. The reduction in the difference between the fastest and slowest writer when using placement is shown by the “Placed” series in Figure 3. All writes complete within a span of less than 5 seconds, while the “Default” placement complete over
140 120 GBytes per second
quarter of the available bandwidth, and so on. Figure 5 shows that the the first node achieved 1,513 MB/s, which compares favorably to the expected value of 1,510 MB/s (one-half of the 3,020 MB/s link capacity.) For the nodes farthest from the test link, the nodes receive approximately 166 KB/s, or three orders of magnitude less bandwidth than the node nearest the link. This behavior further distorts the balance of the I/O times of client-OST pairs sharing a saturated link. 4) Avoiding Congestion via I/O Placement: To avoid congestion on the SeaStar links, we must carefully control which client talks to a particular OSS for the direct-attached file system. Using the well known “nearest-neighbor” communication pattern, client nodes are chosen such that each client is a minimum number of hops (distance) from the OSS responsible for the file it is writing. Given a sufficient set of nodes from which to select active clients, it is possible to avoid saturating a link as there are only seven OSTs served by each OSS – much less than the saturation point of 17 client-OST pairs – and a single client/file per OST for our testing. For a 3D torus, given the coordinates of two nodes n1 , n2 , and the length of each axis Laxis , the hop count h (distance) is given by:
IOR Write (Default placement) IOR Write (Optimized placement)
100 80 60 40 20 0 None
2000
4000
8000
16000
Placeholder nodes Fig. 6. Write performance for direct-attached Lustre file system with confinement of available compute nodes.
a span of approximately 15.5 seconds. With the elimination of congestion in the torus, we achieve a better balance between writers and we leave less of the storage system idle while waiting for the stragglers. 5) Effect of Torus Location on Performance: While the results when allowing the placement algorithm free reign of the machine to optimize the node choice are very encouraging, many applications desire the improved performance when not using every possible core. To determine the potential improvement when using only 672 nodes of the machine – one for each OST in the test file system – we ran an experiment using the same nodes that the job launcher gave for the un-optimized placement. Additionally, to investigate the impact of location in the torus on performance, we launched a “place-holder” job that consumed a specified number of nodes and kept them idle, displacing the location from which our test job would execute. The parameters of the test are as before, with the number of OSTs fixed at 672 and the variables being the offset within the machine and placement of the processes performing I/O. Each test was run five times, and the best bandwidth is reported in Figure 6. Optimizing which processing element performs I/O to a particular OST improved performance from 38 to 58%. In all cases throughput within 5% of the maximum observed was achieved when allowing unconfined placement of processes performing I/O. This demonstrates that substantial improvements are possible using our approach even for smaller scale application runs. B. Indirectly Attached (Routed) Storage For the initial routed configuration, all of Jaguar was in the Portals ’ptl’ LNET, while the servers (OSS and MDS) moved to the InfiniBand ’o2ib’ LNET. To enable these two LNETs to communicate, we reconfigured the 96 SIO nodes used for the direct attached system into LNET routers between the ’ptl’ and ’o2ib’ LNETs. We added an additional 96 SIO nodes as routers, yielding a total of 196.
140
120 GBytes per second
120 GBytes per second
140
Uncongested Congested
100 80 60
100 80 60 40 20 0
40
Default Placed Read
20 20
30
40
50
60
70
80
90
Baseline Round Robin
100
Nodes Fig. 8.
Fig. 7. Aggregate block-level bandwidth of SION to 24 DDN 9900 Couplets. This test was performed with updated tools and firmware relative to Figure 2, leading to improved performance.
Projection
IOR write bandwidth on routed file system.
3000
Baseline Nearest Neighbor Round Robin Projection
2500 Runtime (seconds)
While this configuration had the benefits of a shared centerwide file system, we quickly found that there were obstacles to achieving the performance potential we had demonstrated during our direct-attached testing. The LNET algorithm for choosing a router (§ II-D) prohibited the use of the placement techniques from § IV-A4 to avoid congestion on the torus. Furthermore, the simple route configuration injected traffic into the InfiniBand fabric via ports that were not on the appropriate crossbar, leading to congestion within the SION fat-tree network and significantly reduced aggregate performance. 1) Impact of Congestion on the InfiniBand Fabric: Figure 7 shows the impact of congestion in the SION InfiniBand fabric. This is a block level test similar to Figure 2, though it demonstrates improved performance due to firmware updates. The “Uncongested” series shows the linear increase in speed expected when the SIO node is issuing block IO to a storage back-end on the same crossbar. The “Congested” series shows the aggregate bandwidth achieved when an SIO node is forced to traverse the fat-tree to communicate with an off-module storage module. At 96 SIO nodes – using half of the Spider hardware (24 couplets/48 singlets) – the observed performance is 135.7 GB/s without congestion and 94.1 GB/s with congestion. This represents a 30% performance degradation. 2) Evaluation of Routing Configurations via IOR: We tested the three routing configurations from § III-B with IOR and compared them to the baseline route configuration. We tested with the full machine available for optimization using IOR in file-per-process mode against 672 OSTs. Each rank wrote 8 GB of data with a transfer size of 8 MB to a file configured with a single stripe. Five trials were run and the maximum aggregate bandwidth is reported in Figure 8. Our baseline configuration, with its congestion issues in both the torus and InfiniBand fabric, resulted in 57.1 GB/s for reads and 47.6 GB/s for writes using the default placement of ranks. Round-robin does slightly better when not using our placement
Default Placed Write
2000 1500 1000 500 0 GTC
Fig. 9.
S3D
XGC Genasis
Application run-time for sample problem on routed file system.
strategy, at 60.6 GB/s for reads and 48.1 GB/s for writes. Round-robin performs well when placement is used, yielding 102 GB/s reads and 83 GB/s writes. Projection yields the best observed results with 115 GB/s reads and 92 GB/s writes without placement, and 123 GB/s reads and 113 GB/s writes with placement. Nearest-neighbor is not reported due to issues in the placement calculations and limited dedicated system time for testing these configuration. We leave this issue open for further analysis and future work. Using the Projection routing configuration with the combined storage of Spider – 1,344 OSTs – we were able to demonstrate aggregate bandwidths of over 244 GB/s for both read and writes. This result was generated by IOR in file-perprocess mode. Each rank wrote 8 GB of data with a transfer size of 8 MB. 3) Evaluation of Routing Configurations via Applications: While the results from § IV-B2 were encouraging, the synthetic nature of the benchmarks does not provide direct insight on the
effect our techniques to scientific productivity. To gauge the user-visible impact, we ran a suite of production applications under each configuration. The following applications were run simultaneously on the machine, with no optimization to avoid I/O congestion on the torus: • GTC (global gyrokinetic toroidal code) [17] is a widely used simulation code to study fusion plasmas. Different from the above two applications, GTC uses collective I/O, where only a small number of files are created. • S3D is a high-fidelity turbulent reacting flow solver developed at the Sandia National Laboratory. S3D uses a file-per-process mode [18], [24]. • XGC is a gyrokinetic Particle-in-Cell code designed to model the development of an edge pedestal in the radial density and temperature profiles of tokamak fusion plasmas. XGC uses collective I/O, where only a small number of files are created. [12], [13] • GenASiS2 is an astrophysics program simulating the merger and collision of polytrope stars. Similar to S3D, GenASiS2 uses one file for each process in the computing job [11]. The problem sizes were set to fit into the nodes available and to give run-times suitable for a reasonable allocation of dedicated machine time. We ran the suite multiple times in each configuration, and summarize the results in Figure 9. Overall, the Projection configuration reduced application runtimes by 8.7% (XGC) to 20.7% (GenASiS2). XGC and S3D show better performance when running on the Round-robin configuration than on Projected. This is due to the relatively smaller number of files these applications were writing. With the smaller number of files, there were fewer OSSes involved, making the I/O performance more susceptible to hotspots in the torus. The round-robin configuration has greater path diversity to the OSSes as neighboring compute nodes will use routers in different areas of the torus. This helps to avoid hotspots in the network, thereby increasing the I/O performance. We believe the poor performance of S3D with the nearestneighbor configuration to be a result of the small job size in our mixed application workload. The nearest-neighbor configuration provides jobs with an aggregate bandwidth that varies with respect to the size of the job and its location within the torus. As the routers are distributed throughout the torus, and each compute node will communicate with the topologically closest router for each OSS group, larger jobs will spread through the torus and have more routers available, therefore achieving better I/O performance. V. C ONCLUSIONS During the deployment of Cray XT5 known as Jaguar at the OLCF, the interim direct-attached Lustre file system fell far short of the expected performance. A detailed analysis revealed that congestion on the SeaStar torus network had a significant effect on the realized performance. We characterized the bandwidth capacity of the SeaStar network links, and developed a placement strategy to pair clients to specific I/O server that
are topologically close to each other, reducing the load on the common torus links and avoiding link saturation. With this approach, 92% of the raw back-end storage performance was achieved at the file system level. Furthermore, this level of performance (within 5%) was maintained when the choice of clients performing I/O was significantly limited. These results indicate that placement is a viable mechanism to increase aggregate I/O performance, not only for large-scale application invocations that span the entire Jaguar system, but also for applications that use a much smaller fraction of the available compute resources. The performance benefits of placement did not automatically follow when the Lustre file system was transitioned from a direct-attached configuration to a routed configuration in support of center-wide access to Spider. The naive configuration in which all 192 routers were assigned the same weight coupled with LNET’s per-message round-robin selection policy prohibited our placement optimization strategy. In addition to negating the benefits of reduced congestion on the torus, this configuration introduced substantial congestion within the SION InfiniBand fabric. To regain opportunities for optimization via placement and eliminate InfiniBand congestion, we developed and evaluated three additional LNET routing configurations. After weighing the benefits and drawbacks of alternate routing schemes, we selected a configuration for the production environment that “Projected” the I/O servers into the torus. This configuration yielded over 90% of the raw back-end storage performance, and reduced the run-time of production scientific applications by up to 20.7%. When combined with the placement strategies outlined in section IV-A4, this configuration demonstrated aggregate performance of 244 GB/s for both reads and writes when using the entire Spider storage system. ACKNOWLEDGMENT This research used resources of the Oak Ridge Leadership Computing Facility, located in the National Center for Computational Sciences at Oak Ridge National Laboratory, which is supported by the Office of Science of the Department of Energy under Contract DE-AC05-00OR22725. Notice: This manuscript has been authored by UT-Battelle, LLC, under Contract No. DE-AC05-00OR22725 with the U.S. Department of Energy. The United States Government retains and the publisher, by accepting the article for publication, acknowledges that the United States Government retains a nonexclusive, paid-up, irrevocable, world-wide license to publish or reproduce the published form of this manuscript, or allow others to do so, for United States Government purposes. R EFERENCES [1] Innovative and Novel Computational Impact on Theory and Experiment (INCITE) Awards Fact Sheet. http://science.energy.gov/∼ /media/ascr/ pdf/incite/docs/2011 incite factsheets.pdf. [2] Dennis Abts. The Cray XT4 and Seastar 3-D Torus Interconnect. http: //research.google.com/pubs/archive/36896.pdf, 2010. [3] Dennis Abts and Deborah Weisser. Age-based packet arbitration in largeradix k-ary n-cubes. In SC, 2007.
[4] Sadaf R. Alam, Jeffery A. Kuehn, Richard F. Barrett, Jeff M. Larkin, Mark R. Fahey, Ramanan Sankaran, and Patrick H. Worley. Cray xt4: an early evaluation for petascale scientific simulation. In Proceedings of the 2007 ACM/IEEE conference on Supercomputing, SC ’07, pages 39:1–39:12, New York, NY, USA, 2007. ACM. [5] B. Azeez, H. Kim, Y. Jin, and E.J. Kim. I/O Node Placement for Performance and Reliability in Torus Networks. In International Conference on Parallel and Distributed Computing and Systems (PCDS2006), IASTED, 2006. [6] Arthur Bland, Ricky Kendall, Douglas Kothe, James Rogers, and Galen Shipman. Jaguar: The world’s most powerful computer. In Proceedings of the Cray User Group Conference, 2009. [7] Ron Brightwell, Trammell Hudson, Kevin Pedretti, Rolf Riesen, and Keith D. Underwood. Implementation and performance of Portals 3.3 on the Cray XT3. In Proceedings of the 2005 IEEE International Conference on Cluster Computing, 2005. [8] Ron Brightwell, Kevin Pedretti, and Trammell Hudson. Smartmap: operating system support for efficient data sharing among processes on a multi-core processor. In Proceedings of the 2008 ACM/IEEE conference on Supercomputing, SC ’08, pages 25:1–25:12, Piscataway, NJ, USA, 2008. IEEE Press. [9] Ron Brightwell, Kevin Pedretti, and Keith D. Underwood. Initial performance evaluation of the cray seastar interconnect. High-Performance Interconnects, Symposium on, 0:51–57, 2005. [10] Ron Brightwell, Kevin T. Pedretti, Keith D. Underwood, and Trammell Hudson. Seastar interconnect: Balanced bandwidth for scalable performance. IEEE Micro, 26:41–57, May 2006. [11] Christian Y. Cardall, Eirik Endeve, Reuben D. Budiardja, Pedro Marronetti, and Anthony Mezzacappa. Towards exascale supernova simulations with GenAsis. In Proceedings of the SciDAC 2010 Workshop, 2010. [12] C.S. Chang and S. Ku. Spontaneous rotation sources in a quiescent tokamak edge plasma. Physics of Plasmas, 15, 2008. [13] J. Cummings, A. Pankin, N. Podhorszki, G. Park, Ku S., R. Barreto, S. Klaksy, C.S. Chang, H Strauss, L. Sugiyama, P. Snyder, D. Pearlstein, B. Ludascher, G. Bateman, A. Kritz, and the CPES Team. Plasma edge kinetic-mhd modeling in tokamaks using kepler workflow for code coupling, data management and visualization. Communications in Computational Physics, 4:675–702, 2008. [14] Data Direct Networks. DDN S2A9900. http://www.ddn.com/9900. [15] Patrick Geoffray and Torsten Hoefler. Adaptive routing strategies for modern high performance networks. High-Performance Interconnects, Symposium on, 0:165–172, 2008.
[16] G. Grider, H. Chen, J. Nunez, S. Poole, R. Wacha, P. Fields, R. Martinez, P. Martinez, S. Khalsa, A. Matthews, and G. Gibson. Pascal - a new parallel and scalable server io networking infrastructure for supporting global storage/file systems in large-size linux clusters. Performance, Computing, and Communications Conference, 2002. 21st IEEE International, 0:46, 2006. [17] GTC (Global Gyrokinetic Toroidal Code). http://w3.pppl.gov/theory/ GPSC.html. [18] E.R. Hawkes, R. Sankaran, J.C. Sutherland, and J.H. Chen. Direct numerical simulation of turbulent combustion: fundamental insights towards predictive models. Journal of Physics: Conference Series, 16:6579, 2005. [19] David Nagle, Denis Serenyi, and Abbie Matthews. The panasas activescale storage cluster: Delivering scalable high bandwidth storage. In Proceedings of the 2004 ACM/IEEE conference on Supercomputing, SC ’04, pages 53–, Washington, DC, USA, 2004. IEEE Computer Society. [20] Fabrizio Petrini, Wu-chun Feng, Adolfy Hoisie, Salvador Coll, and Eitan Frachtenberg. The quadrics network: High-performance clustering technology. IEEE Micro, 22:46–57, January 2002. [21] H. Shan and J. Shalf. Using IOR to analyze the I/O performance of XT3. In Proceedings of the 49th Cray User Group (CUG) Conference 2007, Seattle, WA, 2007. [22] Galen M. Shipman, David Dillow, Sarp Oral, and Feiyi Wang. The Spider center wide file system: From concept to reality. In Proceedings of the Cray User Group Conference, 2009. [23] Sun Microsystems. Lustre networking: High-performance features and flexible support for a wide array of networks. white paper, Sun Microsystems, 2008. [24] J.C. Sutherland. Evaluation of mixing and reaction models for large-eddy simulation of nonpremixed combustion using direct numerical simulation. Phd dissertation, Department of Chemical and Fuels Engineering, University of Utah, 2004. [25] Feiyi Wang, Sarp Oral, Galen Shipman, Oleg Drokin, Tom Wang, and Isaac Huang. Understanding Lustre Filesystem Internals. Technical Report ORNL/TM-2009/117, Oak Ridge National Lab., National Center for Computational Sciences, 2009. [26] Dong Xiang, Yi Pan, Qi Wang, and Zhen Chen. Deadlock-free fully adaptive routing in 2-dimensional tori based on new virtual network partitioning scheme. Distributed Computing Systems, International Conference on, 0:454–461, 2008.