Proceedings of the 29th Annual Hawaii International
Errors
Conference on System Sciences - I996
Hitting the Wall: in Developing and Debugging a “Simple” Spreadsheet Model Raymond R. Panko University of Hawaii
[email protected] spreadsheeting. In another article in this minitrack, Halverson and the author [Panko & Halverson, 19961 survey past experiments and field studies that have looked at errors. Perhaps the most significant fact in these studies is that every last study that has looked for errors has found them and has found them in disturbingly high numbers.
Abstract Undergraduate MS business students developed and debugged a spreadsheet modelfrom a wordproblem. This model consisted ofa bid to build a wall. The problem was designed to be relatively simple and domain-free, to address the concern that past spreadsheet experiments mqv have usedproblems that were too dtflcult or that required domain knowledge that subjects did not have. During the development phase, 72 subjects created the spreadsheet model. Even with this rather simple problem, 38% of the models contained an error. This high number of incorrect spreadsheets lwas not due to subjects making many errors. They only made 0.4 errors per spreadsheet. In addition, their cell error rate (CER) was only I. 7%, meaning that only 1.7% of their cells contained errors. Unfortunately, sprea&h#eets tend to have long cascades of ceils leading to the bonom line. This means that even tiny cell error rates will multiply into high rates of bottom-line errors. In a debugging phase, subjects tried to debug their own models. Of 19 subjects with incorrect models who did the debugging part of the experiment, only three (Ida%)found and corrected their errors. So even with a relatively simple model, development and debugging were problematic. This is a lower rate offinding errors than Galletta, et al. [I 993, I9961 found when subject,s debugged models created by the experimenter. This may mean that people are not as good at debugging their own models as they are at debugging models created by others.
The Need for a Slimpler Problem with Little Domain Knowledge This paper describes a new experiment using undergraduate students. One purpose was to see if the high error rates found in earlier experiments might be artifacts of problem difficulty and inadequate domain knowledge. For instance, the high error rates that Halverson and the author [Panko & Halverson, 19951 found for Cassandra errors was almost certainly due in part to lack of accounting knowledge. To probe this matter further, we developed a new problem for this study. This new problem requires very little domain knowledge. The Need to Understand the Debugging of One’s Own Spreadsheet Models A second purpose of the experiment was to increase our understanding of debugging errors. In programming, experiments have shown that people will only catch about half of all errors in a program during code inspection [Myers, 1976; Selby, 1985; Tjahjono, 19951. Recently, Galietta and his colleagues at Pittsburgh [1993, 19961 have conducted two experiments in spreadsheet debugging that had similar error rates. This is obviously an area meriting further study. We are especially interested in how well people do when they attempt to debug their own spreadsheet models. First, we suspect that errors will be worse when people debug their own spreadsheet models than when they debug models developed by others. The same mind set that caused them to make an error might cause them not to see the error later. In general, people seem to have
Introduction Spreadsheeting is enormously important in business. It is difficult to imagine a corporation making a key decision without “going through the numbers.” Spreadsheeting has been the second most widely used PC application overall and has been first among managers [Panko & Halverson, 19951. Unfortunately, there is considerable and growing evidence that errors are relatively common in
356 1060-3425196 $5.00 0 1996 IEEE
Proceedings of the 1996 Hawaii International Conference on System Sciences (HICSS-29) 1060-3425/96 $10.00 © 1996 IEEE
Proceedings of the 29th Annual Hawaii International a more difficult time proofreading their own typing than proofreading the typing of others. Second, the spreadsheets given to subjects to debug have been well-designed, making them easy to read. In contrast, the spreadsheet models produced by students and other novices often have poor design. For instance, instead of having separate cells for units sold, unit price, and sales revenues, subjects often jam this information into a single cell. This makes reading the model quite difficult. If spreadsheets are poorly designed, this might harm a subject’s ability to detect errors. In general, then, we expect spreadsheet debugging errors to be higher than Galletta et al. [ 1993, 19961 found.
Conference on System Sciences - 1996 worksheets. These presumably have higher error rates than other formula cells. In a final experiment measuring CERs, Lerch [198X] had 2 1 experienced Lotus l-2-3 users from industry build six spreadsheet modules apiece. The overall CER for formulas in this experiment was 11.3%. However the formulas were quite rich in references to cells in other rows, columns or both, and quite a few references were complex. The studies mentioned to now were ail experiments. But we do have data from one field audit. Hicks [ 19951 used our taxonomy of error types [Panko & Halverson, 19961 to measure the CER for a large module (3,856 cells) of a real-world spreadsheet program in its final auditing phase. His CER was 1.2%. Unlike experiments, this audit did not have independent check figures, so there could have been undetected errors. However the audit was done by a three-person team, and for each formula, the team looked at the algorithm before analyzing the formula in detail. It seems likely that most errors were detected. So although our sample of studies is still small, CERs to date have fallen into a fairly narrow range for experiments using students, for experiments using professionals, and for one real-world audit. These CERs, furthermore, are about as large as statement error rates in third-generation programming languages [Panko & Halverson, 19951. These high CERs are disturbing. Suppose you are computing a bottom-line value. And suppose that you have N cells in the cascade of cells leading to that bottomline value. Then the probability (P) of an error in the bottom-line cell will be the following [Lorge & Solomon, 19553:
Cell Error Rates Most early studies on spreadsheet errors merely reported the percentage of spreadsheet models containing any error. This is a rather blunt measurement. It does not tell us how many errors the models contained. Nor does it allow us to take into account the size of the sprea.dsheet model. Presumably, the likelihood of error will be larger in large spreadsheet models than in smaller ones. In an earlier paper, the author and Richard Halverson [ 19951 suggested that instead of just measuring what fraction of all spreadsheets have errors, we should look at the cell error rate (CER)---the percentage of cells in the spreadsheet that have errors. This suggestion was based on experiences in programming with third-generation languages. Statement error rates in third-generation languages are 3% to 7%. This range is well-established from numerous real-world code inspections [Panko & Halverson, 1994. If you multiply the statement error rate in programming by the length of the program, you can get a rough estimate of how many errors to expect in the program. We hoped that, by measuring CERs, we could allow professional spreadsheet developers to anticipate the number of errors in their spreadsheets. We computed CERs for our first study [Panko & Halverson, 19951. For general business students working alone, the mean CER was 5.5%. The CER was also high for accounting and finance students working alone (3.1%) and for general business students working in teams of four (2.0%). We also computed the CER for the Hassinen [ 1988, 19951 experiment using novice student programmers and found it to be 4.3% for formula cells. In a pair of studies using upper-division business students and graduate students in an Accounting Information Systems class, Janvrin and Morrison [ 19961 had much higher cell error rates of 6.6% to 16.8%, depending on the study and the treatment. However these tigures were for formula cells that were links to other
P = l- (I-CER)N It is easy to see that if you have a CER of even 1% in a cascade of only ten or twenty cells, then the probability that a spreadsheet model will have an error will be very close to 100%. Real-world spreadsheets may have even longer cascades. They also may have many cascades. You multiply the error probabilities of multiple cascades using a similar formula. If CERs really do fall into the range of about 1% to 5%, in fact, the real issue is not whether some large spreadsheetshave errors but rather how many errors they have on the average. If you have a model with 1000 cells, for instance, you would expect to have between 10 and 50 errors that are undetected by the developer. So it is important to understand whether the substantial CERs seen in earlier studies may have been due to problems simply being too complex for subjects to master.
357
Proceedings of the 1996 Hawaii International Conference on System Sciences (HICSS-29) 1060-3425/96 $10.00 © 1996 IEEE
Proceedings of the 29th Annual Hawaii International
Conference on System Sciences - 1996
Methodology
The Problem
The Sample
As discussed lin the introduction, we sought to develop a relatively simplle problem that would be relatively domain free. By “domain free,” we mean that it does not depend on specialized knowledge, such as accounting principles, beyond what the average person would be expected to know. We selected the following problem, which requires only elementary knowledge about profit margins, the computation of volume, the computation of hours worked, the computation of wages from hours worked and hourly wage, and fringe benefits.
The sample consisted of 72 upper-division undergraduate business students. All were MIS majors. All completed the work as a part of their class requirements. Subjects were allowed to do an alternative assignment instead of participating in the experiment. None elected to do so. In the post-experiment questionnaire (discussed below), subjects rated their spreadsheet expertise. The mean on a seven-point scale was 4.9. There was no difference between subjects who made errors and those who did not. Sixty-five percent used the three highest values on the scale. Another 24 percent selecteNdfour. Another question asked about the adequacy of their spreadsheet knowledge for the experimental task. Eightfive percent rated their spreadsheet knowledge as adequate. The rest said that their knowledge was barely adequate. None rated their knowledge as inadequate. This distribution seems reasonable, because the task only required basic spreadsheet skills.
You are to build a spreadsheet model to help you create a bid to build a wall. You will offer two options--lava rock or brick. Both walls will be built by crews of two. Crews will work three eight-hour days to build either type of wall. The wall will be 20 feet long, 6 feet tall, and 2 feet thick. Wages will be $10 per hour per person. You will have to #add20% to wages to cover fringe benefits.
Procedure
Lava rock will cost $3 per cubic foot. Brick will cost $2 per cubic foot.
The subjects did not work in the laboratory. Instead, we allowed them to take the experiment home in a sealed envelope. They were to open the envelope while sitting in front of a blank spreadsheet file. Then they were to open the packet and do the work. They had 45 minutes to do the task. Not using the control of laboratory work is controversial. However there was little incentive to cheat, because subjects knew that they would get full c.redit if they merely gave the task their best effort. In acldition, we feel that not doing the task in a laboratory ad.dedto realism. As a cross check, in another study we had 10 subjects do the development task in the laboratory. Thirty percent had errors, in contrast to 38% of the subjects who did the assignment on a take-home basis. in addition, we checked each of the 72 spreadsheets in this study to ensure that they were not merely copies of someone else’s work. The packet contained a consent form and a set of instructions. Both were explained in class before handing out the packet. The packet also contained a brief problem statement, which we present below. Finally, the packet also contained a post-expleriment questionnaire. This questionnaire asked about the subjects’ perceptions of the problem, the experiment experience, their performance, and their background.
Your bid must add a profit margin of 30% to your expected cost. In the post-experiment questionnaire, we asked respondents to rate the problem’s difficulty on a fivepoint scale, with Give being high. Sixty-three percent of the respondents choose1 or 2, and another 3 1% chose 3. Only 6% chose values at the high end of the scale. Subjects without errors had a mean of 2.25. Those with errors had a mean of 2.13. The difference was not statistically significant. We seemed to have succeeded in producing a relatively simple problem from the subject’s point of view. In the posttest, we also asked the subjects if they had sufficient time. Om a 7-point scale, only 9% said that they did not have sufficient time. Subjects without errors had a mean of 6.18; thos#ewith errors had a mean of 6.08. The difference was not statistically significant. We also asked the subjects, on a seven-point scale, whether they felt mnse and uncomfortable. Only seven percent agreed. There was again no statistically significant difference between subjects who committed errors and those who did not.
358
Proceedings of the 1996 Hawaii International Conference on System Sciences (HICSS-29) 1060-3425/96 $10.00 © 1996 IEEE
Proceedings of the 29th Annual Hawaii International Conference on System Sciences -
1996
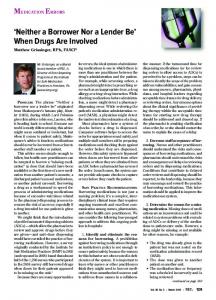
Results Figure 1: Model Solution for the Wall Problem Labor Hours Days per person Hours per day Hours per person People Hours Labor Cost Pay per hour Pay Fringe benefit rate Fringe benefits Labor cost Wall Volume Height Length Thickness Volume Materials Cost Cost per cubic foot Materials cost Total Cost and Bid Labor plus materials Profit margin Markup Bid
Spreadsheets with Errors 3 8 24 2 48
The simplest measure of errors is the fraction of all spreadsheetmodels that contained errors. In this study, of the 72 spreadsheetsdeveloped by the subjects, 27 had errors. This was an error rate of 38%. Although this was lower than the error rates found in past experiments, it was still quite high. Numbers of Errors
$10 $480 20% $96 $576
As in the case of our earlier study with Halverson [Panko & Halverson, 19951, although the fraction of spreadsheetswith errors was high, the subjects actually made very few errors. They only made only a total of 30 errors in all of their 72 models--only 0.4 errors per model. Even among models with errors, there were only 1.1 errors per model. Only two of the 27 models with errors had two errors. None had more. As the Halverson and the author [Panko & Halverson, 19951 discussed, the problem with spreadsheets is not that people make a large number of errors. It is that there are many cells on the logic cascades leading to the bottom line figures. As discussed earlier, even a tiny cell error rate will be multiplied over a logic cascade into a high probability of an error in bottom line values.
6 20 2 240 Brick $2 $480
Lava $3 $720
Brick Lava $1,056 $1,296 30% $317 $389 $1,373 $1,685
Cell Error Rate As discussed earlier, we are especially interested in the cell error rate or CER- the number of errors per hundred mode1 cells. In the current study, we based the number of cells on our model solution in Figure 1. In general, our subjects committed many violations of the author’s [Panko, 19881 design prescriptions, and as a result their models generally contained fewer cells than our model solution. We argue that the model solution in Figure 1 is more representative of the size of the problem. Computing the CER on actual cells in the subject solutions would have produced an even higher CER. The mode1 solution had 25 cells, so the 72 spreadsheetswould have had a total of 1,800 cells. The subjects made 30 errors, so the cell error rate was 1.7%. As expected, this cell error rate was lower than those in the past experiments mentioned above. This suggests that our problem was indeed simpler than past problems. However even this lower CER would still be fatal in the real world. In large models, having 1% to 2% of all cells in error would mean not just a high probability of an
Error Determination To count errors, we used a model spreadsheet solution. Figure 1 shows this solution. It follows the author’s [Panko, 19881 prescriptions for spreadsheet modeling. We compared the subjects’ models with the model solution. If there was no error, we recorded the fact. If the bottom line was incorrect, we identified the errors and changed them until the model was correct.
359
Proceedings of the 1996 Hawaii International Conference on System Sciences (HICSS-29) 1060-3425/96 $10.00 © 1996 IEEE
Proceedings of the 29th Annual .Hawaii International
Conference on System Sciences -
1996
In the author’s past experiment with Richard Halverson [Panko & Halverson, 19951, we noted that subjects made many distinct errors. This was only slightly less true in the current study. In the current study, one error did stand out. Of the thirty errors, eleven consisted of overlooking the fact that there were two people on each work crew. Nevertheless, the errors were still highly distributed. Only five other errors occurred twice. Nine of the errors occurred only once. So although one error was indeed rather common, there was still a wide distribution of distinct errors. This suggests that error-making tends to be a rather random occurrence and may occur any place. In model development, you cannot just take special care with the trickiest parts of the model. The single error that did occur frequently, furthermore, suggests a line of research. The error was made in a long item description in the problem statement presented earlier. This may have produced cognitive overload. Future experiments might vary sentence wording to see if this is, in fact, the case.
elude detection and represented a disproportionate share of foal errors. In this study, 17 of the 30 errors (57%) were omission errors. Eleven were the omission described aboveignoring the fact that there were two people in each crew. So omission errors are indeed important. The remaining 13 errors were logic errors. It is interesting that of the distinct errors committed by only a single person, all nine were logic errors. So logic errors were relatively common and diverse. We did not count any mechanical errors. This means that in the 864 numerical cells, there was not a single uncorrected error. Among the 936 formula cells, there were no counted mechanical errors, but some of the logic errors may have been mechanical errors. In any case, the rate of mechanical errors was either zero or extremely low. For omission errors, which can occur in either formula or numerical cells, the cell error rate was 0.9%. For logic errors, which are computed on the basis offormula cells, the CER was 1.4%. These rates are lower than those of the experiments described earlier. This was expected, given the simpler nature of the model. However the cell error rates in this study were not enough lower than those in past studies to m,ake spreadsheeting safe. While reducing difficulty ,and domain knowledge reduced error rates, it did so only moderately.
Types of Errors
Debugging
Richard Halverson and the author [Panko & Halverson, 19951 argued that it is important to distinguish between different types of errors. First, there are mechanical errors, such as pointing to the wrong cell or typing a number incorrectly. Second, there are logic errors, in which the developer uses the wrong algorithm or expresses it incorrectly. We argued, from past research, that logic errors should be more common, because they are quite clifflcult to catch. In fact, they were several times more common than mechanical errors. Mechanical errors occurred in 1.8% of the cells for general business students working alone [Panko & Halverson, 19951. In turn, logic errors (ignoring one unusual “Cassandra” error) occurred in 4.1% of the formula cells [Panko & Halverson, 19951. Based on subsequent reflection, and based on work by Allwood [ 19841 on statistics errors, we now believe that it is important to use a third category of errors, namely omissions [Panko & Halverson, 19961. In omission errors, the subject does not include something in the model that should be there. Allwood [ 19841 found that omission errors are resistant to detection. So although his subjects did not make omission errors frequently while developing their problem solutions, these errors tended to
Galletta and his colleagues [Galletta, et al., 1993, 19961 conducted hvo studies in which subjects debugged spreadsheetsthat were seeded with errors. The subjects in the first study were 30 CPAs and 30 MBA students. The subjects in the second study were 113 MBA students. In these two experiments, the subjects missed about half of the errors. lm addition, no subject found all of the errors in either stud:y. As noted earlier, this is comparable to the detection rates in experiments on detecting errors in the debugging of third-generation programming languages. In our study, most subjects were given their models back with instructions to debug them. We did not tell them whether there was an error in their specific models. To assist them, we gave subjects 20 minutes of instructions on how to debug spreadsheets. None of the subjects with correct spreadsheets made any changes. Of the 27 subjects with incorrect spreadsheets, 19 attempted to correct their spreadsheets. (Six others were in a class that was not given the opportunity to reexamine their models. Two others were absent for the debug,ging instruction and so could not be included without harming comparability.)
error in the bottom line but also a high number of errors per model. Number of Distinct Errors
360
Proceedings of the 1996 Hawaii International Conference on System Sciences (HICSS-29) 1060-3425/96 $10.00 © 1996 IEEE
Proceedings of the 29th Annual Hawaii International
Development Phase 72 27 38% 0.4 30 17 13 0 1.7% 0.9% 1.4%
Debugging Phase Debugged spreadsheets with errors Correctly fixed, number Correctly fixes, percentage
1996
accuracy to the spreadsheet and various measures of prior knowledge. Taking a .05 cutoff, which is generous with so many inferences, two of the three distinguishing questions involved perceptions of the best group size. When asked for the best number of people to have done the model development, subjects with errors had a mean of 1.7 people, while for subjects without errors, the mean was 1.3. Similarly, subjects with errors were slightly more likely to disagree with the statement that one person was the right number for the development project. This suggests that the subjects who made errors were somewhat lacking in confidence after the experiment. The third variable reinforces this interpretation. Subjects with errors were slightly more likely to say that they had a general direction but had problems with the specifics. All three of these differences, while statistically significant, involved very small differences on the independent variables. So giving people questionnaires to assess whether or not they will make errors does not look like a promising approach. These results seem to suggest that error-making has a strong random element. The same people who made errors in this experiment might be the people with correct spreadsheets in another experiment.
At a Glance
Number of subjects Spreadsheets with errors, number Spreadsheets with errors, percent Errors per spreadsheet Total errors Omission errors Logic errors Mechanical errors CER (ceil error rate) overall CER for omission errors CER for logic errors (computed for logic cells only)
Conference on System Sciences -
19 3 16%
As discussed above, we expected our subjects to do poorly because they were debugging their own models and because their models tended to be difficult to read. Indeed, only three of the 19 subjects with errors (Ji6%) corrected their spreadsheets. Another 12 made no changes. The remaining 5 made some changes but still did not get the correct answer. One corrected a single error in a spreadsheet with two errors. Another began with two errors and ended with three. Overall, our results add to the evidence that detecting spreadsheet errors is very difficult. Our results also suggest that when people correct their own spreadsheets, they may do even worse than when they correct wellformed models seeded with errors by the experimenter.
Conclusion We used a problem designed to be simpler and more domain-free than the problems used in past spreadsheet development experiments. Yet our subjects still made errors in 38% of their models. Although their cell error rate (CER) was very low-only 1.7 errors in every hundred cells-cascades of cells leading to bottom line cells multiplied these low cell error rates into a large number of bottom line errors. So even with a relatively simple and domain-free problem, the CER was over 1%. Even higher CERs have been seen in past experiments. The one field audit that reported CER found a 1.2% CER. Given such CERs, the issue probably is not how many spreadsheets have errors but how many errors there are likely to be in each large spreadsheet. Hicks’ welldeveloped spreadsheet with 3,856 cells, for instance, contained 45 errors. Programmers have long known that they have similar error rates per statement when a programmer has “finished” a program or module [Panko & Halverson, 19951. As a result, programmers use development disciplines that call for spending about a third of their time testing the program against test data and conducting
Who Makes Errors? Can we distinguish between people who make errors and people who do not? In general, the questions that we asked on the post-experiment questionnaire provided little power to distinguish people who built correct spreadsheets from those who did not. We asked 36 questions that might have distinguished between the two groups of subjects. Only three showed statistically significant differences between the two groups. Among those that did not were confidence in the
361
Proceedings of the 1996 Hawaii International Conference on System Sciences (HICSS-29) 1060-3425/96 $10.00 © 1996 IEEE
Proceedings of the 29th Annual Hawaii International
Conference on System Sciences -
1996
Accounting Management Information Technology (3:2) 1993. Galletta, D. F.; Hartzel, K. S.; Johnson, S.; Jospeh, J.; & Rustagi, S. “An Experimental Study of Spreadsheet Presentation and Error Detection.” Proceedings ofthe Twenty-Ninth Hawaii International Conference on System Sciences, Maui, Hawaii, January 1996. Hassinen, K. An Experimental Study of Spreadsheet Errors Made by Novice Spreadsheet Users, Department of Computer Science, University of Joensuu, P. 0. .Box 111, SF-80101 Joensuu, Finland, 1988. Hassinen, K., University of Joensuu, private communication1 with the author, January 1995. Hicks, L., NYNEX: Corporation. Private communication with the author, June 1995. Janvrin, D. & Morrison, J., “Factors Influencing Risks and Outcomes lin End-User Development,” Proceedings ofthe Twenty-Ninth Hawaii International Conference on System Sciences, Maui, Hawaii, January 1996. Lerch, F. J., Computerized Financial Planning: Discovering Cagnitive D@culties in Model Building, Ph.D. dissertation, The University of Michigan, 1988. Lorge, I. & Solomon, H. “Two Models of Group Behavior in the Solution of Eureka-Type Problems,” Psychometrika (20:2) June 1955, pp. 139-148. Myers, G. J., “A Controlled Experiment in Program Testing and Colde Walkthroughs/lnspections,” Communications of the ACM, (2 1:9) pp. 760-768. Panko R. R. End User Computing: Management, Applications, and Technology, Wiley, New York, 1988. Panko, R. R. & Ha’lverson, R. H., Jr., Patterns of Errors in Spreadsheet Development I: Quantitative Errors, Working Paper.,Department of Decision Sciences, College of Business Administration, University of Hawaii, 2404 Maile Way, Honolulu, HI 96822, March 1995. Available in Word for Windows format via anonymous ftp. The URL is ftp:Nsplicer2.cba.hawaii. edu/panko/sserrors/sswpmar.doc Panko, R. R. & Hallverson, R. H., Jr. “Spreadsheets on Trial: A Framework for Research on Spreadsheet Risks,” Proceedings of the Twenty-Ninth Hawaii International Conference on System Sciences, Maui, Hawaii, January 1996. Selby, R. W., Evaluations of Sofiare Technologies: Testing, Cleanroom, and Metrics, Ph.D. thesis, University of Maryland at College Park, Department of Computer Science, 1985. Tjahjono, Danu, Ph.D. student, University of Hawaii, personal communication with the author, June 1995. Results of dissertation research.
cell-by-cell inspections with teams of programmers. If they do this, they know, they can get error rates down to about 2 incorrect lines of code in each thousand [Panko & Halverson, 19951. Unfortunately, surveys of spreadsheet developers have shown that independent audits are rare and that data testing with extreme values is also uncommon [Panko & Halverson, 19961. In addition, data on spreadsheet (and programming) debugging indicates that only team inspections are likely to succeed. In general, it seems that we will need the kinds of deep debugging seen in professional programming for important spreadsheets. This will involve sophisticated data testing and team code inspections. In fact, we will have to rethink the entire development process. Professional programmers have to conduct team design inspections before they ever begin to code. In contrast, surveys show that most spreadsheeters spend very little time planning before they start filling in cells on a spreadsheet. Perhaps spreadsheeters have felt that their models are small compared to the programs of professional programmers, but we know that many spreadshei!ts are quite large [Panko & Halverson, 19961. We also know that spreadsheeters often have considerable difficulty when they try to understand even their own spreadsheets and often have problems finding appropriate ways of handling computational tasks [Hendry & Green, 19941. Quite simply, spreadsheeting is quite a bit like programming. Fortunately, if our goal is to teach spreadshee:tershow to develop spreadsheets professionally, we may be able to draw on what we already know about program development. Although not everything in program development will carry over to spreadsheet development, in a real sense, teaching spreadsheeters how to develop their spreadsheets better will be “teaching new dogs old tricks.”
References Allwood, C. M. “Error Detection Processes in Statistical Problem Solving,” Cognitive Science (8:4) OctoberDecember 1984, pp. 4 13-437. Hendry, D. G. & Green, T. R. G. “Creating, Comprehending, and Explaining Spreadsheets: A Cognitive Interpretation of What Discretionary Users Think of the Spreadsheet Model,” international Journal of Human-Computer Studies (40:6) June 1994, pp. 1033-1065. Galletta, D. F.; Abraham, D.; El Louadi, M.; Lekse, W.; Pollalis, Y. A.; & Sampler, J. L. “An Empirical Study of Spreadsheet Error-Finding Performance,”
362
Proceedings of the 1996 Hawaii International Conference on System Sciences (HICSS-29) 1060-3425/96 $10.00 © 1996 IEEE
Proceedings
Dr. Raymond
qf the 29th Annual Hawaii International Conference on System Sciences - 1996 Honolulu, HI 96822. His Internet email address is
[email protected]. His telephone number is (808) 9565049. His fax number is (808) 956-9889. His home page is http://www.cba. hawaii.edw/panko
R. Panko
Ray Panko is a fill professor of business administration in the College of Business Administration of the University of Hawaii. The address is 2404 Maile Way,
363
Proceedings of the 1996 Hawaii International Conference on System Sciences (HICSS-29) 1060-3425/96 $10.00 © 1996 IEEE