Establishment of Validation Methods to Test the Biocompatibility of TiO2
Bull. Korean Chem. Soc. 2013, Vol. 34, No. 6 1857 http://dx.doi.org/10.5012/bkcs.2013.34.6.1857
Establishment of Validation Methods to Test the Biocompatibility of Titanium Dioxide Mi-Ju Kim,a Hee-Joung Lim,†,a Byung Gun Lee,‡ Jong-Hoon Kim,† Jinsub Choi,‡,* and Hee-Gyoo Kang* Department of Biomedical Laboratory Science, College of Health Science, Eulji University, Seongnam 461-713, Korea * E-mail:
[email protected] † Laboratory of Stem Cell and Tissue Regeneration, Division of Biotechnology, College of Life Science & Biotechnology, Korea University, Republic of Korea ‡ Department of Chemical Engineering and Biotechnology, Inha University, Incheon 402-751, Korea. *E-mail:
[email protected] Received March 4, 2013, Accepted April 10, 2013 Most of biomaterials come in direct contact with the body, making standardized methods of evaluation and validation of biocompatibility an important aspect to biomaterial development. However, biomaterial validation guidelines have not been fully established, until now. This study was to compare the in vitro behavior of osteoblasts cultured on nanomaterial TiO2 surfaces to osteoblast behavior on culture plates. Comparisons were also made to cells grown in conditioned media (CM) that creates an environment similar to the in vivo environment. Comparisons were made between the different growth conditions for osteoblast adhesion, proliferation, differentiation, and functionality. We found that the in vivo-like system of growing cells in concentrated CM provided a good validation method for biomaterial development and in vivo implant therapy. The TiO2 materials were biocompatible, showing similar behavior to that observed in vivo. This study provided valuable information that would aid in the creation of guidelines into standardization and evaluation of biocompatibility in TiO2 biomaterials. Key Words : Biomaterials, Titanium dioxide, Biocompatibility, Validation, Conditioned media
Introduction Maintaining bone mass is critical for the integrity of the skeleton, which protects soft tissues, supports locomotion, acts as a scaffold for muscle attachment, and is a reservoir for mineral ions.1 Bone contains three distinct cell types: osteoblasts (bone-forming cells), osteoclasts (bone-resorbing cells), and osteocytes (mature osteoblasts embedded in mineralized bone matrix). Bone remodeling consisting of a continual process of bone destruction and resorption by osteoclasts coupled with bone deposition by osteoblasts begins early in foetal life. After the skeleton is fully formed in young adults, almost all of bone metabolic activity occurs during remodeling. In addition, osteoblasts are responsible for deposition of collagen and other proteins that form the organic bone matrix. This matrix consists of approximately 90% type I collagen and 10% non-collagenous proteins such as osteocalcin (OCN), matrix Gla protein, bone sialoprotein, osteopontin (OPN), and fibronectin.2 Osteoblast differentiation can be subdivided into three stages: proliferation, extracellular matrix (ECM) synthesis and maturation, and mineralization.3 Each stage is characterized by the expression of specific osteoblast markers. The most commonly identified markers of osteoblast differentiation include alkaline phosphatase (ALP), type I collagen (Col I), OPN, bone sialoprotein, and OCN. In this studies using MC3T3-El cell line, which is a clonal a
These authors contributed equally to this work.
osteoblast-like mouse calvarial cell line, secrete growthregulating factors including insulin-like growth factor (IGF) type I, IGF-α, and transforming growth factor β.4 These growth factors are secreted into the extracellular fluid and may act acutely in an autocrine or paracrine manner on osteoblast precursors (or other cells) in the vicinity. These factors might also be released from the bone matrix during resorption and act in a delayed paracrine manner on osteoblasts and osteoblast precursors. Many studies focus on controlling implant surface characteristics and chemical composition to control bone healing around dental implants.5-8 One material that has been extensively studied is titanium (Ti). The material and mechanical characteristics of Ti metal, which has a thin native oxide layer of titanium dioxide (TiO2), make it an ideal orthopedic material that bonds directly to the adjacent bone surface.9,10 Fabrication of nanostructured TiO2 arrays is a current subject of investigation because of the wide range of TiO2 applications in solar cells,11-14 photocatalysis,15-17 photoelectrolysis,18 sensors,19,20 and biomaterials.21-23 In the field of biomaterials, research has shown that TiO2 is highly biocompatible. The presence of a vertically aligned TiO2 nanoporous surface on Ti foils improves proliferation and mineralization of osteoblasts22 and enhances mobility, vasodilation, and monolayer formation of endothelial cells.23 Oh et al. recently reported that TiO2 nanotube structures are capable of inducing a significant acceleration in the growth rate of osteoblast cells by as much as 300-400% compared with plain Ti surfaces.22
1858
Bull. Korean Chem. Soc. 2013, Vol. 34, No. 6
Experimental MC3T3-E1 Cell Culture. MC3T3-E1 mouse osteoblast cells (CRL-2593, ATCC, USA) were cultured in growth medium consisting of alpha minimum essential medium (Invitrogen, USA) supplemented with 10% foetal bovine serum (Invitrogen) and 1% penicillin-streptomycin (Lonza, USA).28 MC3T3-E1 cells were seeded into 12-well polystyrene plates alone (Corning, USA) and onto the experimental substrate of interest (TiO2) within polystyrene plates at a density of 2 × 10⁴ cells/mL. The cells were incubated at 37 °C and 5% CO2. Induction of osteoblastic differentiation was initiated 48 h after seeding by changing the culture media to differentiation media containing 50 nM ascorbic acid (Sigma, USA) and 2.5 μM beta-glycerophosphate (Sigma).24 Differentiation media was changed every 2 days during the 5 day differentiation period. We cultured the cells in triplicate on each culture substrate and at each experimental time point (1, 3, and 5 days after osteogenic supplement treatment). Formation of 100-nm TiO2 Nanotubes. Nanotubes with a thickness of 1 μm on a Ti sheet (0.5 mm thick, 98%) were prepared with a mixture of 1 M H3PO4 (Sigma) and 0.3 wt % HF (Sigma) at 20 V for 60 min. Note that inner and outer diameters of nanotubes are 90 and 100 nm, respectively. After anodization (Kiethley, USA), the samples were rinsed with deionized water. We performed morphological characterization of the sample surfaces using a field emission SEM (Hitachi, Japan). The nanotube surface composition was characterized by SEM/EDS (Hitachi). The resulting TiO2 nanotubes were cleaned with ethanol and rinsed in phosphate-buffered saline (PBS) solution three times for 15 min prior to cell plating.25 Preparation of Conditioned Medium (CM). MC3T3-E1 cells (1 × 10⁶ cells) were cultured for 24 h until they reached confluence in T-75 flasks (SPL, Korea). The confluent cells were further cultured for a maximum of 9 days in differentiation media. CM was pooled depending on the day of collection; days that media was pooled included 0-3, 3-6, and 6-9. The collected CM was centrifuged at 380 × g for 10 min to remove floating cells and cell debris. Media was then frozen at −70 °C until further use.26 We created a 1:1 concentrated CM for each of the pooled samples by concentrating the CM 20-fold using a 10-kDa Amicon filter device (Millipore, USA) centrifuged at 4000 × g for 30 min. Cell Viability and Cell Proliferation Assay. Cell viability was confirmed using the XTT Cell Proliferation Kit II (Roche Diagnostics, Germany). This assay measures the conversion of XTT to a formazan dye by electron coupling in metabolically active mitochondria using the coupling reagent N-methyldibenzopyrazine methyl sulfate. An increase in the number of living cells will result in an increase in the overall activity of mitochondrial dehydrogenases in the samples. Briefly, we thawed the XTT labeling reagent and electron-coupling reagent in a water bath at 37 °C to obtain a clear solution. We mixed 5 mL XTT labeling reagent with
Mi-Ju Kim et al.
0.1 mL electron coupling reagent. After the incubation period, we added XTT labeling mixture to a final concentration of 0.3 mg/mL. The samples were incubated for 4 h to allow orange formazan solution to form. The solutions were measured at a wavelength of 450 nm using a Genios enzymelinked immunosorbent assay (ELISA) reader (Tecan, Switzerland). We performed a cell proliferation assay using a colorimetric BrdU kit (Roche Diagnostics, Germany) following the manufacturer’s protocols. After each incubation time, BrdU labeling solution (1:100) was added into the medium and incubated for 4 h at 37 °C. The medium was discarded after 4 h and cells were fixed with FixDenat solution (Roche Diagnostics, Germany) for 30 min at room temperature. After removing FixDenat, cells were incubated with freshly diluted 1:100 anti-BrdU peroxidase solution for 1 h 30 min. The cells were washed three times with PBS and a tetramethyl-benzidine substrate solution was added for 2 min. Finally, 1 M H2SO4 was added to terminate the reaction. The solution was measured at a 450-nm wavelength using a Genios ELISA reader (Tecan, Switzerland). Alkaline Phosphatase and Osteocalcin Activity. We used the TRACP and ALP Assay Kit (Takara, Japan) to measure ALP activity following the manufacturer’s protocols. The samples were washed with PBS and the cells were lysed using an extraction solution. We added 12.5 mM pnitro-phenyl phosphate substrate solution and incubated the solution for 1 h at 37 °C. After 1 h, 0.9 N NaOH was added to stop the reaction. ALP activity was evaluated by determining the amount of nitrophenyl released through the enzymatic reaction by measuring the wavelength at 405 nm using a Genios ELISA reader (Tecan, Switzerland). We used a Mouse Osteocalcin EIA kit (Biomedical Technologies INC., USA) to quantitatively measure the level of OCN within the culture supernatant. Test samples were collected from the spent media every 2 days over the 5-day culture period. Sample media and the biotinylated secondary antibody were incubated for 18 h at 4 °C in 96-well tissue culture plates coated with primary antibody. The test samples were then carefully removed and the wells were washed three times with PBS. Streptavidin-Horseradish Peroxidase reagent was added to each of the wells and the solution was incubated for 30 min at room temperature. Reagents were carefully removed once more and the wells washed three times with PBS. One volume of tetramethyl-benzidine solution was mixed with one volume of hydrogen peroxide solution and added to each well. The wells were incubated in the dark for 5 min at room temperature followed by the addition of stop solution to each well and measurements at a wavelength of 450 nm using a Genios ELISA reader (Tecan, Switzerland). Mineralization Assay. Mineralization was investigated using Alizarin Red-S staining. The samples were first washed with PBS and fixed in ice cold 70% ethanol for 1 h. After fixing, the samples were then washed three times with dH2O and stained with 40 mM Alizarin Red-S (Sigma) for 20 min at room temperature.27 After several washes with dH2O,
Establishment of Validation Methods to Test the Biocompatibility of TiO2
Bull. Korean Chem. Soc. 2013, Vol. 34, No. 6
1859
Table 1. Primers used for real-time RT-PCR Gene
Forward primer sequence (5'-3')
Reverse primer sequence (5'-3')
Type I collagen Osteopontin (OPN) Osteocalcin (OCN) Osteonectin (ON) GAPDH
CCCTGCCGGAGAAGAAGGAA GTTTGGCATTGCCTCCTCCC GCGGCCCTGAGTCTGACAAA ACCCTGGAGGGCACCAAGAA CCCTGGCCAAGGTCATCCAT
GGGAAACCACGGCTACCAGG GGTCAGGCACCAGCCATGTG CTCCAAGGTAGCGCCGGAGT CAGGCAGGGGGCGATGTATT CAGCTTTCCAGAGGGGCCAT
Product size (bp) 109 113 84 81 116
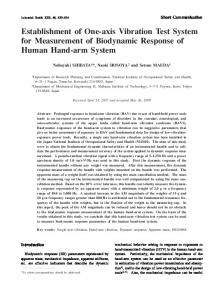
images were acquired. Quantitative analysis was performed by dissolving the stain in 10% cetylpyridinium chloride (Sigma) for 1 h. The absorbance was read at 590 nm by an Ultrospec 3100pro spectrophotometer (Amersham Biosciences, USA). Real-Time Reverse Transcription-Polymerase Chain Reaction (RT-PCR) Analysis. Total RNA was isolated and cDNA was generated using a First Strand cDNA Synthesis Kit (Fermentas, USA) in a standard 20 μL reaction using 0.3 mg of the total RNA. All cDNA was subjected to PCR to measure glyceraldehyde 3-phosphate dehydrogenase (GAPDH) mRNA as a test of RNA integrity and cDNA synthesis. Subsequently, equal volumes of cDNA were used to program real-time PCR reactions specific for mRNAs encoding Col I, OPN, ON, and OCN. We used the housekeeping gene GAPDH as a control. Primer sequences and product sizes that were used are described in Table 1. Reactions were performed using a customized KAPA SYBR FAST qPCR Kit (Kapabiosystems, USA) and thermocycling was performed in an ABI 7000 real time thermocyler (Applied Biosystems, USA). Relative mRNA abundance was determined by the 2−ΔΔCt method and reported as fold induction. GAPDH abundance was used for normalization. Statistical Analyses. Results are presented as mean ± standard error of the mean and statistical significance was evaluated with a paired Student’s t-test. Differences of *p < 0.05 and **p < 0.01 compared with the respective control were considered statistically significant. Results and Discussion Highly Uniforms of the 100-nm TiO2 Nanotube Surface. Figure 1(a) shows scanning electron microscope (SEM) images of TiO2 layers obtained 100-nm diameter nanotubes. The anodized nanotube surface had a well-defined and structurally sturdy morphology. The maximum size of the TiO2 nanotube diameter was limited to 100 nm to unify the experimental conditions and the composition of the electrolyte solution. We used flat Ti substrates with a native TiO2 layer that had a chemical composition analogous to the TiO2 nanotube surface as the control. A composite of the TiO2 nanotube surface was obtained by SEM/energy dispersive xray spectroscopy (EDS). Figure 1(b) and Table 2 show that the deposited surface was made up if Ti, O, F, and C. The atomic ratio of Ti/O was 2.25 determined by EDS, which indicated the formation of nearly stoichiometric TiO2. Cell Viability and Cell Proliferation. Day 1 showed no significant differences between the groups in either assay
Figure 1. The 100-nm TiO2 nanotube surface was physically characterized. (a) A field emission scanning electron microscope (S-4700, Hitachi) was used to morphologically characterize the sample surfaces (magnification: ×50,000). (b) Energy dispersive xray spectroscopy analysis of the TiO2 nanotube surface shows the presence of Ti and O.
(Figure 3). Cell proliferation and viability significantly increased after 3 days; however, in all groups, cell proliferation and viability subsequently decreased after 5 days. At day 3, cell proliferation increased in cells grown on culture plates with 1:1 CM compared to the control (p < 0.01). Proliferation also increased at day 3 in cells grown on the TiO2 surface with 1:1 CM compared to the control (p < 0.05). Cell proliferation results were confirmed by XTT assay. Cells on the TiO2 surface with CM showed similar results (p < 0.05). Alkaline Phosphatase Activity. ALP is an early marker of osteoblast differentiation and plays a major role in bone formation and mineralization. Figure 4 shows ALP activity
1860
Bull. Korean Chem. Soc. 2013, Vol. 34, No. 6
Mi-Ju Kim et al.
Table 2. Chemical compounds present on the TiO2 nanotube surface were identified by energy dispersive x-ray spectroscopy Elements
Weight (%)
Atomic (%)
Ti O F C Others
50.08 37.56 6.18 2.00 4.18
25.86 58.07 8.05 4.12
Total
100
Figure 3. Conditioned media (CM) has an effect on proliferation of MC3T3-E1 cells grown on culture plates and TiO2 surfaces. (a) XTT assay and (b) BrdU assay were used to compare proliferation for each group. Proliferation was assessed at 1, 3, and 5 days. Bars represent mean ± standard error of the mean for each group. A *p < 0.05 and **p < 0.01 compared with control are considered statistically significant.
Figure 2. Conditioned media (CM) has an effect on alkaline phosphatase (ALP) activity in MC3T3-E1 cells depending on the time of harvest. (a) ALP activity is shown for MC3T3-E1 cells in 50% CM collected at different incubation times. (b) ALP activity is shown for MC3T3-E1 cells in concentrated 1:1 CM collected at different incubation times. Bars represent mean ± S.E.M. for each group. A *p < 0.05 and **p < 0.01 compared with control are considered statistically significant.
in cells grown on culture plates and TiO2 surfaces for 1, 3, and 5 days. ALP activity increased gradually with time in cells grown on culture plates and TiO2 surfaces (p < 0.05). Significantly higher ALP activity was observed in cells grown on the culture plates with 1:1 CM versus the control (p < 0.01). ALP activity was enhanced in cells grown on the TiO2 surface with 1:1 CM (0.204 ± 0.013) compared to the control (0.178 ± 0.005); however, at 5 days, there were no significant differences between the groups. These results indicate that osteoblasts grown on culture plates and TiO2 surfaces with CM initiate expression of the mature osteoblastic markers at an earlier time point compared to cells grown in control media. Osteocalcin Concentration. OCN, a major non-collagen-
Figure 4. Conditioned media (CM) has an effect on alkaline phosphatase (ALP) activity of MC3T3-E1 cells grown on culture plates and TiO2 surfaces. ALP assays were performed at 1, 3, and 5 days. Bars represent mean ± standard error of the mean for each group. A *p < 0.05 and **p < 0.01 compared with control are considered statistically significant.
ous bone protein, is synthesized by osteoblasts during bone formation. Most secreted OCN is incorporated into the bone matrix, with a small amount secreted into circulation. Studies have shown that culture medium OCN levels are directly related to osteoblastic activity and bone formation. We show that secreted OCN concentrations increased gradually with time in cells grown on culture plates and TiO2
Establishment of Validation Methods to Test the Biocompatibility of TiO2
Bull. Korean Chem. Soc. 2013, Vol. 34, No. 6
1861
Figure 5. Conditioned media (CM) effects osteocalcin (OCN) activity of MC3T3-E1 cells grown on culture plates and TiO2 surfaces. OCN assays were performed at 1, 3, and 5 days. Bars represent mean ± standard error of the mean for each group. A *p < 0.05 and **p < 0.01 compared with control are considered statistically significant.
surfaces (p < 0.05; Figure 5). OCN was not detected at day 1 in the medium from cells grown on culture plates, TiO2 surfaces, or the controls. However, OCN was detected in cells grown with 1:1 CM. The concentration of OCN was significantly higher in cells grown on TiO2 surfaces with 1:1 CM (49.93 ± 4.27) than that of the control (21.30 ± 1.54, p < 0.01) at 3 and 5 days. There were no significant differences between the groups grown on culture plates. Extracellular Matrix Mineralization. Alizarin red S staining is used to evaluate calcium-rich deposits made by cells in culture. Calcification occurs at nucleation sites known as matrix vesicles, which are present in the lacunae of mineralizing cartilage. Accumulating Ca2+ and inorganic phosphate serve as nucleating agents for formation of hydroxyapatite [Ca10(PO4)6(OH2)2], the main inorganic component of bone. Staining of cultures in our study revealed that the cells appeared as small red areas, but no red-staining was observed on the culture plate or TiO2 surface at 1 day (Figure 6(a)). We observed an approximate 3- to 4-fold higher level of mineralization at day 3 versus day 1 (p < 0.01). CM induced significantly higher levels of mineralization by the differentiating osteoblast cells compared to control cells at day 5 (p < 0.05). These results demonstrate that CM has a stimulatory effect on mineralized nodule formation. Osteogenesis-Related Gene Expression. The rate of osteoblastic differentiation was examined by measuring the expression of osteoblastic marker genes at 1, 3, and 5 days (Figure 7). The genes tested included type I collagen and OPN as early stage markers, osteonectin (ON) as a midstage marker, and OCN as a late-stage marker. Culture daydependent fluctuations were observed for all of the genes tested. Gene expression of type I collagen and OPN was observed early in culture at 1 day. ON expression peaked at day 3 and OCN exhibited a delayed expression, with a peak at day 5. In this study, we evaluated MC3T3-E1 osteoblast cell proliferation and differentiation on TiO2 nanotube surfaces with CM to evaluate osteogenic differentiation through paracrine signaling. Because osteoblasts naturally secrete
Figure 6. Conditioned media (CM) effects mineralized nodule formation of MC3T3-E1 cells grown on culture plates and TiO2 surfaces. (a) Mineralized nodules were examined by Alizarin red staining. Alizarin red stains were performed at 1, 3, and 5 days. (b) The stain was dissolved in 10% cetylpyridinium chloride and colorimetric analyses were performed at 590 nm. Bars represent mean ± standard error of the mean for each group. A *p < 0.05 and **p < 0.01 compared with control are considered statistically significant.
cytokines, which play an important role during bone development and regeneration, paracrine signaling provided to the cells in vitro by CM could be used to optimize osteoblast differentiation. This optimization is necessary to develop clinically viable tissue-engineered devices. Nanotube formation involves two competing processes: electrochemical etch and chemical dissolution.28,29 Nanotubes are created by initially forming an initial oxide layer on Ti surfaces due to the interaction of Ti4+ and O2− ions. This is followed by pit formation as a result of localized dissolution by F− ions. Pits are converted to larger pores and the pore growth occurs due to inward movement of the oxide layer. Further oxidation and dissolution results in channel
1862
Bull. Korean Chem. Soc. 2013, Vol. 34, No. 6
Mi-Ju Kim et al.
Figure 7. Conditioned media (CM) effects osteogenesis-related gene expression of MC3T3-E1 cells grown on culture plates and TiO2 surfaces. Data were generated by real-time PCR and are shown as mean expression relative to GAPDH. Genes investigated included: (a) type I collagen (early-stage marker for osteoblastic differentiation), (b) osteopontin (early-stage marker), (c) osteonectin (mid-stage marker), and (d) osteocalcin (late-stage marker). Values are represented as mean ± standard error of the mean for each group.
formation. These channels eventually separate and give rise to nanotube structures. Osteoblasts are capable of producing and releasing numerous growth factors and cytokines, including bone morphogenetic protein-2 and transforming growth factor-β.30 Consequently, these factors are likely present in osteoblast-CM and may be responsible for the increase in osteogenic differentiation that we observed. Other growth factors produced by osteoblasts or found in bone that could have played a role in our results include IGF-1, IGF-2, platelet-derived growth factor, acidic fibroblast growth factor (FGF), and basic FGF.31 Like bone morphogenetic proteins, IGF-1 and IGF-2 act in an autocrine/paracrine manner to enhance both bone formation and resorption. Several reports suggest that IGF-1 and IGF-2 stimulate osteoblast proliferation and differentiation.32 FGFs are a family of growth factors that are potent regulators of cell proliferation, differentiation, and function.33 Basic FGF (FGF-2) is reported to have stimulatory effects on osteoblast proliferation and differentiation both in vitro 34 and in vivo.35 FGF-2 has also been shown to stimulate the production of calcified collagenous matrix by osteoblasts.36,37 Vascular endothelial growth factors are potent mitogens for endothelial cells and are secreted by osteoblasts and osteoblast-like cells during endochondral ossification, when angiogenesis is needed.38 Vascular endothelial growth factors indirectly induce osteoblast proliferation and differentiation
by stimulating endothelial cells to produce osteoanabolic growth factors.39 These factors may be involved in enhanced osteoblast activity of cells grown in osteoblast-CM in this study; however, regulation of cellular differentiation is complex and may involve numerous additional factors. Further study into the effect of CM on cells in a bioreactor system will important to investigate the various growth factors and cytokines in CM. Alkaline phosphatase is often used as a reflection of osteoblast activity. ALP is found at higher levels in matrix mineralizing cells, such as osteoblasts.40 As osteoblasts mature, they produce ECM vesicles, which are enriched with alkaline phosphatase specific activity.41 This makes alkaline phosphatase a good marker enzyme of osteoblastic differentiation. In our study, the cells exhibited enhanced osteoblast differentiation when grown on culture plates and TiO2 surfaces with CM compared to the control condition (without CM). Alizarin red S selectively binds calcium and is widely used to study tissue structure associated with calcium.42 Two moles of calcium ions quantitatively bind to a mole of Alizarin red S reagent.43 This allows for highly sensitive staining of calcification in vitro. We observed a red brown or dark brown stain during early culture when calcium was precipitated; this was followed by a progressively darker red color as more bone nodules formed in culture. Bruijin et al.
Establishment of Validation Methods to Test the Biocompatibility of TiO2
reported that calcification starts at the center portion of the bone nodule and that the size of the calcified area increased with time. Eventually, this calcification gives rise to a different phase that occurs between the non-calcified outside of the nodule and the highly calcified inside.44 Mineralization of the differentiating osteoblast cells on culture plates and TiO2 surfaces was significantly higher upon exposure to CM compared to the control groups (p < 0.05). This confirmed that CM has a stimulatory effect on mineralized nodule formation. Type I collagen is an essential component of the ECM that is required prior to mineralized matrix formation.45 In this study, the mRNA levels of type I collagen in cells grown on culture plates and TiO2 surfaces were increased at the early stages of differentiation. ON and OCN are secreted by osteoblasts and regulate mineralization and maturation.46,47 At day 5, OCN mRNA expression in cells grown on culture plates and TiO2 surfaces increased by approximately 80-fold and 60-fold respectively, compared to the same conditions at day 1. The observed increased OCN expression and alkaline phosphatase activity indicates that osteoblasts reached a more differentiated phenotype when grown on culture plates and TiO2 surfaces. Our results suggest that CM can induce conditions similar to the in vivo environment and can enhance differentiation of osteoblast cells. Ultimately, TiO2 nanotubes are biocompatible orthopedic materials that allow for excellent physical bonding to the surface of bone. Our in vitro results support that TiO2 materials are biocompatible and show similar behavior to that observed in vivo. This study provides valuable information that will aid in the creation of guidelines for fundamental research into standardization and evaluation of biocompatibility in TiO2 biomaterials. Acknowledgments. This work was supported by the BioMedtech Regional Innovation Center at Eulji University, under the Regional Innovation Center Program of Ministry of Commerce, Industry and Energy. References 1. 2. 3. 4. 5. 6. 7. 8. 9. 10. 11. 12.
Paul, J.; Victoria, S. Curr. Pharm. Des. 2001, 7, 613. Kim, H.; Anita, V.; Lynda, F.; Morten, A. Bone 2009, 44, 1026. Gary, S.; Jane, B. Endocrine. 1993, 14, 424. Saral, A.; Harold, L. M.; Thomas, A. L,; David, J. B.; Subburaman, M. J. Bone Miner Res. 1993, 8, 157. Kasemo, B. J. Prosthet. Dent. 1983, 49, 832. Nanci, A.; Wuest, J. D.; Peru, L.; Brunet, P.; Sharma, V.; Zalzal, S.; McKee, M. D. J. Biomed. Mater. Res. 1998, 40, 324. Davies, J. E. J. Dent. Educ. 2003, 67, 932. Albrektsson, T.; Wennerberg, A. Int. J. Prosthodont. 2004, 17, 536. Linder, L.; Carlsson, A.; Marsal, L.; Bjursten, L. M.; Branemark, P. I. J. Bone Joint Surg. 1988, 70, 550. Puleo, D. A.; Holleran, L. A.; Doremus, R. H.; Bizios, R. J. Biomed. Mater. Res. A 1991, 25, 711. Mor, G. K.; Varghese, O. K.; Paulose, M.; Shankar, K.; Grimes, C. A. Solar Energy Mater Solar Cells 2006, 90, 2011. Zhu, K.; Neale, N. R.; Miedaner, A.; Frank, A. J. Nano. Lett.
Bull. Korean Chem. Soc. 2013, Vol. 34, No. 6
1863
2007, 7, 69. 13. Shankar, K.; Mor, G. K.; Prakasam, H. E.; Varghese. O. K.; Grimes, C. A. Langmuir 2007, 23, 12445. 14. Kislyuk, V. V.; Dimitriev, O. P. J. Nanosci. Nanotechnol. 2008, 8, 131. 15. Albu, S. P.; Ghicov, A.; Macak, J. M.; Hahn, R.; Schmuki, P. Nano. Lett. 2007, 7, 1286. 16. Jia, Y.; Kleinhammes, A.; Kulkarni, H.; McGuire, K.; McNeil, L. E.; Wu, Y. J. Nanosci. Nanotechnol. 2007, 7, 458. 17. Su, H.; Dong, Q.; Han, J.; Zhang, D.; Guo, Q. Biomacromolecules 2008, 9, 499. 18. Maggie, P.; Karthik, S.; Sorachon, Y.; Haripriya, E. P.; Oomman, K. V.; Gopal, K. M.; Thomas, A. L.; Adriana, F.; Craig, A. G. J. Phys. Chem. B 2006, 110, 16179. 19. Liu, S.; Chen, A. Langmuir 2005, 21, 8409. 20. Varghese, O. K.; Grimes, C. A. J. Nanosci. Nanotechnol. 2003, 3, 277. 21. Park, J.; Bauer, S.; Vonder, M. K.; Schmuki, P. Nano. Lett. 2007, 7, 1686. 22. Seunghan, Oh.; Chiara, D.; Li-Han, C.; Thomas, R. P.; Rita, R.; Jin, S. J. Biomed. Mater. Res. A 2006, 78, 97. 23. Brammer, K. S.; Oh, S.; Gallagher, J. O.; Jin, S. Nano. Lett. 2008, 8, 786. 24. Juanli, G.; Ricardo, J. P.; Wallace, A.; Ingeborg, J. D.; Lyndon, F. C. Biomaterials 2007, 28, 5418. 25. Park, J.; Bauer, S.; Mark, K.; Schmuki, P. Nano. Lett. 2007, 7, 1686. 26. Akemichi, U.; Yukiko, K.; Keiji, M.; Hideo, I. Matrix. Biology 2001, 20, 347. 27. Wei-qiang, Y.; Xing-quan, J.; Fu-qiang, Z.; Ling, Xu. J. Biomed. Mater. Res. A 2010, 4, 1012. 28. Gong, D.; Grimes, C. A.; Varghese, O. K.; Chen, Z.; Hu, W.; Singh, R. S.; Chen, Zhi; Dickey, Elizabeth, C. J. Mater. Res. 2001, 16, 3331. 29. Zwilling, V.; Darque-Ceretti, E.; Bountry-Forveille, A.; David, D.; Perrin, M. Y.; Aucouturier, M. Surf. Interface Anal. 1999, 27, 629. 30. Gimble, J. M.; Nuttall, M. E. Endocrine 2004, 23, 183. 31. Mahmoudifar, N.; Doran, P. M. Biomaterials 2005, 26, 7012. 32. Linkhart, T. A.; Mohan, S.; Baylink, D. J. Bone 1996, 19, 1S. 33. Szebenyi, G.; Fallon, J. F. Int. Rev. Cytol. 1999, 185, 45. 34. Scutt, A.; Bertram, P. Calcif. Tissue Int. 1999, 64, 69. 35. Kawaguchi, H.; Kurokawa, T.; Hanada, K.; Hiyama, Y.; Tamura, M.; Ogata, E.; Matsumoto, T. Endocrinology 1994, 135, 774. 36. Spector, J. A.; Greenwald, J. A.; Warren, S. M.; Bouletreau, P. J.; Crisera, F. E.; Mehrara, B. J.; Longaker, M. T. Plast. Reconstr. Surg. 2002, 109, 631. 37. Zhang, X.; Sobue, T.; Hurley, M. M. Biochem. Biophys. Res. Commun. 2002, 290, 526. 38. Wang, D. S.; Yamazaki, K.; Nohtomi, K.; Shizume, K.; Ohsumi, K.; Shibuya, M.; Demura, H.; Sato, K. J. Bone Miner. Res. 1996, 11, 472. 39. Wang, D. S.; Miura, M.; Demura, H.; Sato, K. Endocrinology 1997, 138, 2953. 40. Laintinen, M.; Halttunen, T.; Jortikka, L.; Teronen, O.; Sorsa, T.; Lindholm, T. S. Life Sci. 1999, 64, 847. 41. Barbara, B. D.; Lohmann, C. H.; Dean, D. D.; Sylvia, V. L.; Cochran, D. L.; Schwartz, Z. Annu. Rev. Mater. Res. 2001, 31, 357. 42. McGee-Russel, S. M. J. Histochem. Cytochem. 1958, 6, 22. 43. Nakamura, T.; Yamanuro, T.; Higash, S.; Kokubo, T.; Itoo, S. J. Biomed. Mater. Res. 1985, 19, 685. 44. Bruijin, J. D.; Klein, C.; Groot, K.; Blitterswijk, C. A. J. Biomed. Mater. Res. 1992, 26, 1365. 45. Kim, J. H.; Cho, K. P.; Chung, Y. S.; Kim, O. S.; Chung, S. S.; Lee, K. K.; Lee, D. J.; Lee, K. M.; Kim, Y. J. J. Nanosci. Nanotechnol. 2010, 10, 3581. 46. Hunter, G. K.; Goldberg, H. A. Proc. Natl. Acad. Sci. 1993, 90, 8562. 47. Ganss, B.; Kim, R. H.; Sodek, J. Crit. Rev. Oral. Biol. Med. 1999, 1079.