Sep 27, 2011 - This article was downloaded by: [Steven R. Garrity]. On: 02 October 2011, .... (quaking aspen), Betula papyrifera Marsh. (paper birch), Quercus ...
This article was downloaded by: [Steven R. Garrity] On: 02 October 2011, At: 17:56 Publisher: Taylor & Francis Informa Ltd Registered in England and Wales Registered Number: 1072954 Registered office: Mortimer House, 37-41 Mortimer Street, London W1T 3JH, UK
Remote Sensing Letters Publication details, including instructions for authors and subscription information: http://www.tandfonline.com/loi/trsl20
Estimating plot-level tree structure in a deciduous forest by combining allometric equations, spatial wavelet analysis and airborne LiDAR a
a
a
Steven R. Garrity , Kevin Meyer , Kyle D. Maurer , Brady b
Hardiman & Gil Bohrer
a
a
Department of Civil, Environmental, and Geodetic Engineering, Ohio State University, Columbus, OH, 43210, USA b
Department of Evolution, Ecology, and Organismal Biology, Ohio State University, Columbus, OH, 43210, USA Available online: 27 Sep 2011
To cite this article: Steven R. Garrity, Kevin Meyer, Kyle D. Maurer, Brady Hardiman & Gil Bohrer (2012): Estimating plot-level tree structure in a deciduous forest by combining allometric equations, spatial wavelet analysis and airborne LiDAR, Remote Sensing Letters, 3:5, 443-451 To link to this article: http://dx.doi.org/10.1080/01431161.2011.618814
PLEASE SCROLL DOWN FOR ARTICLE Full terms and conditions of use: http://www.tandfonline.com/page/terms-andconditions This article may be used for research, teaching, and private study purposes. Any substantial or systematic reproduction, redistribution, reselling, loan, sub-licensing, systematic supply, or distribution in any form to anyone is expressly forbidden. The publisher does not give any warranty express or implied or make any representation that the contents will be complete or accurate or up to date. The accuracy of any instructions, formulae, and drug doses should be independently verified with primary sources. The publisher shall not be liable for any loss, actions, claims, proceedings, demand, or costs or damages whatsoever or howsoever caused arising directly or indirectly in connection with or arising out of the use of this material.
Remote Sensing Letters Vol. 3, No. 5, September 2012, 443–451
Estimating plot-level tree structure in a deciduous forest by combining allometric equations, spatial wavelet analysis and airborne LiDAR
Downloaded by [Steven R. Garrity] at 17:56 02 October 2011
STEVEN R. GARRITY∗ †, KEVIN MEYER†, KYLE D. MAURER†, BRADY HARDIMAN‡ and GIL BOHRER† †Department of Civil, Environmental, and Geodetic Engineering, Ohio State University, Columbus, OH 43210, USA ‡Department of Evolution, Ecology, and Organismal Biology, Ohio State University, Columbus, OH 43210, USA (Received 13 June 2011; in final form 25 August 2011) Object-oriented classification methods are increasingly used to derive plant-level structural information from high-resolution remotely sensed data from plant canopies. However, many automated, object-based classification approaches perform poorly in deciduous forests compared with coniferous forests. Here, we test the performance of the automated spatial wavelet analysis (SWA) algorithm for estimating plot-level canopy structure characteristics from a light detection and ranging (LiDAR) data set obtained from a northern mixed deciduous forest. Plot-level SWA-derived and co-located ground-based measurements of tree diameter at breast height (DBH) were linearly correlated when canopy cover was low (correlation coefficient (r) = 0.80) or moderate (r = 0.68), but were statistically unrelated when canopy cover was high. SWA-estimated crown diameters were not significantly correlated with allometrically based estimates of crown diameter. Our results show that, when combined with allometric equations, SWA can be useful for estimating deciduous forest structure information from LiDAR in forests with low to moderate (20 cm). 2.2 Field survey Measurements of DBH were acquired for all trees within sixty 16 m radius plots and one 60 m radius plot between June and August 2010. The 16 m radius plots were
Deciduous tree structure
445
Downloaded by [Steven R. Garrity] at 17:56 02 October 2011
Tree height and crown diameter (m)
35 Tree height (observed) Tree height (fitted) Crown diameter (observed) Crown diameter (fitted)
30 25 20 15 10 5 0
0
10
20
30
40
50
DBH (cm)
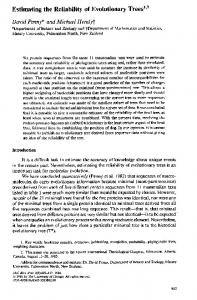
Figure 1. Allometric relationships between DBH and tree height (triangles and solid black line) and crown diameter (open circles and grey line). Data were obtained from three species in the UMBS forest. Tree height = 9.97 × log(DBH) – 12.61. Crown diameter = 2.67 × log(DBH) – 1.90.
arranged in seven transects radiating to the west (from 225◦ to 15◦ ) from the 60 m radius plot at 20◦ intervals (Schmid et al. 2003). Along each transect, plots were located using 100 m spacing between plot centres. Allometric relationships relating DBH to height and crown diameter were calculated using observations from 112 trees (35 bigtooth aspen, 38 red maple and 39 eastern white pine) with DBH greater than 3 cm randomly sampled from within the 60 m radius plot (figure 1). Tree height was trigonometrically determined using the angle of inclination to tree stem apex, which was measured with a digital protractor (Mitutoyo, Aurora, IL, USA) located at a fixed distance from the tree stem. Crown diameter was determined by measuring, on the ground, the visually estimated greatest distance spanning the tree’s crown. 2.3 LiDAR acquisition and processing LiDAR data were acquired in September 2009 for a 40 km2 area of the UMBS forest. LiDAR acquisition was performed by the National Center for Airborne Laser Mapping (NCALM) using a Gemini ALTM© laser scanner (Optech Inc., West Henrietta, NY, USA) mounted on a fixed-wing aircraft flying at approximately 600 m above ground level. The sensor acquired data with a pulse rate frequency of 125 kHz and a scan frequency of 40 Hz. The data were collected in 35 flight lines with 366 m swath width and 50% overlap, producing an average point density of 9.5 points/m2 . Ground-based global positioning system (GPS) check points (n = 1023) that were collected during the flight were compared with the nearest neighbour LiDAR shot and returned an average difference of 0.05 m with SD of 0.07 m. NCALM deliverables included a point cloud of laser returns and a digital elevation model (DEM) with 1 m spatial resolution created from ground returns. The point cloud was binned to the same grid as the DEM, and the highest return in each bin was registered. The field of highest returns was subtracted from the DEM to produce
S. R. Garrity et al. (b)
(c)
15
10
10
16
20
20
14
30
30
12
40
40
50
50
60
60
70
70
80
80
20 40 60 Pixel location (x)
80
10 8 6
Height (m)
Pixel location (y)
(a)
Height (m)
446
10
5
4 2 20
40 60 Pixel location (x)
80
0
0
20 40 60 Pixel location (x)
80
Downloaded by [Steven R. Garrity] at 17:56 02 October 2011
Figure 2. (a) Subset image of LiDAR-derived CHM. (b) CHM with SWA-detected trees is outlined in black circles. (c) Vertical profile of CHM taken from the row of pixels is denoted by the black line in (a).
the canopy height model (CHM). The CHM was further filtered so that canopy height values above the set minimum or maximum possible height (0 and 50 m) were replaced with the minimum or maximum value. There were less than 0.1% of the pixels that met this criterion. A 3 × 3 median filter was applied to the CHM to reduce within-crown height variability while still maintaining contrast at crown boundaries (Lillesand et al. 2004, Coggins et al. 2008). Figure 2(a) illustrates a subset of the resulting CHM within the UMBS forest. 2.4 Spatial wavelet analysis The automated object-oriented SWA algorithm (Strand et al. 2006) was used to automatically detect the location and crown diameter of individual trees within the CHM (figure 2(a)). Similar to previous studies that used SWA for detecting vegetation objects in imagery (Strand et al. 2006, Garrity et al. 2008, Smith et al. 2008) and LiDAR (Falkowski et al. 2006, 2008), we used a two-dimensional Mexican hat wavelet mother function. SWA works by convolving a series of increasingly larger wavelets, each with an identical form as the mother function, with the CHM using a dilation scale ranging from 2 to 12 m and a step size of 0.25 m. SWA output consisted of the spatial coordinates (x, y) within the CHM of identified crown centre locations accompanied by the optimal dilation scale. The optimal dilation scale of each detected tree corresponds with the crown diameter and is identified by goodness-offit scores between wavelet dilation size and image object size (figure 2(b)). Additional details of the SWA algorithm are described by Falkowski et al. (2006) and Strand et al. (2006). 2.5 Data analysis Geographic coordinates from the centre of each field survey plot were used to locate plots within the CHM. The CHM was split into sixty 30 m × 30 m subsets and one 120 m × 120 m subset, where each subset was geographically co-located with a plot. The SWA algorithm was applied to each subset to automatically detect the location of crown centres and crown diameters. At the location of each detected crown centre, height was obtained from the CHM and converted to DBH using the allometric relationship developed for the UMBS forest (see figure 1). The mean allometrically
Downloaded by [Steven R. Garrity] at 17:56 02 October 2011
Deciduous tree structure
447
derived DBH was calculated for each plot. Similarly, the TreeVaW software was used to automatically identify individual tree heights within the entire CHM. Subsets of the TreeVaW output were extracted from co-located plot areas. Mean plot-level DBH was allometrically calculated from the TreeVaW-estimated tree heights within each plot. For each plot surveyed during the field campaign, the mean DBH from trees having a measured DBH greater than or equal to the 75th percentile was calculated. The 75th percentile was used in an effort to only include the top of canopy crowns for comparisons with SWA- and TreeVaW-detected trees because sub-canopy trees cannot be detected using a CHM. Mean crown diameter in each plot was obtained from the observed allometric equation (figure 1) using the measured DBH of canopy trees. Mean plot-level crown diameters were only compared with SWA-estimated diameters. TreeVaW uses a user-defined allometric equation to calculate crown diameter from each detected tree height, making comparison of performance for estimating DBH and crown diameter redundant. Field-based canopy cover was calculated by dividing the sum of total crown area of each plot, which was allometrically calculated from field-measured DBH, by the ground area of each plot. The estimates of plot canopy cover were used to divide the plots into three canopy coverage classes: low (