estimate the power and energy cost of database operations. .... These were custom-built PCs with one 2.3 GHz AMD Phenom X4 quad core CPU, 8. GB of 800 ...
Available online at www.sciencedirect.com
Procedia Computer Science 6 (2011) 112–117
Complex Adaptive Systems, Volume 1 Cihan H. Dagli, Editor in Chief Conference Organized by Missouri University of Science and Technology 2011- Chicago, IL
Estimating Power/Energy Consumption in Database Servers Manuel Rodriguez-Martinez, Harold Valdivia, Jaime Seguel, Melvin Greer University of Puerto Rico, Mayaguez and Lockheed Martin Corp.
Abstract The explosive growth in the size of data centers, coupled with the wide-spread use of virtualization technology has brought power and energy consumption as major concerns for data center administrators. Provisioning decisions must take into consideration not only target application performance but also the power demands and total energy consumption incurred by the hardware and software. Failure to do so will result in damaged equipment, power outages, and inefficient operation. Since database servers comprise one of the most popular and important server applications deployed in such facilities, it becomes necessary to have accurate cost models that can predict the power and energy demands that each database workloads will impose in the system. In this paper we present an empirical methodology to estimate the power and energy cost of database operations. Our methodology uses multiple-linear regression and factorial experimental design to derive accurate cost models that depend only on readily available statistics such as selectivity factors, tuple size, numbers columns and relational cardinality. Moreover, our method does not need measurement of individual hardware components, but rather total power and energy consumption measured at a server. We have implemented our methodology, and ran experiments with several server configurations. Our experiments indicate that we can predict power and energy more accurately than alternative methods. c 2011 Published by Elsevier Ltd. � Keywords: cloud computing, energy efficiency, query processing.
1. Introduction Developers of database management systems have focused their optimization efforts into minimizing either the response time or the resource usage time required to run queries. From this perspective, the priority is to maximize the performance of the database applications by minimizing time, and thus increasing system throughput. This trend is also present in other Computing domains such as parallel processing, mobile computing, and real-time systems. But, the explosive growth of data centers [1], fueled in part by the emergence of Cloud Computing, has brought a new concern to the design process of computer systems: the cost of electrical energy. Recent work in [2] has shown that computer systems waste lots of electrical energy, even when idle. This raises the need for building new hardware and software systems that consume energy proportional to the work they perform [3]. 1877–0509 © 2011 Published by Elsevier Ltd. doi:10.1016/j.procs.2011.08.022
Manuel Rodriguez-Martinez et al. / Procedia Computer Science 6 (2011) 112–117
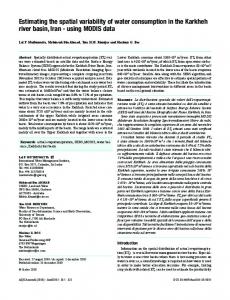
Since database management systems (DBMS) are common server applications deployed at data centers, it becomes necessary to develop new architectures, cost models, and query optimization techniques to make them energy efficient [4, 5, 6, 7, 8, 9] . In this paper, we focus on the problem of developing cost models to accurately estimate the power and energy cost of database queries. This problem is important because accurate estimation of power and energy cost are necessary to make provisioning decisions for single-site DBMS, and for back-end (worker) servers in parallel and distributed DBMSs. Recent work in [6, 7, 8] have proposed several cost models and methods to estimate the power and energy of query operators in a DBMS. Unfortunately, many of these methods incur in large estimation errors, which increases the likelihood of scheduling queries on a DBMS hosted by a virtual machine (VM) that cannot handle them due to power constrains. The work in [9] indicates that current query optimizers are energy efficient just by virtue of reducing resource usage, which in turn reduces energy consumption. Although that might be the case for single-site query workloads, the problem is quite different when dealing with virtualized, multi-tenant database systems, particularly in power-capped data centers. In this paper, we introduce a methodology to accurately estimate the power and energy consumption of queries in a database server. Our methodology uses multiple-linear regression, and a training query workload to derive a cost model that can predict the power and energy cost of queries that are similar to those in training workload. One important feature of our methodology is the fact that there is no need to make power/energy measurements on individual hardware components (e.g., CPU, RAM, HD) as in [4]. Instead, the cost models are derived from: a) power/energy measurements taken from internal sensors, or a power meter attached to the server enclosure, and b) readily available workload statistics such as relation cardinality, tuple size, number of columns, and number of servers in a multi-server configurations. 2. Estimating Energy Cost of Database Operations The power dissipated by a computer is a function of its utilization. Computers waste lots of electrical energy, even when idle, and often work between 10% and 50% of their peak utilization [3, 2, 10]. Virtualization can be used to consolidate several servers into fewer physical machines, and thus reduce energy expenses and management complexity. Furthermore, since not all physical machines reach their peak utilization at the same time, data centers can accommodate more physical machines than what the electrical system can support if all of them reach peak utilization (and hence peak power) at the same time [11]. However, this requires power caps (budgets) to be assigned to physical machines and racks to prevent them from overloading the system [12]. In this context, database servers must be aware of the energy costs of their operations and the cloud controller must provision the VMs for database servers on physical servers that have enough power entitlement and computational capacity to run the workloads. The problem that we aim to solve in this effort is the development of simple and accurate cost models that can be used to predict the power and energy costs that queries will have on a physical server. Formally, consider a workload of n queries Q1 , Q2 , ..., Qn to be run on a machine M. For each query Qi we need to find cost functions Ei , Pi , P¯i where: a) Ei is the energy consumed to run the whole query, b) Pi is the peak power reached while running the query, and c) P¯i is the average power reached while running the query. The formulation is similar if we are running on a MapReduce, parallel DBMS, or distribute DBMS environment, where we have a set of k ¯ machines M1 , M2 , ..., Mk . In such case, we need to find cost functions Eij , Pij , and Pij to get the energy, peak power, and average power for running operators for query Qi on machine M j . 2.1. Monitoring Architecture Figure 1 depicts the architecture of the system we designed to collect measurements from our servers and derive the cost models. Power measurements can be obtained from either internal server sensors (e.g., Dell’s iDRAC6 card) or an external power meter (power analyzer). Inside the physical server there is a power monitor application that periodically collects electrical measurements. In our case, we focus on collecting Watts (power) and kilowatt-hours (energy) consumed by the server. These measurements are taken every second, and then stored in a cost models database for future use. The query generator is used to stress the system based on a given workload W. This workload consists of a set of tables and queries to be submitted
113
114
Manuel Rodriguez-Martinez et al. / Procedia Computer Science 6 (2011) 112–117
to the DBMS at a specific rate. The query generator must be run from a machine different to the server as it will cause load that might alter the power/energy measurements, decreasing accuracy. Cost models
Cost Modeler Query Generator
DBMS VM Power Monitor Physical Server
Power Meter/ Management Card Power Source
Fig. 1: Monitoring architecture. The cost modeler component can be run inside the server, or at some other nearby machine. The cost modeler receives three input data sets: a) the SQL specification of the queries sent to the DBMS, along with start and end time for each query, b) the cardinalities, number of columns, tuples size, column size, and selectivity factors for all tables involved in the queries, c) the number of DBMS servers that participate in solving the queries, and d) the power/energy measurement taken at each server during the evaluation of the queries. These data sets serve to characterize the expected working configuration and conditions for the database system, once it is put in production. From these data, the cost modeler derives the cost models used to predict power and energy consumption. These models become metadata stored in the catalog. 2.2. Cost Model Derivation Methods Our cost models are empirical since they are derived from observations taken from the system. We employ multiple-linear regression to derive the models. Using multiple-linear regression [13], we postulate that the power/energy consumed by the server can be computed by adding a linear combination of independent terms. For example, consider a table R(A, B, C), and a selection query Q = πA,B (R). We might propose a cost model that relates the peak power P resulting from Q with the relation cardinality, |R|, and the number of columns in R, < R >. We can express this model as: P = β0 + β1 x1 + β2 x2 + � with x1 = |R| and x2 =< R >. In this methodology, each variable xi is called a predictor or regressor, and its value represents some quantity that shall have influence on the dependent variable, in this case the power P. Similarly, each constant βi is called a regression coefficient, with β0 accounting for the case in which all predictors are zero. In the case of power, the constant β0 is the power of the idle machine during query processing. The value � is called the error term, and captures the deviation of the model from reality. In general, we can have have k predictors for the peak power of a query, giving the following formula: P = β0 + β1 x1 + β2 x2 + ... + βk xk + � The energy (E) consumed while running the query can be estimated in similar fashion, so we focus our discussion on power to simplify matters. The predictors in the model become parameters associated with the workload to be run within the DBMS. These include the relation cardinality, number of columns, tuple size, and so on. The predictors that we consider in our methodology are summarized in Table 1. Constants such as CPU speed, disk speed, and memory size are absorbed into the regression coefficients.
115
Manuel Rodriguez-Martinez et al. / Procedia Computer Science 6 (2011) 112–117
Statistic |R| L(R) W(A) S F P (R) S
Meaning Cardinality of table R Number of columns in R Average tuple length in R Average length for column A in R Selectivity factor of predicate P applied to R Number of servers used
Table 1: Parameters used as regressors (or factors) to estimate power or energy consumption in a query. To make the cost formula concrete and usable, one must find the values of the regression coefficients. This is done by performing a series of observations in which the power and predictor values are collected. Thus, each observation becomes a run of a query on the DBMS. During an observation, the power gets recored by the measurement equipment. Likewise, the predictor values are read from the catalog. This leads to a system of linear equations of the form: P1 = β0 + β1 x11 + β2 x12 + ... + βk x1k + �1 P2 = β0 + β1 x21 + β2 x22 + ... + βk x2k + �2 ... Pn = β0 + β1 xn1 + β2 xn2 + ... + βk xnk + �n The regression coefficients can then be determined by the method of least squares, minimizing the error term �. Fortunately, statistical packages such as Minitab and R can do the computation for us! We just need to focus on getting the power measurements and the value of the predictors into a file. 2.3. Preliminary Results on Selection Queries We implemented a system based on our methodology as a set of programs and scripts written in Java, C, R, and Minitab. All our machines ran Ubuntu 10.04 LTS Server Edition. We used PostgreSQL 8.3 as the DBMS for experimentation. The query generator program was written as a Java client application that submits queries to PostgreSQL via JDBC. The power monitor program was written as a C daemon, which reads the logs from the power meters as a CSV file. The cost modeler ran as an interactive session with Minitab, although it can be easily converted to a script in R. We used four server machines for running all our experiments. These were custom-built PCs with one 2.3 GHz AMD Phenom X4 quad core CPU, 8 GB of 800 MHz DDR2 RAM, and two 500 GB, 7200 RPM, SATA-300 Western Digital Caviar Blue hard disks. In each of these four machines, the disks were configured as a RAID-0 storage device. To validate our ideas we compare our regression-based models with the models presented in [8], which are based on the System-R style cost models found in PostgreSQL. In these models, power is estimated as the sum of the power drawn by the CPU, and disk during query processing, treating power as a cumulative quantity. To ease our discussion, we shall refer to the energy-related cost models derived from System-R as Method A, and refer to our models as Method B. We ran three configurations, each with different number of servers. In the 2-node and 4-node configurations, tables were horizontally partitioned. We started out by working on the models for the peak power of a set of selection queries based on TPC-H. We tried several combinations of parameters as regressors. These combinations are not linear, but the important issue in multiple-linear regression is to have linearity between the dependent variable and the regression coefficients [13]. Based on this, we postulated the model: P=
+ β6 β0 + β1 < R > +β2 S F p (R) + β3 (1/S 2 ) + β4 < R > S F p (R) + β5 S2
S F p (R) S2
The last three terms capture the interaction between the selectivity factor, the number of columns, and the number of servers. After, running the model through Minitab we arrived to the following cost formula: P=
+ 0.118 101 + 0.441 < R > −0.0972S F p (R) − 6.72(1/S 2 ) + 0.00785 < R > S F p (R) + 0.692 S2
S F p (R) S2
116
Manuel Rodriguez-Martinez et al. / Procedia Computer Science 6 (2011) 112–117
(a) One node configuration
(b) Four node configuration
Fig. 2: Comparisons of measured peak power with the predictions made by Methods A and B.
(a) One node configuration
(b) Four node configuration
Fig. 3: Comparisons of measured energy consumption with the predictions made by Methods A and B. This model was shown to be statistically sound. Notice the direct dependence on selectivity factor and number of columns, with an inverse dependence on the square of the number of servers. To validate this model as an accurate predictor of peak power, we generated a second set of similar selection queries with different selectivities, and ran them on each server configuration. We recorded their peak power, and we compare them with the peak power predicted by our models (Method B) and with the peak power predicted by System-R models (Method A). Figure 2 presents this comparison for each of the server configurations. Notice that as the number of server increases and utilization decreases, the power begins to converge to a constant value. Further research needs to be conducted to determine the behavior when more nodes are added and these reach a high utilization level. As we see, our method makes a more consistent approximation of power, particularly when the server utilization is higher (i.e., 1-node configuration). The results are similar for average power, so we do not present them here. The model that we developed for energy consumption is a follows: E=
β0 + β1 S + β2 S F p (R)S + β3 |R|S F p (R) + β4 |R| < R > S F p (R)
In this case, the relation of energy and the number of servers is proportional to the number of servers . In contrast, in the case of peak power this relationship was inversely proportional with the square of the number of servers. Notice also, that cardinality now becomes a factor. Both behaviors make sense since the total energy consumption is cumulative, and shall be affected by the number of tuples of to be processed (total effort) and the number of servers (machines doing the effort). We repeated our validation exercise for the energy models. Figure 3 summarizes the results. Our methodology makes a better job of predicting the energy compared with Method B, which consistently overestimates and underestimates the value. 2.4. Next Steps to be Conducted • Models for Projection and Join Queries - We shall extend our method to projection and joins queries, considering also complex queries with aggregates, and sorting operations.
Manuel Rodriguez-Martinez et al. / Procedia Computer Science 6 (2011) 112–117
• Models for Queries with UDF - User-defined functions (UDF) can impose considerable CPU and I/O demands during queries, so we must develop models to capture their energy signatures. • Virtualization and High Utilization Scenarios -We need to extend our methods to investigate situations in which the database servers run on virtual machines [14], and with high utilization scenarios to better understand how high load and resource contention affect the energy consumption. For simplicity, we assume energy monetary costs to be constant throughout the day. • MapReduce scenarios - We shall investigate how to derive models for all major relational operators in a MapReduce setting. This case will be challenging since parallel query models are more complex, and because the MapReduce framework relies on the materialization of intermediate results [15]. 3. Summary In this paper, we studied the problem of estimating the power and energy costs of database queries. We introduced a methodology to accurately estimate the power and energy consumption of queries in a database server. Our methodology is based on multiple-linear regression, factorial experiments, and a training query workload to derive a cost model that can predict the power and energy cost of queries that are similar to those in training workload. One important feature of our methodology is the fact that there is no need to make measurements on individual hardware components. Instead, the cost models are derived from: a) power/energy measurements taken from internal sensors, or power meters, and b) readily available workload statistics such as relation cardinality, tuple size, number of columns, and number of servers in a multiserver configuration. We implemented our framework as a set of programs and scripts written in Java, C, R, and Minitab. We performed tests on our framework with TPC-H data sets. In these experiments, we first derived energy/power cost models from a set of data and queries that act as training set. Later, we validated the models by running a second set of queries, and comparing their power/energy cost versus those predicted by the model. Our results show that we can predict power and energy more accurately than alternative methods based on model derived from those in System-R . We also found that peak power is not influenced by relation cardinality but by selectivity, number of columns in tables, and number of servers used in a multi-server configuration. Finally, we found that energy is more amicable for modeling with these methods. Although further research is needed, these results show that our methodology can be used by tools that perform provisioning of database server machine in a datacenter. Also, our methodology can be incorporated into energy-aware query optimization frameworks. References [1] [2] [3] [4] [5] [6] [7] [8] [9] [10] [11] [12] [13] [14] [15]
R. H. Katz, Tech titans building boom, IEEE Spectrum 46 (2) (2009) 40–54. L. A. Barroso, The price of performance, ACM Queue 3 (7) (2005) 48–53. L. A. Barroso, U. H¨olzle., The case for energy-proportional computing, IEEE Computer 40 (12) (2007) 33–37. S. Rivoire, M. A. Shah, P. Ranganathan, C. Kozyrakis, Joulesort: a balanced energy-efficiency benchmark, in: Proc. of SIGMOD ’07, New York, NY, USA, 2007, pp. 365–376. G. Graefe, Database servers tailored to improve energy efficiency, in: SETMDM ’08: Proc. of EDBT workshop on Software engineering for tailor-made data management, ACM, New York, NY, USA, 2008, pp. 24–28. S. Harizopoulos, M. A. Shah, J. Meza, P. Ranganathan, Energy efficiency: The new holy grail of data management systems research, in: CIDR, 2009. W. Lang, J. M. Patel, Towards eco-friendly database management systems, in: CIDR, 2009. Z. Xu, Y.-C. Tu, X. Wang, Exploring power-performance tradeoffs in database systems, in: ICDE, 2010, pp. 485–496. D. Tsirogiannis, S. Harizopoulos, M. A. Shah, Analyzing the energy efficiency of a database server, in: Proc. of SIGMOD ’10 Indianapolis, IN, USA, 2010, pp. 231–242. W. Lang, J. M. Patel, Energy management for mapreduce clusters, in: 2010 VLDB Conference, Singapore, 2010. X. Fan, W.-D. Weber, L. A. Barroso, Power provisioning for a warehouse-sized computer, in: ACM International Symposium on Computer Architecture, SD, CA, 2007. R. Raghavendra, P. Ranganathan, V. Talwar, Z. Wang, X. Zhu, No ”power” struggles: coordinated multi-level power management for the data center, SIGOPS Oper. Syst. Rev. 42 (2) (2008) 48–59. D. C. Montgomery, E. A. Peck, G. G. Vining, Introduction to Linear Regression Analysis, 4th Edition, Wiley-Interscience, 2006. A. A. Soror, U. F. Minhas, A. Aboulnaga, K. Salem, P. Kokosielis, S. Kamath, Automatic virtual machine configuration for database workloads, in: Proc. of SIGMOD ’08, Vancouver, Canada, 2008, pp. 953–966. J. Dean, S. Ghemawat., Mapreduce: Simplified data processing on large clusters, in: Proc. of 2004 OSDI, San Francisco, CA, USA, 2004, pp. 137–150.
117