The 21st International Congress on Sound and Vibration 13-17 July, 2014, Beijing/China
ESTIMATION OF ALLOWABLE VIBRATION EXPOSURE LIMIT USING ANFIS METHODOLOGY FOR TWO-WHEEL TRACTOR FUELLED BY DIESEL-BIODIESEL BLENDS Mirnezami Seyed Vahid1, Hassan-Beygi Seyed Reza1, Abdolahzadeh Rahman1, Ghobadian Barat2 1 2
Department of Agro-Technology, College of Abouraihan, University of Tehran, Tehran, Iran Tarbiat Modares University (TMU), Tehran, Iran e-mail:
[email protected]
One of the most important ergonomic and industrial issues is the human health when they are working with machines in particular agricultural machines, which was equipped with diesel engines. Users of agricultural machines are exposed to high level of vibration and working more than allowable time causes damaging different part of body, decreasing efficiency and quality of work. Nowadays, the most of fossil fuels is consumed by the combustion engines. Combustion of fossil fuels on the engines causes rapid depletion of energy sources and also harmful effect on environment. A suitable alternative fuel for diesel engines is called biodiesel due to their vital source. The vibration characteristics of diesel engine could be changed when using blended diesel-biodiesel fuel. In this research, the allowable vibration exposure time was estimated with ANFIS methodology for two-wheel tractor fuelled by diesel-biodiesel blends. A 13-hp twowheel tractor with 5 types of fuels was used. The tractor was driven with five engine speeds and four gear ratios. To gather the vibration acceleration data of this tractor, three accelerometers were installed in three mutually perpendicular directions on seat of trailer pulled by tractor. The results indicated that the best fuzzy inference system structure was subtractive clustering. The optimum radius of subtractive clustering was 0.75, 0.65 and 0.80 As well; the number of rules was 10, 18 and 9 for longitudinal, lateral and vertical directions, respectively. In all of the three directions, the differences between predicted and measured values are decreased with increasing the frequencies 1 to 80 Hz. The developed ANFIS network could be predicted the vibration acceleration of combustion frequencies and also the trend of 1/3rd octave frequency spectra. The coefficient correlations of model within frequency range of 1-80 Hz were 0.75, 0.85 and 0.91 for the longitudinal, lateral and vertical directions, respectively.
1.
Introduction
Since the invention of the internal combustion engine and further advances in engine technology, some problems have been arisen such as sound and vibration. Nowadays, the most important ergonomic and industrial issues is the human health when they are working with machines especially agricultural machines, which was equipped with diesel engines. Users of agricultural machines are exposed to high level of vibration and working more than allowable time causes damaging different part of body and consequently decreasing efficiency and quality of work. Exposure time is depended on direction and frequency. The ISO 2631-1 standard described a set of vibration exposure criteria curves for three orthogonal directions (longitudinal, lateral, and vertical) within the frequency range of 1-80Hz. Human reaction in these frequencies can’t be related to exciting motion, ICSV21, Beijing, China, 13-17 July 2014
1
21st International Congress on Sound and Vibration (ICSV21), Beijing, China, 13-17 July 2014 duration, and intensity. Furthermore, it seems to depend on other factors such as age, vision, activity, and odours. Above 80 Hz, the effects and sensations are related to external damping factors which heavily influenced the response of the skin and superficial tissue chiefly affected by frequencies above 80 Hz [1]. Agricultural machines especially hand controls are machines which users have direct contact with them and thus generated vibration are transmitted to different part of users’ body. Long exposure to vibration creates noticeable fatigue and uncomforting and consequently decrease efficiency job. Therefore, it is essential to decrease the transmitted vibration to body or exposure time which working to machines. Some researchers survived to reduce vibration and its hazardous to users’ body. Vibration control in devices preserves users from diseases and disorders [2]. In the two-wheel tractor discomfort and pain of users was 27% less in riding control ratio to walking [3]. White finger sickness hazardous was determined three to four years in 10% of users who work eight hours a day [4]. A working program of two-wheel tractor was designed for break times. Exposure time shouldn’t exceed seventy-five minutes and the break time should be fifteen minutes between the each period of work for preventing the damage and fatigue [5]. Some experiments were conducted on trailer seat of a 7.5hp power tiller. The result revealed that the working exposure time with this tractor shouldn’t exceed 2.5 hours [6]. In another research was investigated the transmitted vibration to hand-arm in a 7.5 power tiller in both of transport and tillage mode. It was concluded that the exposure time for transport and tillage were 4 and 8 hours during a day, respectively [7]. In the other research, the effect of isolators was studied for reducing the transmitted vibration to hand-arm in a two-wheel tractor [8]. HTV value in walking control was decreased from 4.55 to 3.18 m/s2 and in riding control it was reduced from 3.96 to 2.67 m/s2. White finger disorder in both controls was amended 4 years. The time exposure for walking control was increased from 0.5 to 2 hours and for riding control was enhanced from 1 to 2 hours. The majority of these researches have focused on vibration amount transmitted to body and calculating the exposure time. In those researches the effective parameters were direction and speed. Widespread use of oil and fuel in these engines is another significant matter in addition to sound and vibration problem. In diesel engines, alternative fuels are called biodiesel due to their vital source. This type of fuel is important in aspects of renewable, rapid substitution of first materials, adjustment with environment, capable of reducing the pollution. Using blended diesel-biodiesel can change vibration transmitted to user by changing combustion in engine. The exposure time of a 7.7hp power tiller was studied in various forward speeds and in handle grip position [9]. It was observed that the transmitted vibration to handle grip in all of three different working hours in a day 10, 8, and 5 were more than standard limit (2 m/s2). Genetic programming (GP) could predict a power tiller vibration transmitted to driver as well as traditional methods and discovered functions showed a good match to the experimental data for RMS [10]. Also in the other research modelled accurately the whole body vibration transmitted to user of tiller consuming blended diesel-biodiesel fuel by using ANFIS method [11]. One of the main sources for mechanical power generation in agriculture sector is agricultural tractors that were equipped mostly by diesel engines. Diesel engines generate high levels of noise and vibration due to robust combustion of diesel fuel and inertia forces of engine moving parts. Furthermore, since use of conventional vibration control suspension systems in vehicles are impossible in agricultural tractors due to operating limitations. Therefore, a main portion of the diesel engine vibration is transmitted to their users as noise and vibration so operators of tractors work in harsh environment. The vibration and noise of diesel engines and how to deal with them are the dilemma of operators of the machineries, which was equipped with the engines. Excessive exposure time within high vibration causes disorders to body issues. Knowledge about comfort and fatiguedecreased proficiency is based on statistical data collected under practical and experimental conditions. In this research, the allowable vibration exposure time was estimated with ANFIS methodology for two-wheel tractor fuelled by diesel-biodiesel blends. A 13-hp two-wheel tractor with 5 types of fuels was used. The tractor was driven with five engine speeds and four gear ratios. To
ICSV21, Beijing, China, 13-17 July 2014
2
21st International Congress on Sound and Vibration (ICSV21), Beijing, China, 13-17 July 2014 gather the vibration acceleration data of this tractor, three accelerometers were installed in three mutually perpendicular directions on seat of trailer pulled by tractor.
2.
Materials and methods
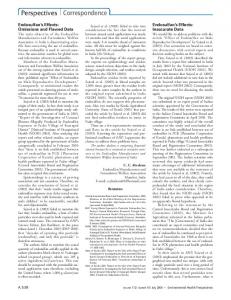
In this research a power tiller Mitsubishi CT-82 was used. The power tiller engine was equipped with a four-stroke, single cylinder and indirect injection. This engine was providing 13-hp power at 2200-rpm rated speed. Five types of diesel and diesel-biodiesel blends (pure diesel (B0), 2% biodiesel (B2), 4% biodiesel (B4), 6% biodiesel (B6) and 8% biodiesel (B8)) were used for investigating the effect of fuel on vibration transmissibility. For measuring vibration acceleration in real condition a 9000N load was placed on trailer pulled by tractor. Furthermore, whole experiments were conducted in transport mode and in three repetitions. In each repetition vibration acceleration was recorded in six seconds and the sample rate was 20000 at five levels of engine rotational speeds (1400, 1600, 1800, 2000 and 2200 rpm) and 4 levels of gear ratio (2high, 2low, 3high and 3low). Fig. 1 shows the schematic diagram of the experimental set up for measuring vibration acceleration entered user’s body. To measuring the vibration, three CTC-AC192 type accelerometers were used for three directions (longitudinal, lateral and vertical). Three accelerometers were installed on the seat pan of trailer using suitable adaptor. For converting the analogue output signals to digital an A/D (Analogue to Digital) convertor was used. This convertor was recognized and controlled by LABVIEW software program. The required power for set up was supplied by two 12-volt batteries. These times domain signals which were obtained were in LABVIEW software were imported to MATLAB software program. In this domain, vibration signals didn’t have stability because of numerous frequencies. So signals were converted to 1/3rd octave frequency band In order to eliminate this problem and reveal many details while having the stability [12]. These signals in 1/3rd octave frequency spectra were weighted according to eq.1. (1) Where is the weighted frequency acceleration in each direction, is the weighting factor th for the i one-third octave band given in appendix1, and is the RMS acceleration for the ith onethird octave band. 9000 N
Accelerometer A/D Convertor Battery Signal conditioner Laptop
Time Domain Signal Frequency Domain Signal 1/3 Octave Band
Software
Figure 1. Diagram of the experimental set up for measuring vibration acceleration in the hand-arm system
ICSV21, Beijing, China, 13-17 July 2014
3
21st International Congress on Sound and Vibration (ICSV21), Beijing, China, 13-17 July 2014 2.1 Modelling adaptive neural fuzzy inference system (ANFIS) The title should be typeset using 17 point bold Arial or Helvetica font, with capital letters only. The “Title” style has been adjusted to use these values. This style also adjusts vertical spacing above and below the title. If the title is longer than one line, it should be manually broken to equalize line lengths. In this research was used combination of artificial neural network and fuzzy logic in order to design a non-linear mapping between input and output space. ANFIS toolbox in MATLAB software is the most basic and common Sugeno method of fuzzy inference structure system which have validation capability by training data. 2.2 ANFIS design After processing vibration signal were obtained 100 data. Fuel, gear ratio, and engine speed were the input parameters. All of these parameters had specific variables. B0, B2, B4, B6, and B8 were the fuel variables. 2, 3-high and 2, 3-low were the gear ratio variables as well as 1400, 1600, 1800, 2000, 2200 which were the engine speed variables. was the output parameter in each fuel, gear ratio, and engine speed. Inference system structure is used three various method in ANFIS toolbox of MATLAB software. Grid partition, FCM clustering and subtractive clustering are the methods. In grid partition method is used different type and number of membership functions. Figure5 shows curve shapes of the each membership functions. In the second method is used FCM (fuzzy c-mean) clustering classified data by getting the number of clusters and guessing clusters centres [13]. Third method is used subtractive clustering which is fast and one-pass algorithm for estimating the number of clusters and the cluster centres in a set of data by getting the cluster radius [14]. Whole of these methods were used to select the best one with comprising among. For training each of method was utilized default argument except training epoch number used 100 instead of 10. Training error goal (default: 0), initial step size (default: 0.01), step size decrease rate (default: 0.9), and step size increase rate (default: 1.1). 80% of data were used for training and 20% for testing fuzzy inference system. R, RMSE values for both of train and test were applied to analyze the fuzzy inference system and also choose the best model. The number of total data was 2000 (5 fuel, 5 engine speed, 4 gear ratio, 20 frequency centre).
3.
Results and discussion
According to parameters in measuring vibration, 100 data which were averaged between repetitions were generated for each fuel type, engine speed, and gear ratio. In addition, all of data were investigated in 20 frequency centres, separately as ordered in ISO 2631. Weighted vibration data in each frequency centre were close together, therefore these data were scattered by using logarithm and then were normalized between 0 and 1in each frequent according to eq.2. (2) Where: is the normalized value, is the weighted vibration RMS in jth of frequency centre and is the minimum value of . Neural-fuzzy networks require inputs and output parameters. Fuel, engine speed, and gear ratio are the input parameters and weighted RMS entered to seat in each three directions and frequency centres are the output parameter. These parameters are defined in ANFIS toolbox in MATLAB to achieve the best structure among the three fuzzy inference system structures (grid partition, FCM clustering, and subtractive clustering). Each structure was trained with same arguments while different arguments were applied for them. At first whole of the training arguments were defined as well as software’s default except epoch which was defined 100 instead of 10. Second, by this defining various arguments were considered for each structure to find the best structure for Neural-Fuzzy network. Finally, the best network was optimized by changing the training arguments. ICSV21, Beijing, China, 13-17 July 2014
4
21st International Congress on Sound and Vibration (ICSV21), Beijing, China, 13-17 July 2014 At first, the grid partition and FCM clustering structures were rejected because of too much data could not be handled by this inference system and it was dramatically time-consuming. Furthermore those structures could not provide acceptable Neural-Fuzzy models. In this article because of observing limitation page, subtractive clustering has been discussed, merely. In this inference system whole training arguments were as same as default except epochs which defined as 3000 instead of 100. Data are clustered in diverse radiuses of clusters to optimize and find out the best cluster. The summary of trained structures with various radiuses in three axes is depicted in table4. In all of axes the radiuses range was between 0.5 and 0.95. Radiuses which was less than 0.5 was completely eliminated due to generate excessive roles and time-consuming. As can be seen from this table in lateral direction and in cluster radius of 0.65 was achieved better R and RMSE ratio to other radiuses. Although radius of 0.5 could train better, it contained many rules and less RMSE. In this radius was obtained 18 rules. In longitudinal direction the radius cluster of 0.75 was provided better result according to R and RMSE values. Eventually, radius of 0.8 was obtained due to similarity between R in training and Testing. Consequently three radiuses for three axes were calculated. For each direction the maximum and minimum values of vibration data were calculated both for predicted by optimized Neural-Fuzzy network and experimental data. Figure.1 depicts the standard allowable time exposure to vibration in longitudinal and lateral directions according to ISO 2631. The obtained maximum and minimum data in each centre frequency for mentioned directions are shown in figure2 and 3, respectively. It can be seen from the figure.2 that in low frequencies the difference between predicted and real values was high due to sensor’s low sensitivity in these frequencies. However, this difference was significantly decreased by increasing the centre frequency. Furthermore, the trend of real data was observed by Neural-Fuzzy model, accurately. As figure 2 shows, the maximum vibration acceleration entered to body was approximately 0.195 in 40 Hz. Moreover, by comparing figure 1 and figure 2 it could be realized that in whole frequencies the vibration acceleration were less than standard values for 8 hours working. In term of longitudinal axis, the maximum vibration acceleration was related to 31.5 Hz which was 0.146 without considering low frequencies. In high frequencies, user can work at least 8 hours a day. By defuzzification of input variables, it was perceived that majority of maximum values in these axes were contributed to B0 and B2 fuels, whereas these whole of minimum values were related to B8 fuel. It is obvious that in vertical direction the vibration acceleration values were more than others due to same direction of piston movement in cylinder. In this direction the maximum acceleration value was occurred in 31.5 Hz. The result of defuzzification and investigating the input parameters in this direction of revealed that B8 had minimum values of vibration acceleration and user can work at least 8 hours according to ISO 2631. 13 10
RMS (m/s 2 )
5.1 3.6
1 4h 0.38 8h 0.23 16h
0.15 0.1
24h 1
2
10 Frequecny (Hz)
31.5
63 80100
Figure 2. Allowable time exposure to vibration in longitudinal and lateral directions (ISO 2631, 1997)
ICSV21, Beijing, China, 13-17 July 2014
5
21st International Congress on Sound and Vibration (ICSV21), Beijing, China, 13-17 July 2014
Predicted Value Real Value
RMS (m/s 2 )
0.2
0.15
0.1
0.05
0
1
2
10 Frequency (Hz)
31.5
63 80100
Figure 3. predicted and real data in longitudinal direction 0.45 Predicted Value Real Value
0.4 0.35 RMS (m/s 2 )
0.3 0.25 0.2 0.15 0.1 0.05 0
1
2
10 Frequecny (Hz)
31.5
63 80100
Figure 4. Predicted and real data in lateral direction 2.5 Predicted Value Real Value
2
RMS (m/s )
2
1.5
1
0.5
0
1
2
`0 Frequency (Hz)
31.5
63 80100
Figure 5. predicted and real data in vertical direction
ICSV21, Beijing, China, 13-17 July 2014
6
21st International Congress on Sound and Vibration (ICSV21), Beijing, China, 13-17 July 2014 2.9 2.1 1.4 RMS (m/s 2 )
1 0.63 0.44 8h 0.29 16h
0.21
24h 0.14
1
2
10 Frequency (Hz)
31.5
63 80100
Figure 6. Allowable time exposure to vibration in vertical directions (ISO 2631, 1997)
4.
Conclusion
The best structure fuzzy system in Neural-Fuzzy network for estimating the (WBV) was subtractive clustering with radius of 0.85 which R-Train, R-Test, RMSE-Train and RMSE-Test values were 0.99, 0.985, 0.24 and 0.35, respectively. Also the best inference fuzzy system in Neural-Fuzzy network for estimating the exposure time according to ISO 2631 was studied in three orthogonal axes which subtractive clustering was the best structure in whole of them. In lateral direction radius of 0.85 with 18 rules were the best fuzzy structure and R-Train, R-Test, RMSE-Train and RMSETest values were 0.89, 0.86, 0.0076, and 0.085, respectively. In longitudinal direction radius of 0.75 with 10 rules were the best fuzzy structure and R-Train, R-Test, RMSE-Train and RMSE-Test values were 0.79, 0.76, 0.08, and 0.09, respectively. In vertical direction radius of 0.8 with 9 rules were the best fuzzy structure and R-Train, R-Test, RMSE-Train and RMSE-Test values were 0.92, 0.92, 0.06, and 0.06, respectively. In both lateral and longitudinal directions and at high frequencies user could work more than 8 hours a day. However, in vertical axis user couldn’t work 8 hours per day due to same direction with movement of piston in cylinder. In all of the three directions, the differences between predicted and measured values are decreased with increasing the frequencies 1 to 80 Hz.
REFERENCES 1
2 3
4
5
6
7
Rasmussen, G. (1983). Human Body Vibrations Exposure and Its Measurement, Bruel and Kjer Technical Paper, Journal of Acoustical Society of America, 73(6) 2229 R. K, Mobley. (1999). Vibration Fundamentals. Newnes, Boston. Tewari, V.K., Dewangan, K.N., and Karmakar S. (2004). Operator’s Fatigue in Field Operation of Hand Tractors, Biosystems Engineering 89:1-11. Goglia, V., Gospodaric, Z., Filipovic, D., Djukic, I. (2006). Influence On Operator's Health of Hand-Transmitted Vibrations In Three Operational Modes. International Journal of Industrial Ergonomics 39:239–245. Tewari, P.S., Gite, L.P. (2002). Physiological Responses during Operation of a Rotary Power Tiller. Biosystems Engineering 82:161–168. Mehta C.R., Tiwari P.S., Varshney A.C. (1997). Ride Vibrations on a 7.5 kW Rotary Power Tiller. J . agric . Engng Res. 66:169-176. Sam, B., Kathirvel, K. (2006). Vibration Characteristics of Walking and Riding Type Power Tillers, Biosystnems Engineering 95:517–528.
ICSV21, Beijing, China, 13-17 July 2014
7
21st International Congress on Sound and Vibration (ICSV21), Beijing, China, 13-17 July 2014 8
9
10
11
12 13
14
Sam, B., Kathirvel, K. (2009). Development and evaluation of vibration isolators forreducing hand transmitted vibration of walking and riding type power tillers. Biosystems engineering 3:427-437. Taghizadeh, A. Practical evaluation of vibration power tiller on user. Master of science thesis, Tarbiat Modarres University, (2005). Abdolahzade, R., Hasan-Beygi, S. R., Mirnezami, S. V., Ahmadian, H. and Aboonajmi, M. (2013). Prediction a Power Tiller Vibration Transmitted to The Driver Using Genetic Programming. Proceedings of the 20th International Congress on Sound and Vibration, (ICSV20). Mirnezami, S.V., Hassan-Beygi, S.R., Abdolahzadeh, R., Banakar, A., Ghobadian, B. and Malati M., (2013). Investigation of Blended Diesel-Biodiesel Effect On User Convenience Due To Transmitted Vibration Using ANFIS method. European Workshop on Renewable Energy Systems (EWRES), Antalya, Turkey. Crocker, M.J. (1998). Handbook of acoustics. 1st edition, John Wiley & Sons, Bezdec, J.C. (1981). Pattern Recognition with Fuzzy Objective Function Algorithms, Plenum Press, New York. Chiu, S. (1994). Fuzzy Model Identification Based on Cluster Estimation. Journal of Intelligent & Fuzzy Systems, Vol. 2, No. 3.
ICSV21, Beijing, China, 13-17 July 2014
8