This discussion paper is/has been under review for the journal Geoscientific Instrumentation, Methods and Data Systems (GI). Please refer to the corresponding final paper in GI if available.
Discussion Paper
Geosci. Instrum. Method. Data Syst. Discuss., 5, 549–576, 2015 www.geosci-instrum-method-data-syst-discuss.net/5/549/2015/ doi:10.5194/gid-5-549-2015 © Author(s) 2015. CC Attribution 3.0 License.
|
J. Cohen
Discussion Paper
Estimation of forest parameters using airborne laser scanning data
Published by Copernicus Publications on behalf of the European Geosciences Union.
Title Page Abstract
Introduction
Conclusions
References
Tables
Figures
J
I
J
I
Back
Close
Discussion Paper |
549
J. Cohen
|
Correspondence to: J. Cohen (
[email protected])
Estimation of forest parameters using airborne laser scanning data
Discussion Paper
Received: 4 December 2015 – Accepted: 8 December 2015 – Published: 21 December 2015
5, 549–576, 2015
|
Finnish Meteorological Institute, P.O. BOX 503, 00101 Helsinki, Finland
GID
Full Screen / Esc Printer-friendly Version Interactive Discussion
5
J. Cohen
Title Page Abstract
Introduction
Conclusions
References
Tables
Figures
J
I
J
I
Back
Close
Discussion Paper |
550
Estimation of forest parameters using airborne laser scanning data
|
25
Numerous methods for estimating forest characteristics by airborne laser scanning (ALS) data have been introduced in the last decades. Several authors have published summaries about the use of ALS in forest applications, such as Naesset et al. (2004), Hyyppä et al. (2009), Holopainen et al. (2010, 2011) and Kaartinen et al. (2012). There are two main approaches in forest parameter retrieval using ALS (Hyyppä et al., 2008), which are area-based approaches (ABAs) and individual/single-tree detection approaches (ITDs). The ABA methods are based on the statistical relationship between the estimated forest parameter and point cloud features. In the ITD methods individual trees are recognized and tree-level variables such as height and width are measured. Therefore the IDT approach requires higher point density than the ABA.
5, 549–576, 2015
Discussion Paper
20
Introduction
GID
|
1
Discussion Paper
15
|
10
Methods for the estimation of forest characteristics by airborne laser scanning (ALS) data have been introduced by several authors. Tree height (TH) and canopy closure (CC) describing the forest properties can be used in forest, construction and industry applications, as well as research and decision making. The National Land Survey has been collecting ALS data from Finland since 2008 to generate a nationwide high resolution digital elevation model. Although this data has been collected in leaf-off conditions, it still has the potential to be utilized in forest mapping. A method where this data is used for the estimation of CC and TH in the boreal forest region is presented in this paper. Evaluation was conducted in eight test areas across Finland by comparing the results with corresponding Multi-Source National Forest Inventory (MS-NFI) datasets. The ALS based CC and TH maps were generally in a good agreement with the MS-NFI data. As expected, deciduous forests caused some underestimation in CC and TH, but the effect was not major in any of the test areas. The processing chain has been fully automated enabling fast generation of forest maps for different areas.
Discussion Paper
Abstract
Full Screen / Esc Printer-friendly Version Interactive Discussion
551
|
5, 549–576, 2015
Estimation of forest parameters using airborne laser scanning data J. Cohen
Title Page Abstract
Introduction
Discussion Paper
Conclusions
References
Tables
Figures
J
I
J
I
|
Back
Close
Discussion Paper
25
GID
|
20
Discussion Paper
15
|
10
Discussion Paper
5
Tree height (TH) and canopy closure (CC) are important forest parameters which describe the characteristics of the forest. These parameters can be used for instance in forest planning and managing, construction planning, wood industry, and other decision making in municipal and national level. They are also essential information in optical and microwave remote sensing applications and in ecological and biological research. To understand the meaning of TH and CC forest parameters, it is first necessary to know their definition (Gschwantner et al., 2009). The definition for forest TH is the average height of the trees in a certain area, and it is expressed in meters. CC is usually expressed in percent units (%), and is defined by the relation between surface area obscured by tree canopy and the total surface area, when looking vertically from ground surface level upwards or to the opposite direction (Jennings et al., 1999). The National Land Survey (NLS) of Finland has been collecting ALS data from Finland since 2008, in order to produce a nationwide digital elevation model (DEM) in 2 m resolution. To reduce the effect of vegetation on the laser beam, the scanning has been performed annually in early spring leaf-off conditions. The data is hence not ideal for vegetation detection, but it can still provide a valuable source in forest mapping, as it is planned to cover all Finland by the year 2019, and because most of the forests in Finland are coniferous dominated, preserving their needles all year round. NLS ALS data has been previously tested for above ground biomass estimation (Kankare et al., 2014). The main goal of this work was to assess the applicability of this LiDAR point cloud data collected in early spring for generating CC and TH maps in the boreal forests region of Finland. A method for the retrieval of CC and TH maps in spatial resolution of 10 m from the ALS point cloud data was tested and validated. Validation of the method was carried out in eight test areas across Finland in various forest conditions by comparing the results with the corresponding Multi-Source National Forest Inventory (MS-NFI) data generated by the Natural Resources Institute Finland (LUKE), in 2012. Special attention was given to the effect of deciduous forest to the results, be-
Full Screen / Esc Printer-friendly Version Interactive Discussion
2
Data and test areas −2
J. Cohen
Title Page Abstract
Introduction
Conclusions
References
Tables
Figures
J
I
J
I
Back
Close
Discussion Paper |
552
Estimation of forest parameters using airborne laser scanning data
|
25
5, 549–576, 2015
Discussion Paper
20
GID
|
15
Discussion Paper
10
|
5
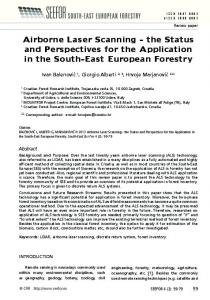
Point density of the input ALS data is at least 0.5 points m , which is equivalent to a distance of approximately 1.4 m between the points. The mean vertical and horizontal errors of the LiDAR points are up to 15 and 60 cm respectively. The flight altitude was 2000 m, which creates a footprint area of 50 cm on the ground. The scanning in the test areas was performed between the years 2008 and 2014, during early spring when deciduous trees were still leafless. MS-NFI CC and TH maps in a spatial resolution of 20 m × 20 m were used as a reference data for validation. These data have been developed by employing ground information, satellite images such as Landsat and Spot, as well as other numerical GIS data to estimate different forest characteristics (Tomppo et al., 2008). Corine Land Cover 2006 was used to mask water and urban areas from the generated forest maps and to separate deciduous forests when analyzing only deciduous areas. The CC and TH maps were generated for eight different sites across Finland, in order to test the method for various forest types. Saariselkä, Kittilä and Sodankylä from Northern Finland, Pudasjärvi and Kajaani from Central Finland, and Evo, Miehikkälä and Tuusula from Southern Finland were chosen. The locations of the test areas can be seen in Fig. 1. Due to colder winters and shorter summers in Northern Finland, the trees are generally shorter and more sparsely distributed than in Southern Finland. Hence, in principal, the more south is the area, the denser and higher are the forests. Saariselkä represents the most arctic environment and the site has the most elevation differences. The high elevated parts are treeless tundra and the lower parts are forests. Kittilä and Sodankylä are characterized by mostly coniferous, relatively short and sparse forests, Pudasjärvi and Kajaani have somewhat higher and denser, mostly coniferous forests, whereas Evo, Miehikkälä and Tuusula represent the denser and
Discussion Paper
cause at the time of the laser scanning, leaves were not present on the trees, which was expected to cause some underestimation in both CC and TH.
Full Screen / Esc Printer-friendly Version Interactive Discussion
3
553
|
Estimation of forest parameters using airborne laser scanning data J. Cohen
Title Page Abstract
Introduction
Conclusions
References
Tables
Figures
J
I
J
I
|
Back
Close
Discussion Paper
25
5, 549–576, 2015
Discussion Paper
20
GID
|
15
Discussion Paper
10
The LIDAR data was first processed using LAStools, a toolbox for LiDAR processing created by Martin Isenburg, and then in SAGA GIS software (Conrad et al., 2015). In the validation, SAGA and Matlab were used. The production of the CC and TH maps was done in 2 steps. In the first step, a 1 and 2 m resolution vegetation height (VH) raster map was produced from the LIDAR point cloud data using LAStools and SAGA GIS. In the second step, 10 m resolution CC and TH maps were generated from 1 and the 2 m VH maps respectively, using SAGA GIS. There is no clear definition for minimum TH in the literature (Gschwantner et al., 2009), but several sources have specified outlines for a tree, such as a minimum height of 3 m (Delijska and Manoilov, 2004), minimum diameter of 12.7 cm and height of 4.6 m (Helms, 1998), or a minimum height of 10 m (Allaby, 1998). According to international definitions (FAO, 1998, 2004; UNECE/FAO, 2000) the height of shrubs (in maturity) is generally between 0.5 and 5 m. In this work, the minimum TH was set to 1.5 m, because especially in the northern boreal forests a typical tree can in many cases be very short. Vegetation under this height was considered low vegetation such as shrubs, bushes, grass etc. The whole process was automated using Python, including all LAStools and SAGA GIS processing steps, in order to enable faster processing for different areas. The script also enables running the process repeatedly while changing and optimizing the input parameters, such as the minimum TH, output resolution and calculation methods. In the next sub-sections, a detailed description of the processing steps (VH, CC and TH maps) is given.
|
5
Methods
Discussion Paper
higher boreal forest areas of Finland with mostly coniferous trees. Tuusula was chosen because it has relatively large areas covered by deciduous forests. Figure 2 shows the CC of all trees, the CC of only deciduous trees and the TH in whole Finland.
Full Screen / Esc Printer-friendly Version Interactive Discussion
5
Title Page Introduction
Conclusions
References
Tables
Figures
J
I
J
I
Back
Close
|
554
J. Cohen
Abstract
Discussion Paper
The 10 m resolution tree CC map was derived from the 1 m VH grid. The retrieved CC inside a 10 m × 10 m cell area was the relation (%) between the amount of 1 m tree pixels (above 1.5 m) and the total number of data pixels inside the 10 m cell. The pixel value was set to zero if the majority of the 1 m pixels inside a 10 m cell area were −1. It was noticed that CC was overestimated in areas where the SA was high, which can be
Estimation of forest parameters using airborne laser scanning data
|
25
Canopy closure
5, 549–576, 2015
Discussion Paper
3.2
GID
|
20
Discussion Paper
15
In the generation of the VH maps, the data was first processed in LAStools and then in SAGA GIS. In LAStools the files were unzipped, ground level was retrieved, height of each point above the ground level was calculated, and points where the scanning ◦ angle (SA) was more than 20 were removed. Points that were more than 0.5 m below the ground surface were ignored, because there is a high probability that these points are incorrect due to the double bounce effect, in which the laser beam is reflected more than once, and therefore the target is interpreted as being further away than it really is. Also points that were more than 30 m a.g.l. (above ground level) were ignored, because they were most probably representing objects such as high antennas or birds. VH grids in 1 and 2 m resolution, and scan angle grids in 2 m resolution were then created from the point clouds in SAGA GIS. The 1 m VH grids were used for the generation of the CC maps, and the 2 m VH grid was used in the TH generation. Table 1 lists all the processing steps for the generation of the 1 and 2 m VH maps. When converting point clouds to grids, maximum value gridding was preferred, because mean value gridding caused underestimation of the TH. The SA information was used to correct the effect of high inclination scanning to the retrieved CC maps. For a detailed explanation about the SA correction (see Sect. 3.2). Nodata areas in the point clouds usually indicated water areas due to the specular reflection of the laser beams over water surface causing very small signal coming back to the sensor. The pixel value of these nodata (water) areas was set to −1.
|
10
Vegetation height
Discussion Paper
3.1
Full Screen / Esc Printer-friendly Version Interactive Discussion
CCSA corrected = CCcos (SA). x
5
5, 549–576, 2015
Estimation of forest parameters using airborne laser scanning data J. Cohen
Title Page Abstract
Introduction
Discussion Paper
Conclusions
References
Tables
Figures
J
I
J
I
|
Back
Close
Discussion Paper
25
GID
|
20
Discussion Paper
15
|
Different values for the power x were tested, and the best results were achieved when x was 4. Two methods were used to find the best value for x, a visual test, and an analytical test. In the visual test CC maps were generated for different values of x, and the maps were compared against each other. The best value for x was decided based on the appearance of stripes in the CC maps. As the x was increased, the CC in areas under high SA was decreased. In the analytical test, CC maps were also generated for different values of x, but low SA areas were removed. The areas with high SA were compared with the reference MS-NFI CC data, and the best value for x was decided based on the correlation between the LiDAR CC and the MS-NFI CC maps (only in high scan angle areas). Table 2 gives a detailed description of the processing steps in the CC retrieval. When the 2 m VH maps were used as the input data for the retrieval, CC was notably overestimated. The reason for this overestimation was that when gridding the VH maps, some pixels were always partly over trees and partly over bare ground. These pixels were usually classified as trees, because in the maximum value gridding method the pixel value is determined by the highest point inside a grid cell. The result was that after the gridding, the trees became wider than in reality. Therefore, to decrease this error, it was decided to grid the point clouds to 1 m resolution. This was expected to decrease the width of the trees and bring it closer to their real width, which would eventually decrease the overall CC. Figure 3 shows an example of several trees which are seen from above by the laser scanner, and how the pixels are classified to trees or no trees when gridding to 2 and 1 m resolutions. From Fig. 3 it can be seen that the 2 m map would give a higher estimate for CC, because more area is classified as trees compared to the 1 m map. When gridding to 1 m resolution, more pixels are 555
|
10
(1)
Discussion Paper
explained by more laser beams hitting the canopy instead of the ground surface when coming in a more shallow angle towards the ground surface. The SA correction was done by using a pixel wise cosine correction:
Full Screen / Esc Printer-friendly Version Interactive Discussion
5
1. applying the circle shaped Laplace filter (radius of 3 pixels) on the 2 m VH grid;
Discussion Paper
25
4. picking the maximum value (height) inside each polygon;
J. Cohen
Title Page Abstract
Introduction
Conclusions
References
Tables
Figures
J
I
J
I
Back
Close
|
556
Estimation of forest parameters using airborne laser scanning data
|
3. converting the grid to a vector image such that each tree is a separate polygon,
5, 549–576, 2015
Discussion Paper
2. separating trees and bare ground by using a threshold value;
GID
|
20
The 10 m resolution TH map was derived from the 2 m VH grid. The pixel value of a 10 m × 10 m grid cell was set to zero if the majority of the 2 m pixels inside a 10 m grid cell were −1 (water). The pixel value was set to the mean value of the 2 m “low vegetation pixels” (between −0.05 and 1.5 m) if the 10 m grid cell did not contain any tree pixels (over 1.5 m), and water pixels were not the majority. The pixel value was set to the mean value of the “tree pixels” (above 1.5 m) if at least one 2 m pixel inside the 10 m grid cell area was higher than 1.5 m (a tree), and water pixels were not the majority. Table 3 gives a detailed description of the processing steps in the TH retrieval. When no filtering was applied on the TH grid, an underestimation of TH occurred, because the laser beams often hit the lower canopy of the trees thus lowering the average TH. The underestimation problem was corrected by filtering the 2 m VH map before creating the actual TH map (Table 3). Two different filtering methods were tested, Laplace (2nd derivative) filtering, and dilation (maximum value) filtering. The aim in the Laplace filtering method was to detect the individual trees from the VH map using a 2nd derivative filter and to find the maximum value (height) for each tree. This was done as follows:
Discussion Paper
15
Tree height
|
10
3.3
Discussion Paper
assigned nodata values, because no points are found within their area. However, these nodata pixels are scattered almost uniformly all over the area and they are ignored when calculating the relation between tree pixels and bare ground pixels, and therefore they do not distort the calculated CC.
Full Screen / Esc Printer-friendly Version Interactive Discussion
5
J. Cohen
Title Page Abstract
Introduction
Conclusions
References
Tables
Figures
J
I
J
I
Back
Close
Discussion Paper |
557
Estimation of forest parameters using airborne laser scanning data
|
25
In Fig. 4 an example of a transformation from point cloud to raster image is presented. Three main land cover types; water, low vegetation and forests can be recognized from the images. On the right side, a river having nodata values in the point cloud image is seen, which were set to −1 in the raster image. Low vegetation areas are next to the river and in the upper side of the images, and forested areas are seen in the rest of the image. From the point cloud image it can be seen that the distance between points is not always equal. In Fig. 5 the density of the points can be seen. The image shows the number of points inside 2 m × 2 m grid cells. The point density varies much and can be
5, 549–576, 2015
Discussion Paper
20
Results
GID
|
4
Discussion Paper
15
|
10
In the dilation filtering method a circle shaped dilation (maximum) filter with a radius of 2 pixels (4 m) was applied on the 2 m VH map. This method was much simpler and faster than the Laplace filtering method. The disadvantages of the Laplace method compared to the dilation filtering method were the long processing time and the failure to separate between individual trees in dense forests (CC over 40), because trees were too close to each other. Yet, the advantage of the Laplace method was that in sparse forests it was handling each tree separately and thus was expected to give more accurate estimates for the real TH. Therefore, it was decided to try combining the two approaches. In the combined method, for CC over 40, the dilation filtering method was used and for CC under 40, the Laplace filtering method was used. The results of the combined method were compared with the results of using only the dilation filtering method to all CC values. The comparison showed very small difference between the two methods, and therefore the Laplace method was completely abandoned due to the considerably longer processing time.
Discussion Paper
5. converting back to the original grid, but assigning the maximum value to all pixels inside a tree polygon.
Full Screen / Esc Printer-friendly Version Interactive Discussion
J. Cohen
Title Page Abstract
Introduction
Conclusions
References
Tables
Figures
J
I
J
I
Back
Close
Discussion Paper |
558
Estimation of forest parameters using airborne laser scanning data
|
The produced CC and TH maps were validated against corresponding MS-NFI datasets. The MS-NFI data were in 20 m resolution, and therefore for validation purposes, the CC and TH maps were processed to the same 20 m resolution grid. Validation was performed for eight different sites across Finland; Saariselkä, Kittilä and Sodankylä in the North, Pudasjärvi and Kajaani in Central, and Evo, Miehikkälä and Tuusula in the South of Finland. The location of the test areas can be seen in Fig. 1. Figure 10 shows the validation results of the CC maps, and Fig. 11 the validation results of the TH maps for the eight test areas. Water and urban areas were masked from the final products by using Corine 2006. To validate only deciduous forests, the Tuusula area was chosen, because compared to other areas in Finland, it has a large proportion of deciduous forests. Still, only 14 % from the total forested areas were deciduous forests according to CLC2006. Coniferous forests constituted 37 %, mixed forests 30 %
5, 549–576, 2015
Discussion Paper
25
Validation
GID
|
20
5
Discussion Paper
15
|
10
Discussion Paper
5
between 0 to more than 10 points per grid cell. The overlapping flight line areas are recognized easily from this image, because the point density in them is much higher. In Fig. 6, an example of a VH map from Saariselkä is presented in 1 and 2 m resolution. In the 1 m VH map the width of the trees is more accurate than in the 2 m VH map, but due to the distance between points in the LiDAR data, which is often more than 1 m, part of the pixels are left with nodata values. However, as said, this does not affect the CC results as the nodata gaps inside 10 m×10 m grid cells are mostly equally distributed. The gridding to 2 m also left some one cell nodata gaps which were then filled based on the adjacent pixel values. The influence of the SA correction is quite significant in areas of high SA. A difference image in Fig. 7 shows the difference between CC before the SA correction and CC after the SA correction in Sodankylä. In Fig. 8, the produced CC maps are presented for Sodankylä, Kajaani, Miehikkälä and Tuusula, and in Fig. 9 the produced TH maps are presented for the same test areas.
Full Screen / Esc Printer-friendly Version Interactive Discussion
Estimation of forest parameters using airborne laser scanning data J. Cohen
Title Page Abstract
Introduction
Conclusions
References
Tables
Figures
J
I
J
I
|
Back
Close
Discussion Paper |
559
5, 549–576, 2015
Discussion Paper
25
GID
|
20
Discussion Paper
15
|
10
Discussion Paper
5
and sparse forests 19 % of the total forested areas in Tuusula test area. Nevertheless, the amount of deciduous forest pixels was 36 622 (in the 20 m product), which is enough for conducting a proper statistical analysis. Generally, the LiDAR based CC corresponded well with the MS-NFI CC data. In Northern and Central Finland the RMSE between LiDAR based and MS-NFI CC was between 11.5 and 15.4 percent points (PP), and the bias was between 0.74 and 2.73 PP, not including Kittilä. In Southern Finland the RMSE was between 19.8 and 20.07 PP and the bias between −4.94 and −1.15 PP. If only deciduous dominant forests in Tuusula were included, RMSE was 21.5 and bias −8.56 PP. In some of the test areas a tendency of underestimation in low CC or/and overestimation in high CC areas was observed, such as in Saariselkä, Miehikkälä, Evo, Tuusula, and somewhat in Kajaani and Sodankylä. In Kittilä, an overestimation occurred in most CC values increasing the total bias to 8.65 and RMSE to 17.1 PP. As expected, the CC in deciduous dominated forests of Tuusula was underestimated, but not more than ∼ 10 PP, and only in denser forests. The best similarity between the LiDAR based and the MS-NFI TH was achieved in the Northern and Central Finland test areas; Saariselkä, Kittilä, Sodankylä, Pudasjärvi and Kajaani. There, the RMSE between LiDAR based and MS-NFI TH was between 3.09 and 4.25 m, and the bias between −0.52 and 1.14 m. In Southern Finland the RMSE was between 5.90 and 6.91 m, and bias between 0.40 and 0.98 m. The TH was usually underestimated for the highest trees of the different test areas. In Southern Finland, and also somewhat in Kajaani, the TH was typically overestimated in low TH and underestimated in high TH areas. In the deciduous dominant forests of Tuusula this effect was more prominent. The weaker precision of LiDAR based CC and TH results (larger RMSE) in Southern Finland compared to Northern and Central Finland can also be explained by the larger variation in CC and TH.
Full Screen / Esc Printer-friendly Version Interactive Discussion
5
Estimation of forest parameters using airborne laser scanning data J. Cohen
Title Page Abstract
Introduction
Conclusions
References
Tables
Figures
J
I
J
I
|
Back
Close
Discussion Paper |
560
5, 549–576, 2015
Discussion Paper
25
Acknowledgements. This work was supported by the Academy of Finland Center of Excellence in Atmosphere Science (CoE ATM). National Land Survey of Finland is acknowledged for providing the LiDAR data, and Natural Resources Institute Finland for providing the MS-NFI forest data.
GID
|
20
Discussion Paper
15
A method for generating 10 m resolution CC and TH maps from LiDAR point cloud data collected by NLS in early spring has been presented in this report. The processing chain has been fully automated for easier and faster processing. In this method, 1 and 2 m VH grids were derived from the point cloud data and used in the retrieval of CC and TH maps respectively. Appropriate filtering and the use of scanning angle information from the point clouds were utilized to gain better accuracy. The method was evaluated in eight test areas across Finland having different forest characteristics, by comparing the retrieved CC and TH maps with the corresponding MS-NFI datasets generated by LUKE in 2012. Generally, this method shows good agreement between the LiDAR based and the MS-NFI datasets. Results were generally better in Northern and Central Finland than in Southern Finland. Early spring laser scanning in leaf-off conditions is not optimal for deciduous vegetation detection and was expected to cause underestimation of CC and TH. When only deciduous dominated forest areas were selected (in Tuusula area) the CC was indeed underestimated in high CC areas, and the underestimation of TH in high TH areas was more prominent. The effect of deciduous forests can hence be recognized, but in practice, the effect is not major because vast majority of the Finnish forests are coniferous dominated. For a more reliable accuracy assessment, the results should be validated against ground true data in the future, as some discrepancies between the LiDAR and the MS-NFI data may also result from inaccuracies in the MS-NFI data.
|
10
Conclusions
Discussion Paper
6
Full Screen / Esc Printer-friendly Version Interactive Discussion
5
J. Cohen
Title Page Abstract
Introduction
Conclusions
References
Tables
Figures
J
I
J
I
Back
Close
Discussion Paper |
561
Estimation of forest parameters using airborne laser scanning data
|
30
5, 549–576, 2015
Discussion Paper
25
GID
|
20
Discussion Paper
15
|
10
Allaby, M.: A dictionary of plant sciences, Oxford University Press, 508 pp., 1998. Conrad, O., Bechtel, B., Bock, M., Dietrich, H., Fischer, E., Gerlitz, L., Wehberg, J., Wichmann, V., and Böhner, J.: System for Automated Geoscientific Analyses (SAGA) v. 2.1.4, Geosci. Model Dev., 8, 1991–2007, doi:10.5194/gmd-8-1991-2015, 2015. Delijska, B. and Manoilov, P.: Elsevier’s dictionary of forestry, Elsevier, Amsterdam, 1051 pp., 2004. FAO: The Global Forest Resources Assessment 2000 (FRA 2000): Terms and definitions, FRA Working Paper 1, FAO Forestry Department, Rome, 1998. FAO: Global Forest Resources Assessment update 2005 (FRA 2005): Terms and definitions, FRA Working Paper 83/E, FAO Forestry Department, Rome, 34 pp., 2004. Gschwantner, T., Schadauer, K., Vidal, C., Lanz, A., Tomppo, E., di Cosmo, L., Robert, N., Duursma, D. E., and Lawrence, M.: Common tree definitions for national forest inventories in Europe, Silva Fenn., 43, 303–321, 2009. Helms, J. A.: The dictionary of forestry, CAB International: the Society of American Foresters, Wallingford, 210 pp., 1998. Holopainen, M., Hyyppä, J., Vaario, L.-M., and Yrjälä, K.: Implications of technologial development to forestry, invited book chapter, in: Forest and Society – Responding to Global Drivers of Change, edited by: Mery, G., Katila, P., Galloway, G., Alfaro, R. I., Kanninen, M., Lobovikov, M., and Varjo, J., IUFRO-World Series Vol. 25, Convening lead authors of the chapter: Hetemäki, L. and Mery, G., International Union of Forest Research Organizations (IUFRO), Vienna, 157–182, 2010. Holopainen, M., Hyyppä, J., Vastaranta, M., and Hyyppä, H.: Laserkeilaus metsävarojen hallinnassa, The Photogrammetric Journal of Finland – Special issue of the 80 years anniversary of the Finnish Society of Photogrammetry and Remote Sensing, 22, 128–149, 2011. Hyyppä, J., Hyyppä, H., Leckie, D., Gougeon, F., Yu, X., and Maltamo, M.: Review of methods of small-footprint airborne laser scanning for extracting forest inventory data in boreal forests, Int. J. Remote Sens., 29, 1339–1366, 2008. Hyyppä, J., Hyyppä, H., Yu, X., Kaartinen, H., Kukko, A., and Holopainen, M.: Forest inventory using small-footprint airborne lidar, in: Topographic Laser Ranging and Scanning: Principles
Discussion Paper
References
Full Screen / Esc Printer-friendly Version Interactive Discussion
5, 549–576, 2015
Estimation of forest parameters using airborne laser scanning data J. Cohen
Title Page Abstract
Introduction
Discussion Paper
Conclusions
References
Tables
Figures
J
I
J
I
|
Back
Close
Discussion Paper |
562
GID
|
20
Discussion Paper
15
|
10
Discussion Paper
5
and Processing, edited by: Shan, J. and Toth, C., CRC Press, Taylor & Fracis, London, 335– 370, 2009. Jennings, S. B., Brown, N. D., and Sheil, D.: Assessing forest canopies and understorey illumination: canopy closure, canopy cover and other measures, Forestry, 72, 59–74, 1999. Kaartinen, H., Hyyppä, J., Yu, X., Vastaranta, M., Hyyppä, H., Kukko, A., Holopainen, M., Heipke, C., Hirschmugl, M., Morsdorf, F., Næsset, E., Pitkänen, J., Popescu, S., Solberg, S., Wolf, B. M., and Wu, J.-C.: An international comparison of individual tree detection and extraction using airborne laser scanning, Remote Sens., 4, 950–974, 2012. Kankare, V., Vauhkonen, J., Holopainen, M., Vastaranta, M., Hyyppä, J., Hyyppä, H., and Alho, P.: The Accuracy of National ALS Data in Biomass Mapping in Finland, European Biomass Conference and Exhibition proceedings, ETA-Florence Renewable Energies, 22nd European Biomass Conference and Exhibition, Hamburg, Germany, 2014. Naesset, E., Gobakken, T., Holmgren, J., Hyyppä, H., Hyyppä, J., Maltamo, M., Nilsson, M., Olsson, H., Persson, Å., and Söderman, U.: Laser scanning of forest resources: the Nordic experience, Scand. J. Forest Res., 19, 482–499, 2004. Tomppo, E., Haakana, M., Katila, M., and Peräsaari, J.: Multi-Source National Forest Inventory: Methods and Applications, Springer Netherlands, Dordrecht, 2008. UNECE/FAO: Forest resources of Europe, CIS, North America, Australia, Japan and New Zealand, Geneva Timber and Forest study papers 17, United Nations, New York and Geneva, 2000.
Full Screen / Esc Printer-friendly Version Interactive Discussion
Vegetation height, 2 m resolution
Vegetation height, 1 m resolution
2. 3.
4.
Decompress LASZIP files Remove high scanning angle Extracting ground points
5. 6.
8.
Closing one-cell gaps
Setting a value for water
Import point height and scan angle attributes Pixel values: – Point height grid: highest point in a 2 m grid cell – Scan angle grid: mean value of the absolute scan angle in a 2 m grid cell One-cell gaps are filled with a pixel value which is the mean value of the surrounding pixels. Setting nodata to −1
No closing gaps
Introduction
Conclusions
References
Tables
Figures
J
I
J
I
Back
Close
|
563
Pixel values: – Point height grid: highest point in a 1 m grid cell
Title Page Abstract
Discussion Paper
7.
Import LAS point files to SAGA Converting point files to grids
J. Cohen
|
SAGA processing:
Estimation of forest parameters using airborne laser scanning data
Discussion Paper
Parameters: – Forest or hills – Default step size (5 m) Height above the ground level is calculated for each point. Points 0.05 m below and 30 m a.g.l. were ignored.
5, 549–576, 2015
|
Calculating height above ground level
Areas with scanning angle higher than 20 ◦ were removed
Discussion Paper
1.
|
LAStools processing:
Discussion Paper
Table 1. Processing steps for generating the 1 and 2 m VH maps.
GID
Full Screen / Esc Printer-friendly Version Interactive Discussion
Discussion Paper
Table 2. Processing steps in the retrieval of CC.
|
2.
3. 4.
5. 6.
Reclassify zero values to nodata from the water grid Resample Scan Angle (SA) grid to 10 m resolution Reclassify SA grid Calculate SA correction to CC grid Merge the 10 m resolution grids (water, trees)
The output is the absolute scan angle (values between 0 ◦ and 20 ), where the value in each 10 grid cell is the mean value of the 2 m pixels Water areas in scan angle grid are reclassified to 0 CCSAcorrected = CC · (cos(SA))4 where SA is the scan angle. In case of overlapping cells, the value from the first grid is used
Introduction
Conclusions
References
Tables
Figures
J
I
J
I
Back
Close
|
564
Title Page Abstract
Discussion Paper
7.
Trees grid and water grid are resampled to 10 m
J. Cohen
|
Output grids are in 1 m resolution – Trees grid: low vegetation pixels (between 0 to 1.5) are set to zero, water (−1) is set to nodata and tree pixels (above 1.5 m) are set to 100 – Water grid: all other values except water (−1) are set to zero. – Trees grid: new value is the mean value of the 1 m pixels – Water grid: new value is the majority value from the 1 m pixels
Create two grids from the original vegetation height grid
Estimation of forest parameters using airborne laser scanning data
Discussion Paper
1.
5, 549–576, 2015
|
Details
Discussion Paper
Processing step
GID
Full Screen / Esc Printer-friendly Version Interactive Discussion
Discussion Paper
Table 3. Processing steps in the retrieval of TH. |
2.
Filtering
3.
Create three 10 m grids by resampling the 2 m grids
4. 5.
In case of overlapping cells, the value from the first grid is used
Introduction
Conclusions
References
Tables
Figures
J
I
J
I
Back
Close
|
565
Title Page Abstract
Discussion Paper
Reclassify zero values to nodata from the water-grid Merge the 10 m resolution grids (water, tree height, low vegetation)
J. Cohen
|
Output grids are in 2 m resolution – Tree height grid: low vegetation (between 0 to 1.5) and water (−1) are set to nodata. – Water grid: all other values except water (−1) are set to zero. A circle shaped dilation (maximum) filter with a radius of 2 pixels is applied on the tree height grid – Tree height grid: new value is the mean value of the 2 m pixels of the tree height grid – Low vegetation grid: new value is the mean value of the 2 m pixels of the vegetation height grid – Water grid: new value is the majority value of the 2 m pixels of the water grid
Create two grids from the original vegetation height grid
Estimation of forest parameters using airborne laser scanning data
Discussion Paper
1.
5, 549–576, 2015
|
Details
Discussion Paper
Processing step
GID
Full Screen / Esc Printer-friendly Version Interactive Discussion
Discussion Paper | Discussion Paper
Estimation of forest parameters using airborne laser scanning data J. Cohen
Title Page Abstract
Introduction
Discussion Paper
Conclusions
References
Tables
Figures
J
I
J
I
|
Back
Close
Discussion Paper |
566
5, 549–576, 2015
| Figure 1. The test areas are marked with red color. Saariselkä, Kittilä and Sodankylä in Northern Finland, Pudasjärvi and Kajaani in Central Finland and Evo, Miehikkälä and Tuusula in Southern Finland. The size of the red squares is proportional to the size of the test areas in reality.
GID
Full Screen / Esc Printer-friendly Version Interactive Discussion
Discussion Paper | Discussion Paper
Estimation of forest parameters using airborne laser scanning data J. Cohen
Title Page Abstract
Introduction
Discussion Paper
Conclusions
References
Tables
Figures
J
I
J
I
|
Back
Close
Discussion Paper |
567
5, 549–576, 2015
| Figure 2. CC of all trees, CC of only deciduous trees and average TH in whole Finland. Source: Paikkatietoikkuna, MS-NFI (LUKE, 2015).
GID
Full Screen / Esc Printer-friendly Version Interactive Discussion
Discussion Paper | Discussion Paper
Estimation of forest parameters using airborne laser scanning data J. Cohen
Title Page Abstract
Introduction
Discussion Paper
Conclusions
References
Tables
Figures
J
I
J
I
|
Back
Close
Discussion Paper |
568
5, 549–576, 2015
| Figure 3. Gridded 2 m VH on the left side and 1 m VH on the right side. Red color indicates trees, blue color low vegetation or bare ground and white is nodata. The total area covered by the canopy is larger in the 2 m image, because pixels that are partly over trees and partly over ground are usually classified as trees, because the pixel value is determined by the higher point inside a grid cell. Therefore using 1 m VH maps as input to CC retrieval was preferred. UTM coordinates and length in m is shown in the outline.
GID
Full Screen / Esc Printer-friendly Version Interactive Discussion
Discussion Paper | Discussion Paper
Estimation of forest parameters using airborne laser scanning data J. Cohen
Title Page Abstract
Introduction
Discussion Paper
Conclusions
References
Tables
Figures
J
I
J
I
|
Back
Close
Discussion Paper |
569
5, 549–576, 2015
| Figure 4. An example area where the VH is shown as a point cloud (upper panel) and as a 2 m resolution grid (lower panel). On the right side there is a river, which has nodata in the point cloud but in the gridded image it has been set to −1. Next to the river and on the upper side of the image there are low vegetation areas, and the rest of the areas are forested. UTM coordinates and length in m is shown in the outline.
GID
Full Screen / Esc Printer-friendly Version Interactive Discussion
Discussion Paper | Discussion Paper
Estimation of forest parameters using airborne laser scanning data J. Cohen
Title Page Abstract
Introduction
Discussion Paper
Conclusions
References
Tables
Figures
J
I
J
I
|
Back
Close
Discussion Paper |
570
5, 549–576, 2015
| Figure 5. Points per 2 m grid cell. The density of the point clouds varies between 0 to more than 10 points per 2 m grid cell. The white areas are grid cells where no points were found (river). One cell gaps were filled using the surrounding grid values, and larger gaps were considered water and marked as −1. Point density under the overlapping flightline areas is higher than in other areas. UTM coordinates and length in m is shown in the outline.
GID
Full Screen / Esc Printer-friendly Version Interactive Discussion
Discussion Paper | Discussion Paper
Estimation of forest parameters using airborne laser scanning data J. Cohen
Title Page Abstract
Introduction
Discussion Paper
Conclusions
References
Tables
Figures
J
I
J
I
|
Back
Close
Discussion Paper |
571
5, 549–576, 2015
| Figure 6. VH map in 1 m (upper panel) and 2 m (lower panel) resolution from Saariselkä. When gridding the point cloud to 1 m resolution, more nodata cells are left in the image, but the width of the trees is closer to reality than when gridding to 2 m resolution. UTM coordinates and length in m is shown in the outline.
GID
Full Screen / Esc Printer-friendly Version Interactive Discussion
Discussion Paper | Discussion Paper
Estimation of forest parameters using airborne laser scanning data J. Cohen
Title Page Abstract
Introduction
Discussion Paper
Conclusions
References
Tables
Figures
J
I
J
I
|
Back
Close
Discussion Paper |
572
5, 549–576, 2015
| Figure 7. A difference image showing the effect of SA correction in Sodankylä. The SA correction can lead to a difference of more than 10 percentage points in the retrieved CC in high scanning angle areas. UTM coordinates and length in m is shown in the outline.
GID
Full Screen / Esc Printer-friendly Version Interactive Discussion
Discussion Paper | Discussion Paper
Estimation of forest parameters using airborne laser scanning data J. Cohen
Title Page Abstract
Introduction
Discussion Paper
Conclusions
References
Tables
Figures
J
I
J
I
|
Back
Close
Discussion Paper |
573
5, 549–576, 2015
| Figure 8. CC in Sodankylä (upper left panel), Kajaani (upper right panel), Miehikkälä (lower left panel) and Tuusula (lower right panel). UTM coordinates and length in m is shown in the outline.
GID
Full Screen / Esc Printer-friendly Version Interactive Discussion
Discussion Paper | Discussion Paper
Estimation of forest parameters using airborne laser scanning data J. Cohen
Title Page Abstract
Introduction
Discussion Paper
Conclusions
References
Tables
Figures
J
I
J
I
|
Back
Close
Discussion Paper |
574
5, 549–576, 2015
| Figure 9. TH in Sodankylä (upper left panel), Kajaani (upper right panel), Miehikkälä (lower left panel) and Tuusula (lower right panel). UTM coordinates and length in m is shown in the outline.
GID
Full Screen / Esc Printer-friendly Version Interactive Discussion
Discussion Paper | Discussion Paper
Estimation of forest parameters using airborne laser scanning data J. Cohen
Title Page Abstract
Introduction
Discussion Paper
Conclusions
References
Tables
Figures
J
I
J
I
|
Back
Close
Discussion Paper |
575
5, 549–576, 2015
| Figure 10. Validation of LiDAR CC against corresponding MS-NFI data from Saariselkä, Kittilä, Sodankylä, Pudasjärvi, Kajaani, Evo, Miehikkälä, Tuusula and only deciduous dominant forest in Tuusula.
GID
Full Screen / Esc Printer-friendly Version Interactive Discussion
Discussion Paper | Discussion Paper
Estimation of forest parameters using airborne laser scanning data J. Cohen
Title Page Abstract
Introduction
Discussion Paper
Conclusions
References
Tables
Figures
J
I
J
I
|
Back
Close
Discussion Paper |
576
5, 549–576, 2015
| Figure 11. Validation of LiDAR TH against corresponding MS-NFI data from Saariselkä, Kittilä, Sodankylä, Pudasjärvi, Kajaani, Evo, Miehikkälä, Tuusula and only deciduous dominant forest in Tuusula.
GID
Full Screen / Esc Printer-friendly Version Interactive Discussion