Oriela Kodra* -1-
07 (30) 2011
ESTIMATION OF WEIGHTS FOR THE MONETARY CONDITIONS INDEX IN ALBANIA
* Oriela Kodra: Research Department, Bank of Albania e-mail:
[email protected] The views expressed herein do not necessarily represent those views of the Bank of Albania.
-2-
CONTENTS Abstract
5
1. Introduction
6
2. Analyzing the Data
8
3. The Monetary Conditions Index for Albania
10
4. Conclusions
14
References
16
Appendix A - Figures
18
Appendix B - Tables
20
-3-
-4-
Abstract Monetary Conditions Index is used as an indicator of the orientation of monetary policy. Monetary conditions represent the combined effect of interest rates and the exchange rate on the economy. This study aims at assessing the relative weights of the real interest rates and the real exchange rate in the case of Albania. The methodology is based on OLS estimation and considers quarterly data for the period 1998Q1–2008Q4. The new ratio derived from these weights is equal to 3.8, which implies that the effect of an appreciation of the real exchange rate by 3.8 percentage points may be neutralized by a 1 percentage point increase in the real interest rate. JEL Classifications: C22, E52, E59. Keywords: Monetary Conditions Index, Exchange Rate, Interest Rate, OLS.
-5-
1. INTRODUCTION Monetary Conditions Index (MCI) was first introduced by the Central Bank of Canada [Freedman (1995)] and then many banks and international institutes used this index as a mechanism to interpret the orientation of monetary policy and the effect it has on the economy. MCI is calculated as the linear combination of the variables which represent the main channels of monetary policy transmission in an open economy: the real interest rate and the real effective exchange rate where the coefficients represent their relative effects on aggregate demand. The aim of this index is to give information about monetary conditions. The MCI considers both changes in interest and exchange rates, expressed in real terms. The index is a weighted average of these two indicators and can be used to determine whether monetary conditions in any economy have been “loosened” or “tightened”. It summarizes in a single number the pressure that monetary policy is exercising at any point in time on the economy and, therefore, on inflation. Through the interest rate and the exchange rate, monetary policy can affect both economic activity and inflation. Loose monetary conditions are expected to support economic growth, while growth is not supported in neutral monetary conditions. It should be noted that the components of the monetary conditions index do not necessarily affect the economy in the same direction. For example, the exchange rate can be estimated as “loosened” and the interest rate as “tightened”, and vice versa. In determining monetary conditions, the interest rate plays the crucial role, while the exchange rate responds to the interest rate: lower interest rates in a given period tend to bring in low returns on local currency and hence a weaker exchange rates, and vice versa. Monetary policy affects inflation mainly through two channels: the interest rates and the exchange rate. An increase in either one causes a slowdown in growth and a decline in inflationary pressures. In a similar way, a decrease in interest rates or the exchange rate stimulates the economy and can lead to higher inflationary pressures. So, the aim of the construction of the MCI is to consider both these channels.
-6-
The MCI, at time t, is determined as the weighted sum of changes in the interest rate (i) and the exchange rate (e) from their levels in a base year (t=0), and can be written as:
(1)
Where, and are, respectively, the weights of the interest rate and the exchange rate. According to Tase (2006), in the case of Albania, the Monetary Conditions Index (MCI) is the weighted average of changes in the base interest rate (REPO) and the nominal effective exchange rate of lek (NEER) relative to a base period. The ratio of this index was estimated at 1.82:1, meaning that the effect of a depreciation of the exchange rate of 1.82 percentage points can be offset by a 1 percent increase in the interest rate. The base period of the Estimation of MCI was September 2000. The estimate of the ratio of Monetary Conditions Index in the case of Albania was made through calibration based on IMF (2004). Such an approach is rather indirect and not quite precise. Hence, following the need for a new method, and given greater data availability, I calculate the average weights of the interest rate and the exchange rate in the case of Albania in this paper. This methodology is based on OLS estimation and considers quarterly data for the period 1998Q1–2008Q4. The new ratio derived is 3.8, implying that the appreciation of the real exchange rate (REER) by 3.8 percentage points can be neutralized by a 1 percentage point increase in the interest rate.
-7-
2. ANALYZING THE DATA This study begins by analyzing the stationary properties of the data. After that, the short-run dynamics of aggregate demand are estimated by OLS. Finally, the weights obtained for this equation are used in constructing the MCI for Albania. The analyses are performed using quarterly data and the sample covers the 1998Q12008Q4 period. Some of the variables are in logs. The data considered are the following: • REER, the effective exchange rate of LEK, based on foreign and domestic CPI (Consumer Price Index); • TB_3, the three month treasury bill rates; • TB_6, six month treasury bill rates; • TB_12, the twelve month treasury bill rates; • INF, the inflation; • GDP, the Gross Domestic Product. • GAP, the output gap as the percentage deviation of the real GDP from the potential one. Initially, unit root tests are conducted for each of these variables. These tests show that the null hypothesis can be rejected at the 5 percent level for inflation and it cannot be rejected for the Treasury bill rates and the effective exchange rate. In contrast, the unit root of the null hypothesis is rejected at the 5 percent level for the first difference of the Treasury bill rates and the effective exchange rate; hence, it is concluded that these variables are integrated of order one. Then, the coefficients of the Treasury bill rates and the exchange rate are estimated by OLS. In our equation the output gap is the dependent variable. Tables 1, 2 and 3 in appendix B show estimation results. In the three cases, the adjusted R-squared has a high value, respectively equal to 0.808, 0.833 and 0.834, which means that a high percentage of the variation in the dependent variable is explained by the explanatory variables considered. The high level of the F-statistic confirms the importance of the model. Durbin Watson values are within the range 2 with variation of +/- 0.2. We have also performed residual diagnostic tests and coefficient stability tests. Test results are summarized in tables 4
-8-
and 5 in appendix B. Therefore we can conclude that the model is statistically significant. From these coefficients we derive three different ratios for the Monetary Conditions Index, for the three-, six- and twelve-month Treasury bill rates, respectively equal to -2.16265, -4.96696 and -4.27701. Thereafter, we compute the simple mathematical average of these three ratios to obtain -3.8. Finally, we get the new ratio of the Monetary Conditions Index multiplying this value by -1, since a numerical increase in the REER indicates a depreciation of the LEK. Therefore, the new ratio of this index, derived by the new methodology, is equal to 3.8.
-9-
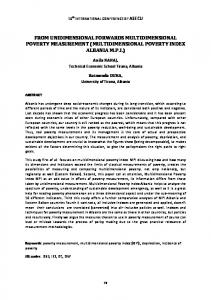
3. THE MONETARY CONDITIONS INDEX FOR ALBANIA For the construction of the Monetary Conditions Index for Albania monthly data are used for the period from January 1996 to September 2009. The base period of the estimation of MCI is January 1996. The real Monetary Conditions Index in the case of Albania is defined as: MCI = (Real_TB - Real_TB(base))*3.8 + (log(REER) – log(REER) (base)) + 100 (2) Where: Real_TB is the real Treasury bill rate; Real_TB(base) is the real Treasury bill rate at base year; REER is the Real Effective Exchange Rate; (REER)(base) is the Real Effective Exchange Rate at base year; 3.8 represent the value obtained from the ratio between the coefficients of the Real Treasury bill Rates and the coefficients of the Real Effective Exchange Rate. An increase in the Monetary Conditions Index indicates a tightening of monetary conditions; by contrast, a decrease in the MCI indicates an easing of monetary conditions relative to the base year. In the case of Albania, the MCI ratio is equal to 3.8, implying that the effect of a depreciation of the exchange rate of 3.8 percentage points is offset by a 1 percent increase in the interest rate. Figure 1 in the appendix A indicates the trend of the MCI for the January 2006 - September 2009 period, and its comparison with the real effective exchange rate and the real Treasury bill rates. The monetary activity, during 2007 and until the third quarter of 2008 and in contrast to the average term during the last 15 years, has shown significant improvements. These improvements were largely affected due to the corresponding exchange rate depreciation, which means loose economic conditions. Fluctuations in interest rates have not been a determining factor in the monetary conditions. The beginning of the financial crisis is reflected in the tightening of monetary conditions, due to increasing real interest rates. However, monetary conditions remain tight due to higher
-10-
real interest rates, which are the main determinants of MCI. We also construct another index, the Financial Conditions Index (FCI), using the real lending rate and the real effective exchange rate as variables. This index is a measure of financial conditions and it represents an attempt to capture the effect of the other channels of transmission of monetary policy. In fact it includes the lending rates to analyze the effect of the level of financial activity. The real Financial Conditions Index in the case of Albania is defined as: MCI = (Real_LR - Real_LR(base))*3.8 + (log(REER) – log(REER) (base)) + 100 (3) Where: Real_LR is the real lending rate and Real_LR(base) is the real lending rate at base year. It uses the same weights as the Monetary Conditions Index. Figure 3 in the appendix A indicates the trend of FCI for the January 2006 - September 2009 period, and its comparison with the real effective exchange rate and the real lending rates. In contrast to the average during the last 15 years, the financial activity has shown important improvements during 2007 and until the third quarter of 2008. The beginning of the financial crisis is characterized by tightening financial conditions, due to increasing real lending rates. After mid-2009, financial conditions have loosened due to the falling lending rates.
-11-
4. CONCLUSIONS The Monetary Conditions Index (MCI) represents an operational tool in the conduct of monetary policy. This index evaluates the impact of monetary policy implemented by central banks on the evolution of the economic cycle. The MCI represents the combined effect of the interest rate and exchange rate on the economy. This index is a weighted average of these two indicators. We also construct the Financial Conditions Index (FCI), which represents an attempt to capture the effect of the other channels. We use the real Treasury bill rates and the real effective exchange rate for MCI and the real lending rate and the real effective exchange rate for FCI. In this paper I estimated the ratio of the weights in the MCI using a new methodology in the case of Albania, based on OLS estimation. The MCI ratio estimated by this technique is 3.8:1, which means that the effect of a depreciation of the exchange rate of 3.8 percentage points is offset by 1 percent increase in the interest rate. The FCI uses the same weights as the MCI. Both indices give us additional information concerning monetary and financial conditions, respectively. In contrast to the average level of the indices during the last 15 years, in Albania the monetary and financial activity, during 2007 and until the third quarter of 2008, has shown significant improvements. These improvements were largely a result of a depreciation of the exchange rate. Fluctuations in interest rates have not been a determining factor in causing changes in monetary conditions. The beginning of the financial crisis is reflected in the tightening of monetary and financial conditions, due to increasing real interest rates. However, monetary conditions remain tight due to exchange rate movements and changes in Treasury bill rates. After mid-2009, there have been favorable financial conditions due to the falling lending interest rates.
-12-
REFERENCES Chang, H.S. (2005), “Estimating the Monetary Policy Reaction Function for Taiwan: A VAR Model”, The International Journal of Applied Economics, 2005, Vol.2, issue 1, 50-61. Jacobson, T. (1999), “A VAR Model for Monetary Policy Analysis in a Small Open Economy”, Journal of Applied Econometrics, 2001, 487-520. Kesriyeli, M and Kocaker, I.I. (1999), “Monetary Conditions Index: A monetary policy indicator for Turkey”, Central Bank of Turkey Discussion Paper, No: 9908. Kolasi, G, Shijaku, H and Shtylla, D. (2007), “Monetary Transmission Mechanism in Albania”, Bank of Albania, 7 th Conference of the Bank of Albania, Monetary Policy Strategies for Small Economies, December 2007. Lack, C.P. (2003), “A financial conditions index for Switzerland”, Monetary policy in a changing environment, Bank for International Settlements, 2003, vol.19, 398-413. Muço, M, Sanfey, P and Taci, A. (2004), “Inflation, exchange rates and the role of monetary policy in Albania”, Bank for Reconstruction and Development, Working Paper No. 88. Peters, M. (2005), “What about Monetary Transmission in Albania? Is the Exchange Rate Pass-Through (still) the Main Channel?”, Fifth annual conference of bank of Albania, Central Banking in the time of integration, March 2005. Shijaku, H. (2007), “An Investigation of Monetary Policy Transmission Mechanism in Albania”, Bank of Albania, unpublished paper, 2007. Tase, M. (2006), “Estimating a Monetary/Financial Conditions Index for Albania”, Bank of Albania, unpublished paper. Torój, A. (2008), “Estimation of Weights for the Monetary Conditions Index in Poland”, Department of Applied Econometrics Working Papers, Working Paper No. 6-08. Vika, I. (2007), “Role of Banks in the Monetary Policy Transmission in Albania”, Working Papers, Not Periodic Publications, 2009.
-13-
Appendix A – Figures Figure 1. MCI in comparison with REER and Real Interest Rates 180 130 80 30
2009M07
2008M10
2008M01
2007M04
2006M07
REER
2005M10
2005M01
2004M04
2003M07
2002M10
2002M01
MCI
2001M04
2000M07
1999M10
1999M01
1998M04
1997M07
1996M10
1996M01
-20
Real Interest Rate
MCI
-14-
2009M07
2008M10
2008M01
2007M04
2006M07
2005M10
2005M01
2004M04
2003M07
2002M10
2002M01
2001M04
2000M07
1999M10
1999M01
1998M04
1997M07
1996M01
200 180 160 140 120 100 80 60 40 20 0
1996M10
Figure 2. Monetary Conditions Index for the period 1996M01 - 2009M09
FCI
-15-
2009M08
2009M02
2008M08
2008M02
2007M08
REER
2007M02
2006M08
2006M02
2005M08
2005M02
2004M08
FCI
2004M02
2003M08
2003M02
2002M08
2002M02
2001M08
2001M02
2009M08
2009M02
2008M08
2008M02
2007M08
2007M02
2006M08
2006M02
2005M08
2005M02
2004M08
2004M02
2003M08
2003M02
2002M08
2002M02
2001M08
2001M02
2000M08
-20
2000M08
Figure 3. FCI in comparison with REER and Real Lending Rates
180
130
80
30
Real Lending Rate
Figure 4. Financial Conditions Index for the period 2000M08 – 2009M09
180
130
80
30
-20
Appendix B – Tables Table 1. OLS estimation of the three months Treasury bill rates Dependent Variable: GAP Method: Least Squares Date: 07/19/10 Time: 13:24 Sample: 1998Q1 2008Q4 Included observations: 44 Variable D(REER(-1)) D(BONO_3(-3)) D(INF(-5)) GAP(-1) GAP(-4) C R-squared Adjusted R-squared S.E. of regression Sum squared resid Log likelihood Durbin-Watson stat
Coefficient 0.169160 -0.365834 -0.306712 0.431393 0.242004 0.118298 0.830149 0.807800 1.859330 131.3701 -86.49753 2.085663
Std. Error t-Statistic Prob. 0.089161 1.897247 0.0654 0.178913 -2.044760 0.0479 0.098075 -3.127334 0.0034 0.107043 4.030080 0.0003 0.095481 2.534581 0.0155 0.312628 0.378400 0.7072 Mean dependent var -0.620206 S.D. dependent var 4.241113 Akaike info criterion 4.204433 Schwarz criterion 4.447732 F-statistic 37.14506 Prob(F-statistic) 0.000000
Table 2. OLS estimation of the six months Treasury bill rates Dependent Variable: GAP Method: Least Squares Date: 07/19/10 Time: 13:25 Sample: 1998Q1 2008Q4 Included observations: 44 Variable D(REER(-1)) D(BONO_6(-3)) D(INF(-5)) GAP(-1) GAP(-4) C R-squared Adjusted R-squared S.E. of regression Sum squared resid Log likelihood Durbin-Watson stat
Coefficient 0.142869 -0.709624 -0.313903 0.352671 0.324855 -0.014647 0.852644 0.833255 1.731834 113.9715 -83.37198 2.020142
-16-
Std. Error t-Statistic 0.081866 1.745158 0.217751 -3.258882 0.090224 -3.479170 0.104923 3.361232 0.094929 3.422080 0.295709 -0.049531 Mean dependent var S.D. dependent var Akaike info criterion Schwarz criterion F-statistic Prob(F-statistic)
Prob. 0.0890 0.0024 0.0013 0.0018 0.0015 0.9608 -0.620206 4.241113 4.062363 4.305661 43.97575 0.000000
Table 3. OLS estimation of the twelve months Treasury bill rates Dependent Variable: GAP Method: Least Squares Date: 07/19/10 Time: 13:27 Sample: 1998Q1 2008Q4 Included observations: 44 Variable D(REER(-1)) D(BONO_12(-3)) D(INF(-5)) GAP(-1) GAP(-4) C R-squared Adjusted R-squared S.E. of regression Sum squared resid Log likelihood Durbin-Watson stat
Coefficient 0.163905 -0.701024 -0.322242 0.354044 0.316702 -0.005670 0.852909 0.833555 1.730277 113.7666 -83.33240 1.991964
Std. Error t-Statistic 0.079557 2.060221 0.214230 -3.272287 0.089914 -3.583895 0.104591 3.385021 0.093331 3.393307 0.294503 -0.019251 Mean dependent var S.D. dependent var Akaike info criterion Schwarz criterion F-statistic Prob(F-statistic)
Prob. 0.0463 0.0023 0.0009 0.0017 0.0016 0.9847 -0.620206 4.241113 4.060564 4.303862 44.06862 0.000000
Table 4: Diagnostic tests – residuals
Equations
(1) - 3-months Treasury bill rates
(2) – 6-months Treasury bill rates
(3) – 12- months Treasury bill rates
Serial correlation (LM test) F-statistic p-value
2.26 0.11
1.04 0.36
1.40 0.25
White Heteroskedasticity F-statistic p-value
2.10 0.05
1.12 0.38
1.57 0.14
Normality J. Bera p-value
0.87 0.64
1.70 0.42
1.78 0.41
-17-
Table 5: Diagnostic tests – stability of coefficients
20
20
20
15
15
15
10
10
10
5
5
5
0
0
0
-5
-5
-5
-10
-10
-10
-15
-15
-15
-20
-20 00
01
02
03
CUS UM
04
05
06
07
08
-20 00
01
5% S ignificanc
02
03
04
CUS UM
05
06
07
08
00
1.6
1.6
1.2
1.2
1.2
0.8
0.8
0.8
0.4
0.4
0.4
0.0
0.0
0.0
-0.4 00
01
02
03
CUS UM of S quares
04
05
06
07
5% S ignificance
08
02
03
CUS UM
1.6
-0.4
01
5% S ignificance
04
05
06
07
08
07
08
5% S ignificance
-0.4 00
01
02
03
04
CUS UM of S quares
-18-
05
06
07
5% S ignificance
08
00
01
02
03
CUS UM of S quares
04
05
06
5% S ignificance
-19-
CIP Katalogimi në botim BK Tiranë Oriela Kodra Estimation of Weights for the Monetary Conditions Index in Albania/ / Kodra Oriela - Tirane: Banka e Shqipërisë, 2011 -20 f; 15.3 x 23 cm. (material diskutimi ..) Bibliogr. ISBN: 978-99956-42-35-8.
You may find this paper in the following address: www.bankofalbania.org If you want to receive a hard copy of this paper, write to us at: Banka e Shqipërisë Sheshi “Avni Rustemi”, Nr.24, Tiranë, Shqipëri Tel.: +355-(0)4-2419301; Faks: +355-(0)4-2419408 or send an e-mail to:
[email protected] Printed in 500 copies
-20-