fine-grain utilization monitoring to determine when to ... utilization monitoring in order to reduce rate switch ... Adaptive Link Rate (ALR) for full-duplex Ethernet.
Ethernet Adaptive Link Rate: System Design and Performance Evaluation Chamara Gunaratne and Ken Christensen Department of Computer Science and Engineering University of South Florida Tampa, Florida 33620 {pgunarat, christen}@cse.usf.edu Abstract
power use may be in the tens of Watts [5]. We have found that idle and fully utilized Ethernet links consume about the same amount of power. That is, Ethernet power consumption is independent of link utilization. Measurements suggest that utilization of desktop LAN links is in the range of 1% to 5% [1, 10]. Thus, there is opportunity for significant energy savings with only minimal impact to packet delay by operating links at a lower data rate during low utilization periods. Adaptive Link Rate (ALR) was first proposed in 2005 as a means of automatically switching the data rate of an Ethernet link to match link utilization [5]. ALR is designed to use existing data rates (e.g., 100 Mb/s, 1 Gb/s, and 10 Gb/s) and employ a fast MAC frame handshake mechanism to initiate switching of data rates (e.g., for the link between a desktop PC and first-level LAN switch). ALR policies determine when to switch the link data rate. A good policy should maximize the time spent in a low data rate while minimizing the increased packet delay. Both the mean delay and jitter need to be considered. Simple output buffer threshold policies can be problematic for smooth traffic where oscillation between data rates can occur. Oscillation can cause increased packet delay. In this paper we make three contributions: 1) present a system design of ALR, 2) solve the problem of rate oscillations by explicit sampling and use of link utilization, and 3) evaluate ALR for 1 Gb/s using a new synthetic traffic generator and simulation models. The remainder of this paper is organized as follows. Section 2 describes a simple dual-threshold ALR policy. Section 3 improves on this by including utilization monitoring in order to reduce rate switch oscillation. Section 4 describes a synthetic traffic generator. Section 5 contains a performance evaluation of the new utilization-threshold ALR policy. Section 6 describes related work. Section 7 is a summary and describes future work.
The Internet and the devices that connect to it consume a growing and significant amount of electricity. The utilization of desktop-to-switch Ethernet links is generally very low and thus there is a potential for energy savings by using an Adaptive Link Rate (ALR) protocol that matches link rate to utilization. In this paper, we design and evaluate a new ALR policy suitable for both bursty and smooth traffic. The policy uses output buffer thresholds and fine-grain utilization monitoring to determine when to switch link data rate. We develop a new traffic model for generating synthetic 1 and 10 Gb/s bursty traffic traces. Using this traffic model and simulation, we show that the new ALR policy is suitable for smooth traffic and also does not degrade performance for bursty traffic. Performance is measured in packet delay versus time in low (and energy saving) data rate.
1. Introduction The Internet is rapidly becoming a major consumer of electricity with measurable economic and environmental impacts. The physical infrastructure of the Internet was estimated to consume over 6 TWh/yr in 2000 [11]. In addition to the network equipment at the core of the Internet are all the desktop PCs and new commercial and residential devices that connect to the Internet via Ethernet links. An estimate of the energy use of the Ethernet NICs in desktop PCs alone in the US is about 5.3 TWh/yr in 2005 [9]. One TWh/yr corresponds to $80 million at $0.08 per kW/hr and about 0.75 million tons of CO2. Energy use is growing as the default Ethernet link data rate for desktop PCs increases from 10 Mb/s to 100 Mb/s to 1 Gb/s (and to 10 Gb/s likely in the not too far future). Measurements show that 1 Gb/s Ethernet links consume about 4 W more than 100 Mb/s links [5]. For 10 Gb/s links the
1-4244-0419-3/06/$20.00 ©2006 IEEE
28
HIGH 1
LOW (reqLow == true) ∧ (tRetry expired) ∧ (qLen < qLow) send goto low MAC frame, reset tRetry (receive an ACK) ∨ (detect link resynchronization) resynchronize link
2 3
4 5
receive a NACK reqLow = false (receive goto low MAC frame) ∧ (qLen < qLow) send ACK, resynchronize link (receive goto low MAC frame) ∧ (qLen < qLow) send NACK, reqLow = true receive goto high MAC frame send ACK, resynchronize the link
6
WAIT (receive an ACK) ∨ (detect link resynchronization) resynchronize link receive goto high MAC frame send ACK, resynchronize the link
7 9 10
qLen > qHigh 8 send goto high MAC frame, reset tRetry tRetry expired
Figure 1. FSM for initiating and responding to rate change request
2. ALR Mechanism and Policy
tRetry qLow qHigh qLen reqLow
Adaptive Link Rate (ALR) for full-duplex Ethernet was first proposed in 2005 [5], presented to the IEEE 802.3 in a tutorial session [9], and later a dualthreshold policy was analytically modeled [6]. ALR has both a mechanism and policy. The ALR mechanism implements the actual link data rate switch including a handshake to initiate and agree on a data rate switch and then the link resynchronization. The ALR policy determines when to invoke a link data rate switch. We consider only two data rates, low (e.g., 100 Mb/s) and high (e.g., 1 or 10 Gb/s). At link initialization the capability for ALR at both ends of a link (e.g., in a NIC in a desktop PC and switch port in a LAN switch) could be determined via existing Ethernet Auto-Negotiation. The ALR link data rate switch could be initiated via a fast two-way MAC frame handshake. The end of the link that determines a need to increase or decrease its data rate sends a “goto high” or “goto low” ALR MAC frame to the other end of the link. The receiving end then replies with an ACK (agrees to switch the data rate) or NACK (does not agree). Following an agreement to switch the data rate, the link is resynchronized at the new data rate. The time required for completing the
Timer for handshake retry (ACK, NACK lost) Queue low threshold in bytes Queue high threshold in bytes Queue length in bytes Request low rate flag (this side to request)
Figure 2. FSM timers, parameters, and variables
handshake and link resynchronization, Tswitch, is critical to the performance of ALR. The simplest ALR policy is based on threshold crossing. The dual-threshold policy is shown in the finite state machine (FSM) of Figure 1 where the queue thresholds are qLow and qHigh. Figure 2 defines the FSM timers, system parameters, and internal variables. The states HIGH and LOW correspond to the high and low link data rates. Timers are expired when not timing, and when reset they begin to count down to their expired condition. The actions to be taken if link resynchronization fails are not shown. It is assumed that one side starts (e.g., at link initialization) with reqLow as true and the other side with it as false and both sides are in HIGH state. If the output buffer queue length in a NIC or switch port exceeds qHigh, then the data rate must be transitioned to high (shown in transition 8 in Figure 1).
29
link
Mean response time (ms)
desktop PC
link rate is high or low
ALR ACK/NACK link
packets
qHigh
qLow
output buffer in NIC w/ queued packets
1.6 1.4 1.2 1.0 0.8 0.6 0.4 0.2 0.0
Dual-threshold policy M/D/1 at 100 Mb/s M/D/1 at 1Gb/s
0
10
20
30
40
50
60
70
80
90 100
Utilization (% of 1 Gb/s)
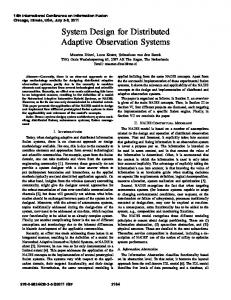
Figure 3. Output buffer with thresholds
Figure 4. Performance of dual-threshold policy
Then the only possible response is an ACK. That is, the other side cannot disagree with a request to increase the link data rate. If the output queue decreases below qLow, then the data rate can be reduced to low if both sides agree (shown in transitions 1 and 2 in Figure 1). If the other side does not agree (i.e., returns a NACK, shown in transition 3), it is now this other side that must request the low data rate when its condition (for qLow) is below threshold. The transitions 4 and 5 show the other side requesting to reduce the rate to low and this side agreeing (ACK in transition 4) or not agreeing (NACK in transition 5). The internal variable reqLow in the FSM is used to prevent one side from repeatedly requesting to reduce the data rate when the other side cannot agree with the request (i.e., if one side has a high utilization and the other side is idle). There is a small window where both sides could get stuck in HIGH state with reqLow as false. This would occur only if a NACK is lost, and then both sides simultaneously request a low data rate and also simultaneously reply with a NACK. This rare condition can be detected with a timer; this is not shown in the FSM.
experiment using Poisson (smooth) arrivals of packets of constant length 1500 bytes. The system (without ALR) can thus be modeled as an M/D/1 queue. The two dashed line curves in Figure 4 show mean packet delay (for M/D/1) as a function of increasing arrival rate for 100 Mb/s and 1 Gb/s data rates. As the arrival rate (the utilization) increases when in low link data rate, the packet delay will reach an unacceptable level. At some utilization level less than 10%, the data rate should be switched to the high rate and remain in the high rate. Using a simulation model of an ALR controlled queue developed and validated in [6], we measure the mean packet delay and number of data rate transitions for qLow = 0 KB, qHigh = 32 KB, and Tswitch = 1 ms. We assume that all ALR data rate switch requests are ACKed. The mean packet delay for the ALR-controlled queue is the solid line curve in Figure 4. It can be seen that mean response time increases similarly to M/D/1 curve for 100 Mb/s but does not decline once the arrival rate (utilization) is greater than 100 Mb/s (which occurs at 10% utilization at 1 Gb/s). This is due to the dual-threshold policy causing the link data rate to oscillate between 100 Mb/s and 1 Gb/s. For example, at 50% utilization the dualthreshold ALR policy results in a mean packet delay of about 1 ms (i.e., approximately the value of Tswitch) when operation at 1 Gb/s would result in a mean packet delay of about 0.04 ms. At the 50% utilization level with ALR, 49% of the time is spent in rate switching and an insignificant amount of time is spent in processing packets at the 100 Mb/s (energy saving) data rate (by the time the data rate switches from high to low, the queue length has exceeded qHigh).
3. ALR Policy for Smooth Traffic A significant open problem with the dual-threshold ALR policy is how to handle smooth traffic at high utilization levels for the low rate. Oscillation of link rate will occur if the packet arrival rate at the low link data rate is high enough to cause a high threshold crossing (at the low data rate), but not high enough to maintain the queue length above the low threshold at the high data rate. Consider a system with high link data rate of 1 Gb/s and a low link data rate of 100 Mb/s. Packets arrive into an output buffer, for example in the NIC in a desktop PC, as shown in Figure 3. To study the problem of link rate oscillation we conducted an
3.1 The New Utilization-Threshold ALR Policy If link utilization is explicitly monitored and used in the decision to transition between data rates, the effect of oscillations on packet delay seen in Figure 4 can be
30
MONITOR
Table 1. Characteristics of actual (traced) traffic
1
packet transmission completed txSum = txSum + txLen
2
tUtil expired uBytes = txSum, txSum = 0, reset tUtil
Trace USF #1 USF #2 USF #3 PSU #1 PSU #2 PSU #3
Burst Len 17.5 KB 14.6 24.1 26.7 642.8 24.4
CoV 1.76 2.18 13.95 2.21 6.07 3.54
Hurst 0.66 0.76 0.82 0.73 0.91 0.91
Util(1) 4.11% 2.63 0.03 0.13 1.01 1.03
(1) Computed at 100 Mb/s (1518 byte packets assumed for PSU)
(z = 1.96 for 95% confidence), and n the number of samples. The number of samples required for a margin of error of µa is then,
Figure 5. FSM for utilization monitoring tUtil uBytes uThresh txLen txSum
Timer for utilization measurement interval Utilization (bytes transmitted in last interval) Utilization threshold in bytes Transmitted packet length in bytes Transmitted bytes accumulator variable
n=
n=
reduced or eliminated. The FSM in Figure 5 shows monitoring for link utilization. Utilization monitoring is based on counting bytes sent in an interval tUtil. An explicit utilization test is added to transitions 1, 4, and 5 in Figure 1. The condition (qLen < qLow) is replaced with ((qLen < qLow) ∧ (uBytes < uThresh)). The changes to the FSM of Figure 1 and the new FSM in Figure 5 constitute the new utilization-threshold policy. Figure 6 shows the new timers, parameters, and variables. In this investigation, we assume the probability of loss of an ACK or NACK to be negligible. Thus, the system timers and parameters of interest that affect performance and need to be “tuned” are qLow, qHigh, tUtil, and uThresh. Most challenging is the setting of tUtil and uThresh.
(4)
4. Traffic Model for Evaluating ALR The policies developed for ALR need to be effective for future 1 and 10 Gb/s Ethernet traffic. Characterizations of existing 100 Mb/s desktop to LAN switch Ethernet links show that traffic is very bursty. Table 1 shows the traffic characteristics of six traffic traces, each of duration 30 minutes or greater, taken from operational Ethernet links in 2004 at the University of South Florida (USF) and Portland State University (PSU) [6, 8]. In Table 1 a “burst” is defined as one or more consecutive 10 millisecond time periods with 5% or greater utilization. Future 1 and 10 Gb/s Ethernet traffic will likely have very similar characteristics to the traffic on current 100 Mb/s links where the majority of traffic volume is in bursts and background “network chatter” (e.g., ARP broadcasts) is negligible. File transfer applications, such as P2P file sharing, are one common source of bursty traffic. In [3] Ethernet traffic is modeled as bursty with Cauchy distributed burst lengths and exponentially distributed idle inter-burst times. Due to the lack of a
For Poisson arrivals, the minimum value of tUtil needed to achieve a given margin of error and level of confidence can be derived. From the central limit theorem, the probability of a population mean, µ, being within a confidence interval is Pr (x − µa < µ < x + µa ) = p (1) where n
z2 . µa 2
With µ defined as a mean rate of packet arrivals per second, the number of samples (n) will correspond to the value of tUtil in seconds. For a link date rate of 1 Gb/s, fixed length 1500 byte packets, and 5% link utilization the mean rate of arrivals (µ) is 4166.67 packet arrivals per second. With a = 0.1 and z = 1.96, we get tUtil = 92.2 ms. In 92.2 ms (at 5% utilization of 1 Gb/s), uThresh is 576,250 bytes.
3.2 Analysis of tUtil Value
zs
(3)
For Poisson arrivals sample variance ( s 2 ) is the same as the mean number of arrivals in any sample size. Therefore,
Figure 6. New timers, parameters, and variables
µa =
z 2 s2 . µ 2a 2
(2)
and x is the sample mean, s the standard deviation of the sample, a the desired accuracy ( 0 < a < 1 ), z the normal variate for the desired confidence interval
31
Actual
Table 2. Actual versus synthetic traffic
Synthetic
Characteristic Mean inter-packet time (ms) CoV of inter-packet times Mean packet size (bytes) CoV of packet size Hurst parameter of packet counts Utilization (% of 100 Mb/s)
Pkts in bin
200 100 0 0
2
4
6
8
2 10 0 Time (s)
4
6
8
10
Packet counts with 10 ms bins
Pkts in bin
450 300 150 0 20
40
60
80 100 0 20 Time (s)
40
60
80 100
Packet counts with 100 ms bins Figure 7. Packet counts for different time scales
5. Evaluation of ALR
mean, the Cauchy distribution can be intractable to use. In [2] it is shown that traffic bursts follow a bounded Pareto distribution which follows from the distribution of file sizes of files stored in web servers. The probability distribution for the bounded Pareto is f ( x) =
αk α x −(α+1) α 1 − (k p )
Synthetic 1.06 3.81 526 1.15 0.64 3.95
synthetic traffic were k = 1518 bytes, p = 1 GB, α = 1.5, burst intensity of 80%, target utilization of 4%, and empirical packet size distribution based upon the actual packet size distribution of trace USF #1. The actual and synthetic traffic visually appear to be the same in Figure 7. Table 2 shows the summary statistics of the two traces further demonstrating the ability of the traffic generator to generate synthetic traffic with realistic measures. Note the large Hurst parameter value that indicates a high degree of self similarity in the traffic.
600
0
Actual 1.10 1.76 577 1.16 0.66 4.11
We studied the behavior and performance of the utilization-threshold policy using simulation models. The metrics of interest are mean response time (packet delay), time in low rate (energy savings), and time spent switching between rates. The parameter uThresh is the link utilization percentage during time period tUtil. We desire to operate a link at the low data rate for at most 50% utilization (measured at the low data, which is 5% utilization at the high data rate). We thus defined uThresh to be the number of bytes that can be transmitted at 5% link utilization in time tUtil at high data rate. The link is thus prevented from switching to low rate if the number of bytes transmitted during a tUtil time period exceeds the value of uThresh.
(5)
where k and p are the lower and upper bounds on possible values of f ( x ) and α is the Pareto index. We implemented a synthetic traffic generator to generate a text file containing time-stamps and packet length pairs as a synthetic traffic trace. Burst size (in bytes) is bounded Pareto distributed and inter-burst idle time is exponentially distributed. The input parameters to the traffic generator are: • Data rate (100 Mb/s, 1 Gb/s, or 10 Gb/s) • The minimum burst size in bytes (k) • The maximum burst size in bytes (p) • The Pareto index for bursts (α) • Burst intensity (as a percentage of link data rate) • Packet size distribution (packet size is fixed or empirically distributed) • Mean utilization or mean inter-burst time (if mean utilization is given, then this value is used to determine the mean inter-burst time) Figure 7 shows a time plot of packet counts for actual and synthetic 100 Mb/s traffic. The trace USF #1 with a utilization of 4% was used for the actual traffic. Two time scales (10 and 100 millisecond bins) are shown. The parameter values used for the
5.2 Simulation Models The dual-threshold and utilization-threshold policies were implemented in simulation models of an Ethernet NIC and a 16-port output queued switch. The Ethernet NIC model is the same as used in [6] for studying the dual-threshold policy. The switch model was developed and validated in [12]. For this study, ALR has been added to the output buffers. The simulation models are readily available from the authors. A single-server, variable service rate queue models an Ethernet NIC [6]. The inputs to the models are described in the experiment descriptions.
32
Mean response time (ms)
5.3 Simulation Experiments Simulation experiments were designed to evaluate the new utilization-threshold ALR policy and compare it to the dual-threshold policy. For the experiments described below, unless stated otherwise, qLow = 0 KB, qHigh = 32 KB, high and low data rates were 1 Gb/s and 100 Mb/s, and Tswitch = 1 ms. It was assumed that all ALR data rate switch requests are successfully ACKed. All experiments were run for at least 10 million packet arrivals. Unless otherwise noted, the values of tUtil were 0.1, 1, 10, and 100 ms. Two scenarios for future high-bandwidth Ethernet traffic were considered. Multiplayer gaming, virtual reality environments, and collaborative file sharing applications generate relatively small bursts of data with millisecond-scale inter-burst times. This scenario was evaluated in Bursty traffic experiment #1. A corporate or scientific network where gigabyte-scale datasets and backups are transferred several times per day (i.e., with many minutes or hours between bursts) was evaluated in Bursty traffic experiment #2. Network “background chatter” between bursts was considered to be negligible (very low in utilization). Smooth traffic experiment: The effect of varying tUtil for Poisson (smooth) traffic was studied in this experiment. A fixed-length packet size of 1500 bytes was used. The traffic utilization ranged from 1% to 95%. Single burst experiment: The transient effects of rate switching were studied in this experiment. A single burst comprised of Poisson traffic at 80% utilization and 0.4 seconds in duration was studied. Bursty traffic experiment #1: The traffic model described in Section 4 was used to generate synthetic traces with a mean burst size of 8.4 KB with target utilization ranging from 1% to 25%. The parameter values were k = 1518 bytes, p = 2.5 GB, α = 1.5, and burst intensity of 80%. The resulting Hurst parameter and CoV range from respectively 0.80 and 3.35 (1% utilization) to 0.81 and 2.33 (25% utilization). Bursty traffic experiment #2: The traffic model was used to generate synthetic traces with a mean burst size of 867 MB (mean burst duration is 9.09 seconds at 1 Gb/s) with inter-burst times ranging from 10 seconds to 100,000 seconds (approximately 1 day). The parameter values were k = 250 MB, p = 10 GB, α = 1.1, and burst intensity of 80%. The tUtil values studied were 1 ms, 10 ms, and 100 ms. Switch experiment: This experiment studied measurable energy savings in a LAN switch for a desktop to switch link. In [5] the power consumption
1.6 1.4 1.2 1.0 0.8 0.6 0.4 0.2 0.0
Dual-threshold tUtil = 0.1ms tUtil = 1ms tUtil = 10ms tUtil = 100 ms 0
10 20 30 40 50 60 70 80 90 100 Utilization (% of 1 Gb/s)
Figure 8. Results from smooth traffic experiment
of a Cisco Catalyst 2970 switch with no Ethernet links attached was measured to be 46 W. Each Ethernet link operating at 100 Mb/s or 1 Gb/s added an additional (measured) 0.3 W or 1.8 W, respectively, to the switch power consumption. All power measurements were made at the 120 VAC wall socket. We modeled a switch with 16 full-duplex Ethernet ports where input traffic streams were generated with the parameters used for Bursty traffic experiment #1. Utilization (switch offered load) was increased from 1% to 15% of the 1 Gb/s high data rate. All packets in a burst had the same destination port in the switch. The metrics of interest were power consumption (W) and mean switch delay for packets (time difference between entry and exit for a packet). The values of tUtil studied were 10 ms and 100 ms.
5.4 Simulation Results and Discussion The results from the Smooth traffic experiment are shown in Figure 8. In Section 3.2 it was calculated that the optimal tUtil value for detecting 5% link utilization Poisson traffic was 92 ms. In Figure 8 it can be observed that for tUtil = 100 ms, the mean response time was reduced when utilization exceeded 5% (at high data rate) due to the utilization-threshold policy detecting that the link utilization was greater than 5% and maintaining a constant 1 Gb/s link data rate. As the tUtil value decreased to 0.1 ms, the link utilization level at which the mean response time reaches its peak increased. This was due to the duration of tUtil being insufficient to receive the number of bytes that denotes link utilization greater than 5% during all tUtil time periods. Therefore, at the end of time periods where the uBytes < uThresh, the link rate was set to 100 Mb/s and this resulted in a greater response time, both due to the lower service rate and Tswitch duration. In this experiment we see that the analysis in Section 3.2 is validated by experimental results.
33
Mean response time (ms)
Response time (ms)
2.5
tUtil = 0.1 ms
2.0
Rate changes
1.5 1.0 0.5 0.0 0
0.1
0.2
0.3
0.4
0.5
1.6 1.4 1.2 1.0 0.8 0.6 0.4 0.2 0.0
0.6
tUtil = 100 ms
tUtil = 1ms tUtil = 10ms 0
5
Time (s)
15
20
25
Figure 10. Response time from bursty traffic #1
Table 3. Results from single burst experiment
100 Time in low rate (%)
Rate switch oscillations Mean response time (ms) Post burst lag (ms)
10
Utilization (% of 1 Gb/s)
Figure 9. Results from single burst experiment
Characteristic
Dual-threshold
tUtil value (ms) 0.1 1 10 100 12 2 2 2 0.19 0.05 0.05 0.05 0.19 1.19 12.2 102
The results for the Single burst experiment are shown in Figure 9 (only for tUtil = 0.1 ms) and Table 3. A spike in the response time denotes a rate switch. The initial rate switch occured at time = 0.1 second (which is the burst start time). For tUtil = 0.1 ms it is observed that five rate switch oscillations occured. These oscillations increased the mean response time. The mean response time was 0.19 ms with the 90th percentile at 0.73 ms and the 99th percentile at 1.88 ms. In Table 3, the number of rate switches, the mean response time, and the post burst lag for varying tUtil values are shown. The post burst lag time gives the time difference between the end of a burst and the final rate switch to 100 Mb/s. The results for the Bursty traffic experiment #1 are shown in Figures 10 and 11. As tUtil and link utilization increased, the mean response time and time in low rate decreased. From the previous experiment we know that the post burst lag increases with an increasing tUtil value. With greater lag time, the possibility that the next burst will begin before the link data rate switches to 100 Mb/s increases and therefore, time in low rate decreases. With increasing utilization, the inter-burst time decreases and therefore, the possibility that for a given tUtil value the next burst will start before the data rate changes to 100 Mb/s increases. Consequently, fewer packets are serviced at the lower data rate and mean delay is decreased. With the dual-threshold policy we see that rate switch oscillations caused the mean response time to increase as the utilization increased.
Dual-threshold
80 60
tUtil = 10ms
tUtil = 1ms
40 20 tUtil = 100 ms
0 0
5
10
15
20
25
Utilization (% of 1 Gb/s) Figure 11. Time in low rate from bursty traffic #1
For the Bursty traffic experiment #2 we found that for the utilization-threshold policy the data rate switched from 100 Mb/s to 1 Gb/s at the beginning of a burst and returned to 100 Mb/s data rate at the end of the burst for the tested tUtil values. There were no rate switches during the bursts. The post burst lag time was insignificant compared to the inter-burst times of 10 seconds to 100,000 seconds and thus virtually all nonburst time was spent in the low (and energy saving) 100 Mb/s data rate. With the dual-threshold policy, we found that the link data rate oscillated between 100 Mb/s and 1 Gb/s during the bursts leading to a mean response time of over 1 ms. The results for the Switch experiment are shown in Figure 12. The switch power consumption is given for tUtil = 10 ms and 100 ms (shown as bars) with the horizontal dashed line indicating switch power consumption without ALR. The solid lines and the adjacent dotted line show the mean response time for tUtil = 10 ms and 100 ms, and with ALR disabled (constant 1 Gb/s data rate), respectively. We see that with an average utilization of 5%, a power savings of about 15 W (20%) is possible for tUtil = 10 ms. The increase in mean response time when ALR is enabled for both values of tUtil was less than 0.5 ms, which can be considered negligible for most applications.
34
Power use without ALR tUtil = 100ms 70 tUtil = 10ms 1 60
50
0 1
3
5
7
9
11
13
Acknowledgment
Mean response time (ms)
Power consumption (W)
2
80
This material is based on work supported by the National Science Foundation under Grant No. 0520081.
References [1] K. Christensen, C. Gunaratne, B. Nordman, and A. George, “The Next Frontier for Communications Networks: Power Management,” Computer Communications, Vol. 27, No. 18, pp. 1758-1770, December 2004. [2] M. Crovella, M. Harchol-Balter, and C. Murta, “Task Assignment in a Distributed System: Improving Performance by Unbalancing Load,” ACM SIGMETRICS Performance Evaluation Review, Vol. 26, No. 1, pp. 268-269, June 1998. [3] A. Field, U. Harder, and P. Harrison, “Network Traffic Behaviour in Switched Ethernet Systems,” Performance Evaluation, Vol. 58, No. 2, pp. 243-260, 2004. [4] G. Ginis, “Low power modes for ADSL2 and ADSL2+,” Broadband Communications Group, Texas Instruments, SPAA021, January 2005. URL: http://focus.ti.com/lit/an/spaa021/spaa021.pdf. [5] C. Gunaratne, K. Christensen, and B. Nordman, “Managing Energy Consumption Costs in Desktop PCs and LAN Switches with Proxying, Split TCP Connections, and Scaling of Link Speed,” International Journal of Network Management, Vol. 15, No. 5, pp. 297-310, September/October 2005. [6] C. Gunaratne, K. Christensen, and S. Suen, “Ethernet Adaptive Link Rate (ALR): Analysis of a Buffer Threshold Policy,” accepted and to appear in IEEE GLOBECOM, November 2006. URL: http://www.csee.usf.edu/~christen/energy/globe06.pdf. [7] M. Gupta and S. Singh, “Greening of the Internet,” Proceedings of ACM SIGCOMM, pp. 19-26, August 2003. [8] M. Gupta, S. Grover, and S. Singh, “A Feasibility Study for Power Management in LAN Switches,” Proceedings of the 12th IEEE International Conference on Network Protocols, pp. 361-371, October 2004. [9] B. Nordman and K. Christensen, “Reducing the Energy Consumption of Network Devices,” tutorial presented at the July 2005 IEEE 802 LAN/MAN Standards Committee Plenary Session, July 2005. URL: http://www.csee.usf.edu/~christen/energy/ieee_tutorial.p df. [10] A. Odlyzko, “Data Networks are Lightly Utilized, and Will Stay That Way,” Review of Network Economics, Vol. 2, No. 3, pp. 210-237, September 2003. [11] K. Roth, F. Goldstein, and J. Kleinman, “Energy Consumption by Office and Telecommunications Equipment in Commercial Buildings, Volume I,” Arthur D. Little Reference No. 72895-00, January 2002. [12] K. Yoshigoe and K. Christensen, “A Parallel-Polled Virtual Output Queued Switch with a Buffered Crossbar,” Proceedings of the IEEE Workshop on High Performance Switching and Routing, pp. 271-275, May 2001.
15
Utilization (% of 1 Gb/s) Figure 12. Results from switch experiment
6. Related Work Methods to reduce the power consumption of computing devices have drawn significant research interest during the past few years. Within the context of mobile devices and wireless networks, significant research into reducing power consumption has been conducted in order to increase battery lifetime. Reducing the power consumption of wired network links and network devices was first considered in [1] and [7]. In [8] it was proposed to power down network interfaces during packet inter-arrival times. ADSL2+ supports several low power modes in order to reduce heat dissipation at switching stations [4].
7. Summary and Future Work This paper contributes an improved ALR policy for reducing link data rate oscillation and a method for generating self-similar synthetic traffic. The power savings from operating an Ethernet link at 100 Mb/s instead of 1 Gb/s is about 4 W [5]. With an average link utilization of 5% or less it is possible to operate at 100 Mb/s for 80% or more of the time at an added delay of less than 0.5 ms (see Figures 10 and 11 for tUtil = 10 ms). Assuming a reasonable 100 million ALR-capable 1 Gb/s Ethernet links operating for 8 hours per day, an energy savings of about 0.93 TWh/yr ($75 million per year at $0.08 kWh) is achievable. The energy savings described in this paper are from reductions in network interface power consumption. Switch and router internal components are designed to operate at the maximum possible data rate. An ALR capable LAN switch could possibly be designed to reduce the power consumption of internal components. Operating at a lower clock speed and powering down redundant components are techniques that could be employed. Exploring this remains as future work.
35
36