a student are 1) poor communication of expectations, 2) lack of consistent criteria for ...... 7 C's, 6 D's, and no F's. We can see that in several instances (marked in ...
Evaluating and Grading Students by Marilla D. Svinicki
The topic of this discussion is the design of an evaluation system for your course. Now you may be saying to yourself, “I haven’t even met the class yet. How can I and why should I be thinking about how to evaluate them already?” Well, there are at least two reasons for doing it now, one very weighty reason and one very practical reason. First, the weighty reason. As outlined by the experts, the first step in the design of instruction is the identification of goals and objectives, followed closely by the design of evaluation. These two elements, the objectives and the evaluation method, determine which learning activities are needed in a situation. For example, if my objective is that the students will be able to describe the steps in the qualitative analysis of an unknown, and the evaluation of that objective will be in the laboratory, the learning activities should include laboratory time. If the evaluation will be on a written exam, I may not need to include actual laboratory experience; computer simulation or demonstration tapes may be sufficient. Therefore, before you can choose the types of learning activities your students will receive, you need to know what the final evaluation criteria will be, and those are most clearly laid out in the combination of objectives and evaluation. On the more mundane level, you need to select an evaluation method before the beginning of the semester because, no matter how much we would like to think our students exist for the love of learning, we soon realize that one of their most frequent concerns is how they will be evaluated for a grade. This concern of the students has been codified in the University regulations which state that an instructor must notify the students of the basis for evaluation prior to the end of the add/drop period. Normally, this is done on the first day of class since it is usually a part of the syllabus. Given these two very good reasons for getting started on the evaluation design, let’s now consider what is involved in designing the evaluation system for your class. There are two parts of the evaluation system which will require your attention. One is the selection of the types of activities which will be evaluated; the second is the selection of the grade assignment method. In this short time we cannot consider all the facets of these two topics, but what I hope to do is highlight the major considerations of each. If you want to go more deeply into any of the topics, you should feel free to contact us at the Center for additional information.
Selecting Types of Activities Because so much depends upon the evaluation of a student’s learning and the assigned grade, it is in everyone’s interest to try to make the evaluation system as free from irrelevant errors as possible. Borrowing from the evaluation literature, I propose that you concern yourself with four R’s of evaluation in attempting to design a system which will be acceptable to all concerned. Such a system should be: Relevant Reliable Recognizable Realistic Let’s look at each of these in turn and what it means for your course. Relevant In the jargon this is known as the validity of an evaluation method, but since that doesn’t start with an R, I’ve changed it to relevance. This means that any activity used to evaluate a student’s learning must be an accurate reflection of the skill or concept which is being tested. For example, if I am trying to determine if my students have learned the social and economic causes of the Civil War, the test must have questions which address that issue. Questions which ask students to list the major battles of the Civil War are not relevant to the objective. You may be saying that no one would be as foolish as that, but let me assure you that there are many documented cases of instructors who make equally flagrant violations of the principle of relevance. One of my favorites was in a graduate course in which the students were required to read a long list of primary sources and the test question was to match the authors’ names with the article titles. The instructor claimed that if the students knew the pairings, they must have read the articles and, therefore, there was no need to actually test the contents. What are the characteristics of a relevant evaluation? Oddly enough, one characteristic which might seem very mundane is that the evaluation activity must appear to be related to the course content (known in the jargon as face validity). A common complaint of students is that tests are not related to the content of the course or what was presented in class. Although we recognize that the things we assign are
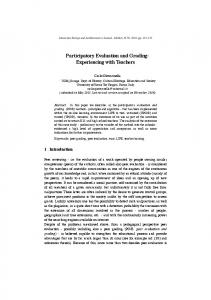
directly related to the course, the students often don’t get the connection. And, student impressions aside, the more obvious the connection, the higher the probability that we really have a relevant, valid evaluation activity. A second characteristic of relevant evaluations is that they are derived directly from the objectives (known in the jargon as content validity). The most obvious way to achieve this is to follow the objectives as closely as possible in selecting activities. If your course objective states that the students will be able to select the appropriate statistic for analyzing a given set of data, the evaluation should provide them with a set of data and have them select the analysis. The format for this evaluation could take many forms: an in-class exam where no actual calculations are done, an out-of-class homework assignment involving extensive calculations, a component of a large-scale semester-long project, an in-class exercise done in groups with class-generated data. All of these alternatives represent relevant tests of that objective. The difference among them would be in the sophistication possible under each condition. If I am working with undergraduates at the application level, and the skill I’m interested in is only selecting as recognizing, then in-class activities like multiple choice exams will meet my needs. If I am working with more sophisticated students, and expecting them to weigh the various alternatives before choosing, then the task requires additional time and resources and the out-of-class choices should be used. Thus, one of the first steps in selecting an evaluation type is to analyze the objectives and design activities aimed directly at the content and level of those objectives. Figure 1 is a chart which suggests alternative evaluation methods for various levels and types of instructional objectives. To use this chart, select an evaluation method and begin by analyzing your own objectives with a chart like that shown in Figure 2. This chart lists the objectives of the course down one side and the level and type of those objectives across the top, with checks indicating the desired levels for each objective. By comparing the two charts, an instructor can identify evaluation possibilities for each course objective. This is a chart for a course I have taught on instructional design for graduate students working in industry and adult education. I can use these two charts to come up with a list of possible methods for evaluating each of the objectives of my course. A comparison of these possibilities can help me combine various objectives in different formats and test a single objective in more than one format. For example, a cross-check indicating that I expect the objective on describing the characteristics of various teaching methods to be at a low level suggests the possibility of using an in-class exam, or a discussion, or any other method appropriate for that level. By tying the evaluation methods I choose to the objectives, I increase the relevance of those evaluations and the probability that the resulting grade accurately reflects the students’ skill and knowledge of the intended material.
Another characteristic of a relevant evaluation is how well performance on that evaluation predicts performance on other closely related skills, either at the same time (concurrent validity) or in the future (predictive validity). If the skill you are supposedly testing should be highly correlated with some other skill which you are also testing, chart the students’ performances on each and see if they follow the same pattern. To use a simplified example, we can say that the ability to add two single digit numbers is a precursor to, and therefore highly correlated with, the ability to add two two-digit numbers. Therefore, students who do poorly on the former should not be able to do well on the latter. If they do, then one of the two tests is not measuring what it is supposed to be measuring and is therefore not relevant to the addition skill we are trying to evaluate. So the first R in our set is relevance, and it means that the evaluation activities we choose are really measuring the skills and knowledge which we intend them to measure. Reliable The second aspect of an evaluation activity is how reliably or consistently it measures whatever it measures without being affected too much by the situation in which the evaluation takes place. A student’s grade should not hang on a single performance or on the mood of the person making the judgement. Of course, no system is perfectly reliable and will produce exactly the same evaluation of performance each time, but the goal here is to eliminate as many sources of error as possible and accept the fact that errors and discrepancies will occur anyway. The three biggest sources of error in reliably evaluating a student are 1) poor communication of expectations, 2) lack of consistent criteria for judgement, and 3) lack of sufficient information about performance. Poor communication of expectations means that poor student performance may be the result of the student’s failure to correctly interpret the task requirements. In written exams this usually is caused by ambiguous questions, unclear instructions, corrections given verbally during the test, and so on. In each case a bad grade is not a result of the student not knowing the material; it is a result of the student not understanding the question. In out-of-class assignments, this most often occurs when the instructor makes the assignment verbally without a written backup. The task, as originally designed, may be a very fine and relevant measure of the objective, but the way it is presented causes it to be misinterpreted and the student ends up answering a different question than the instructor intended. Lack of consistent criteria for judgement means that if the same performance were to be judged a second time by the
Level of Proficiency/Cognitive Complexity Types of Evaluations Facts
Oral or Written In-class Exams
Y
Y
Papers, Take Home Exams
Y
Y
Projects
Y
Commu- Other nication
Y
Y
?
Y
Y
?
Y
Y
Y
?
Y
Y
Y
Y
Homework
Y
Y
Y
In-class Participation Laboratory Work Y
Y
Y
Presentations in Class
Y
Applica- Analysis Synthesis Evalua- Attitudes Skills tion tion
?
Y
?
Y
Y
?
Y
? Describe Alternative Instructional Methods in-class exams
?
Figure 1: Types of Evaluations and Their Uses
or
Objective/ Level
in-class work Facts
Applica- Analysis Synthesis Evalua- Attitudes Skills tion tion
Commu- Other nication
presentations
Analyze an instructional situation and design the most appropriate system
X
X
X
Describe alternative instructional X methods Conduct instruction in several different modes Critique teaching episode, pointing out good and bad points and making suggestions
maybe
X
X
X
X
Figure 2: Analysis of Objectives of Specific Class
X
X
same grader, or if a second grader evaluated it, it might not receive the same grade because the basis for judging was unclear. The clearer the criterion for judging a student’s performance, the more reliable the evaluation becomes. For example, one real strength of multiple choice tests is that the grading is very reliable. Either the students marked the correct answer or they didn’t; very little is left to the judgement of the grader. On the other hand, essay tests are notoriously unreliable unless the instructor takes pains to make the criteria explicit and keeps checking to make sure he or she is not straying too far from the preset criteria. Therefore, to make your evaluation system reliable in this sense, choose types of evaluations which have clear standards you can specify for yourself, for others who may be grading in your course, and for your students. The lack of sufficient information is the third source of error in evaluating students, not just in terms of the amount of information, but also in terms of variety of information sources. Not everyone excels in every format. Using only one format may introduce a source of bias for or against some students and lower the reliability of an evaluation. Let’s look at an example in Figure 3. If we were to base our judgement of this student on the first exam score only, we might say that she was a B student. Then we add a second score and our estimate drops. A third score reinforces the first estimate.
Hour Exams (100 pts. each)
Final (100 pts.)
80 35 65 89 90 94
93
Lab Work (10 pts. each) 3
2
5
7
Papers (50 pts. each) 10
20
Figure 3: Example
Which is correct? We need more information. Looking at the total set of exam scores, we find that this really is a good student who perhaps takes a while to get started. Were her grade based on only the first few scores, it would be unreliable. Now, let’s look at a second aspect of more information as illustrated by the addition of her other grades, these on labs and reports. Obviously, this student excels at in-class exams, but does very poorly when longer analyses are required or when practical applications are tested. Any one set of activities alone does not give a reliable measure of this student’s performance. We need them all to assign a reliable grade.
Recognizable Our third R is the need for the evaluation system to be recognizable to the students. By this we mean that students should be aware of how they will be evaluated and their class activities should prepare them for those evaluations. Testing should not be a game of “guess what I’m going to ask you.” There is far too much for students to learn as it is for them to spend time trying to “psych out” the instructor. One of the biggest complaints students have is that the basis for evaluation was unclear to them. An instructor should choose evaluation types which are clearly related to the content and daily activities of the course. He or she should plan learning activities which are similar in scope and complexity to the ones to be used for evaluation. The instructor should explain the activities and their relevance to the students. It should never be the case that the students come into a test not knowing what to expect. Students don’t mind “hard” tests as long as there are no surprises, and they can recognize the relationship of the test to the course. Some instructors may criticize this as “teaching the test,” but in reality the test should be the best statement of the course expectations and, therefore, should mirror the teaching. Furthermore, few courses are taught at such a low level that tests are verbatim transcripts of the class or text; rather, they are interpretations or new examples of the class or text material. Realistic All of the above activities require work, either on the part of the students or the teacher. So to avoid burning out either, the final R is that the evaluation system should be realistic; the amount of information obtained is balanced by the amount of work required. Too often we forget that our students are taking three to four other courses along with ours. We’re less likely to forget that we are teaching two to three other courses as well. So, as much as we would like to have a large amount of data on each student to increase the reliability of our grades, or we would like to validate each of our evaluation activities each semester, or have crystal clear directions for all tests and assignments, we must also face the fact that unless the system we design is realistic, it will collapse under its own weight. What is a realistic system? Unfortunately, no one can give a blanket answer to that question. I can say that several smaller assignments tend to be more valuable than one large assignment. Alternatively, if a large assignment is called for, spreading it out across the semester and requiring components to be handed in periodically is a good technique, both from a learning and an administrative standpoint. In Conclusion When you are planning the overall system for evaluating your students, keep in mind these four R’s:
Relevant Reliable Recognizable Realistic If you can build these ideas into your system from the beginning, you have a good chance of getting an accurate estimate of each student’s achievement upon which to base your grades.
Selecting A System for Assigning Grades Now we come to the second part of designing the evaluation system, selecting the system for assigning grades. We can’t go deeply into the mechanics of actually computing grades, but we can look at some of the bigger issues in grading which determine how you choose a grade computation system. Later on in the semester, as you face the actual task of assigning grades, please feel free to contact us for assistance in getting started. First, a warning. Because the grading policy you adopt is so closely tied to your personal philosophy of teaching and your view of your own role as a teacher, be sure you give these two areas significant thought before settling on a system. You will be the one who will have to defend grading decisions against both students and administrators. It is very difficult to defend a system in which you do not believe or which you have not carefully worked out. It is unlikely that anyone will seriously challenge the grades you give, but you have an ethical responsibility as a teacher to be sure that the grades you assign are your best estimate of your students’ abilities, whether anyone else is looking over your shoulder or not. Grading Systems and Philosophies There are two basic grading philosophies currently in use. These are commonly called norm-referenced systems and criterion-referenced systems. Each system uses different methods for determining cutoff points for letter grades. Each can be applied to a single test or to the determination of final letter grades. Let’s examine the procedures associated with each. Norm-referenced systems: The assumption underlying norm-referenced systems is that whatever is being measured is distributed throughout the population according to a normal distribution, commonly known as the bell curve (Figure 4). In the normal distribution, a very few people will do either very well or very poorly while the great mass of the unwashed show up clustered around the middle. Indeed, when we take a random sample of the general population and measure just about anything, this is what we get. The assumption is that when we evaluate our students’ achievement, it will follow this same distribution. Thus, the grades will reflect the curve. There will be a few students way out on one end of the curve
who should get As; a few down on the other end who should get Fs; and the great mass in the middle who get Bs, Cs and Ds. The assignment of grades under these systems identifies those students who do significantly better or worse than their peers. Some examples of norm-referenced systems are: the simple curve: In this system the instructor determines beforehand that a certain percentage of students will receive A’s and a similar percentage will receive F’s. The same holds for B’s and D’s. The remainder receive C’s. Cutoffs are based on the number of students in the class and are figured by counting down the distribution of grades until that number is reached. Of course, it never works out to be exactly equal, but the numbers in corresponding categories are close. Since this system involves nothing more sophisticated than counting, it is easy to use. A grade distribution figured by this method is shown in Figure 5a. the normalized curve: This is a more sophisticated system in which the actual score a student earns is converted into what is called a standard score based on the class average and the distribution of the scores. Then, using standard tables, the instructor converts these standard scores into percentiles based on a normal curve. The student’s score is reported as being in the 90th percentile or the 50th, with some predetermined percentiles representing each of the letter grades. The second set of grades in Figure 5a show a normalized grade distribution. Percentile scores have some real advantages when it comes to comparing grades from a wide range of activities, but their computation and interpretation can be confusing. They are probably not practical for the classroom instructor unless he or she is familiar with statistics.
No. of Students
S.D. -1.5 -1.0 Scores Low
-.5 Mean
+.5
+1.0 +1.5 High
Figure 4: A Bell Curve
In both of the above cases, you can see that the student’s grade depends on where he or she falls in relation to the rest of the class rather than on the absolute score he or she obtained. Thus, the student is in competition with the others being evaluated at the same time. A grade of A in one class may mean a test score of 99, while in another class it could be a test score of 79, depending on how well the class as a whole performed. Criterion-referenced systems: Opposed to normreferenced systems are the criterion-referenced systems. The assumption underlying these systems is that there is an absolute quantity of whatever is being measured and the grade reflects how much of that quantity each student has. This is more like a strength test. We have a set criterion, the bell at the top, and each student takes a swing and achieves a given level which determines the grade he or she gets, regardless of how anyone else does. The most common forms of criterion-referenced systems are: percent of total points possible: In this system, there is a fixed number of points available to be earned. Earning 90% (or some other arbitrary percent) of those points will result in an A, while 80% will result in a B, and so on. The student is being evaluated against a pre-set criterion, hence the name, and not against his or her peers. It does not matter how many students reach a given level. If everyone earns the maximum, everyone gets an A. The third set of grades in Figure 5a was figured using this system. mastery or pass/fail: In this case, there is only one pre-set level of achievement, usually based on a set of specific objectives which must be passed. If these are passed, the student moves on; if not, the student must repeat the evaluation or, alternatively, fails the course. Sometimes the specifics refer to a given percent of the total possible rather than to given skills. This is the case with the fourth set of grades in Figure 5a. In both of the above cases, you can see that the student’s grade depends on the absolute score he or she obtains rather than on the relative position of that score in the class. Thus, the student is in competition with an outside standard rather than his or her peers. A grade of A in this system would indicate a given level of achievement regardless of the performance of the class as a whole, but would tell us nothing about how the student compared with his or her peers. Hybrid systems: Now let’s look at some systems which have no clear-cut allegiance to either philosophy, but are very commonly used. percent of maximum obtained: This system uses a predetermined set of cutoff percentages for each grade as in a criterion-referenced system, but bases the actual grades on the
highest score earned in that class, rather than the highest possible score. This latter characteristic makes the grades somewhat comparative as in a norm-referenced system. The class performance plays a role in determining what is needed for each grade, but the number of students who can earn each grade is not restricted as in the norm-referenced systems. Except on the grossest level, the students are not in competition with one another. This system gives us neither absolute nor relative performance information, but it is easy to compute and easy for students to understand. The fifth set of scores in Figure 5a use this system. gap system: This could be labeled the interoccular system since it involves laying out the score distribution and looking for gaps in the distribution. These breaks then determine the cut-off scores for the various grades. One advantage of this system is that the instructor has a practical reason for setting the grade cutoffs where they are. The idea is to identify real differences in performance which will then be reflected in the grades. Under this system, A performance really appears to be different from B performance because the two groups of students have a gap separating them. All the other systems are based on more or less arbitrary cutoffs, even though they may have a sound statistical basis. Like normreferenced systems, the gap system gives us relative but not absolute performance information. It is also easy to compute and explain. The sixth set of grades in Figure 5a are based on a gap system. What’s the Difference in Terms of Grades? The distribution of grades under these various systems does not differ remarkably in the set of scores shown in Figure 5a. In this class it might not matter which system the instructor chose since they would all come out about the same. This is because the underlying distribution of scores in this class is distributed fairly normally across the range of possible points. However, if you inspect the grade distributions for Figure 5b, a class in which the highest score is an 80 out of 100, you can see that now it makes a big difference which system is chosen. If we stick to criterion-referenced systems such as percentage total or pass/fail, many students will fail. Under these circumstances, the students will usually cry out for a “curve.” To be honest, this might not be a bad move, since poor performance by an entire class might be an indication of a poorly constructed exam, or inadequate instruction, or some other variable over which students have little control. On the other hand, if the material being tested is something critical like the construction of a nuclear plant or the insertion of a needle for drug injection, I personally don’t want anyone to curve the grades; I want a criterion-referenced system in place. While there are many valid arguments which can be made for norm-referenced systems, they are usually made in the situation illustrated in Figure 5b where overall class performance is poor. They are seldom applied to a situation
like that in Figure 5c where overall class performance is very high. In this case, most students prefer a criterion-referenced system which will allow everyone to receive the top grade. It is hard to imagine curving the grades in a graduate course, where the assumption of a normal distribution is not valid. On the other hand, suppose the purpose of this course were to determine which two students should be selected to receive fellowships or which two should be allowed into a special program for promising researchers? Under those conditions, a criterion-referenced system would not provide the comparative information needed to make those decisions.
Students have very definite ideas about how final course grades are computed. They feel very insecure when they cannot predict how their final grade will turn out because it is going to be based on the final class distribution. In order to deal with this, many instructors use norm-referenced systems to assign periodic grades, such as those on hour tests, and then combine these into one course grade which is evaluated on a criterion-referenced basis. In fact, this may be the fairest system of all. Procedures for making such final grade determinations are described in the sections labeled “A criterion-referenced system” and “A norm-referenced system.”
As can be deduced from the above examples, no one grading system is the “right” system. The choice will depend on the purpose of the grade (to provide absolute or comparative evaluation), the type of content being evaluated (critical or non-critical), the type of students (how select the sample is), and the philosophy of the instructor. There are some other practical considerations, such as ease of computation, size of class, clarity to students, whether it is necessary for students to be able to track their progress toward a final grade, and so on. These last few practical considerations dealing with whether the students can monitor their progress may not be important to the instructor, but they are very important to the students.
The real question to ask yourself is whether you wish your students’ grades to provide information about their absolute performance level or about their relative performance level. That is the first and most important distinction you must make. From it will flow the other choices. No one can answer the question for you, although there may be a departmental or college recommendation or leaning toward one or the other. Neither system represents truth; each has its pros and cons. The best system for you is the one which reflects your own teaching philosophy.
Raw Score
#
100 99 98 97 96 95 94 93 92 91 90 89 88 87 86 85 84 83 82 81 80 79 78 77 76 75 74 73 72 71 70 69 68 67 66 65 64 63 62 61 60 59 58 57 56 55 54 53 52 51 50
1 1
curve
norm
%tot
pass
%max
gap
Grades Under Varying Systems
2 1 1 1 2 1
This figure indicates the score cut-offs for each of the grades A - F under various grading systems. The left column lists the raw scores earned on a single test of 100 points. The second column shows how many students received each score. The remaining columns show where the grade cut-offs fall for each system. 90
90
90
80
80
90
A
79
B
72
C/Pass
62
D F
89 2 3 5 3 2 3 2 3 4 1 2 3 8 4
81 80
10 5
70 68
70
70
68
3 7 1 6 3
60
60
60
59
➷
3 2
2 1 Grade curve A 10 B 20 C 41 D 20 F 9
norm 10 23 38 20 9
%tot 10 23 32 26 9
pass 63
35
%max 10 23 32 26 9
gap 10 27 Average 73.83 18 27 St. Dev. 11.58 18
Figure 5a: Normal Class
Curve: A system in which it was decided beforehand that 10% of the students would receive As, 20% Bs, 40% Cs, and so on. Norm: A normalized distribution using the average and standard deviation to set the cutoff at A = 1.29 standard deviations (sds) above the mean, B = .53 sds above the mean, C = .53 sds below the mean, and D = 1.29 sds below the mean. These numbers are derived from a normal distribution table and represent 10%, 20%, 40%, 20%, and 10% of the class in each respective category. % Total: Cutoffs are set at 90%, 80%, 70% and 60% of the total points possible without regard to the distribution of scores. Pass/Fail: Only one cutoff, 70%, indicating the acceptable passing score. This percent is an arbitrary choice. % Maximum: Uses the same percentages as the % total, but bases the actual cutoff scores on the highest score actually achieved in the class, in this case 100. Gap: Scores are selected by looking for gaps or low points in the distribution. Note that the B cutoff is not an actual break but is set just above the point at which only one student scores. As you can see from the table at the bottom of the graph, the various grading systems result in similar distributions when the raw scores are spread normally across the range. Only the gap system produces a non-normal distribution, an effect which could easily be changed by shifting all the cutoffs up and expanding the C area. On the whole, however, a normal class with a range of scores can be graded by any convenient method and will usually produce a fairly normal distribution of grades.
Raw Score
100 91 90 81 80 79 78 77 76 75 74 73 72 71 70 69 68 67 66 65 64 63 62 61 60 59 58 57 56 55 54 53 52 51 50 49 48 47 46 45 44 43 42 41 40 39 38 37 36 35 34 33
#
curve
norm
1 1
%tot
pass
%max
gap
90
Low Scoring Class
80
The class in the previous figure scored across the range of possible scores, which made the various grade distributions turn out similarly. The class in this figure, however, has scored at a much lower level overall (note the lower average score), and has a slightly skewed distribution with a few more students clustered near the upper end of their range, while six stragglers score much lower than everyone else. Whatever the reason for the difference between the two classes, you can see that the grade cut-offs under the same systems used with the previous class have shifted downward with the exception of the % total and pass systems. From the table at the bottom, you can see the effects these various systems have on the distribution of grades. Under all but the % total and pass systems, the distribution of grades has remained fairly stable from one system to the next and retains the “curved” shape (see in the previous class), with a slight favoring of the B’s. Under both % total and pass, the number of students passing has been substantially reduced.
2 3 74
74
A
63
B
53
C/Pass
45
D F
73 5 4 5 2 1 1 5 7 7 6 9 8
72 70
66
70
66 64
60
60 59
4 4 5
56
2 3 4
50 48
48
5
➷ 2
2 1
Grade curve A 7 B 23 C 37 D 14 F 11
norm 7 23 45 14 11
%tot 0 1 20 46 33
pass 21
79
1 Figure 5b: Low Scoring Class
%max 12 38 27 14 11
gap 7 43 32 12 6
Average 60.76 St. Dev. 9.85
10 Raw Score
#
100 99 98 97 96 95 94 93 92 91 90
1 1
curve
norm
%tot
pass
%max
gap
High Scoring Class
2 2 3 4 3 1
5 4 4 8 9 6 8 7 5 1 1 2 5 4
89
B
91 90
90
86
This figure presents an altogether different situation. This class has done well in comparison to the previous two classes (note the higher average score). Whereas in the last class the cut-offs were much lower than a normal class, in this class they are higher in the three systems which use a comparative rather than an absolute base. We have produced a bell-shaped curve of grades, but once again note how different an A in this class is in comparison to the previous class if we use comparative systems. Only under the criterion-referenced system would an A be identical in all three classes.
85 In Summary
80 79
These three class distributions illustrate some of the problems an instructor faces in the selection of a grading philosophy. The selection of norm- versus criterion-referenced grading should depend on:
80
79
73 5 3 2 1 1
A
93
89 88 87 86 85 84 83 82 81 80 79 78 77 76 75 74 73 72 71 70 69 68 67 66 65 64 63 62 61 60 59 4
98
73
a.
the objective of the grades (to identify absolute skill levels or relative performance);
b.
the type of content (general information which is noncritical or content which fits into a sequence or is critical);
c.
the type of students (large normally distributed population or select sample);
d.
the philosophical bias of the instructor.
C/Pass
71 70
70
70 68
D F
➷
60
Grade curve A 11 B 21 C 43 D 21 F 4
norm 18 10 47 13 12
%tot 19 44 28 2 0
60
pass 98
2
%max 19 44 28 2 0
gap 2 17 69 12 0
Average 82.34 St. Dev. 7.08
Figure 5c: High Scoring Class
student 1 1 2 3 4 5 6 7 8 9 10 11 12 13 14 15 16 17 18 19 20 21 22 23 24 25 A # B # C # D # F #
hour tests 2
final 3
1
lab tests 2
final
Grade for course
3
32.D 44.B 31.D 38.C 27.F 30.D 46.A 43.B 38.C 27.F 29.D 30.D 32.D 35.C 39.C 48.A 42.B 40.C 41.B 40.C 42.B 39.C 35.C 36.C 37.C
29.C 38.A 25.C 32.B 24.D 26.C 30.B 28.C 29.C 20.D 25.C 28.C 21.D 25.C 27.C 31.B 29.C 28.C 24.D 25.C 22.D 19.F 20.D 21.D 22.D
37.C 39.B 33.C 31.C 25.F 27.D 48.A 42.B 29.D 21.F 31.C 33.C 29.D 30.C 37.C 49.A 40.B 39.B 43.B 43.B 41.B 35.C 25.F 29.D 28.D
88.C 92.B 87.C 84.C 73.D 78.D 95.B 94.B 87.C 80.D 85.C 82.C 78.D 79.D 88.C 96.A 91.B 93.B 96.A 97.A 91.B 84.C 80.D 82.C 77.D
25.A 24.B 20.C 20.C 11.F 15.D 24.B 23.B 19.C 13.D 14.D 15.D 17.D 21.C 23.B 25.A 23.B 20.C 21.C 24.B 23.B 20.C 17.D 21.C 22.C
23.B 25.A 19.C 20.C 13.D 12.F 23.B 15.D 20.C 10.F 11.F 20.C 14.D 20.C 11.F 24.B 25.A 19.C 15.D 17.C 19.C 12.F 12.F 10.F 11.F
24.A 25.A 15.C 22.B 18.C 17.C 25.A 24.A 20.B 14.D 12.D 21.B 16.C 21.B 22.B 25.A 25.A 15.C 23.B 25.A 24.A 20.B 13.D 10.F 15.C
48.A 47.A 30.D 37.C 38.C 29.D 49.A 45.B 40.C 25.F 33.D 37.C 30.D 43.B 39.C 49.A 48.A 30.D 45.B 43.B 45.B 40.C 37.C 35.D 30.D
37 51 26 33 13 17 52 42 29 8 22 28 16 29 30 57 47 34 42 45 41 25 16 20 18
46+ 2 41-45 5 35-40 10 29-34 6 282
38+ 1 30-37 3 25-29 12 20-24 8 191
48+ 2 39-47 7 30-38 8 27-29 5 263
96+ 3 91-95 6 82-90 10 73-80 6 721
25 2 23-24 7 19-22 9 13-17 6 121
25 2 23-24 3 17-22 8 13-16 4 128
24+ 8 20-23 7 15-19 6 12-14 3 111
47+ 5 43-46 5 37-42 7 29-36 7 281
53+ 3 38+ 7 23+ 7 8+ 8 80
C B C C D D B B C D D C D C C A B C B B B C D D D
Figure 6a: Sample Class Data for Combining Scores into a Final Grade using GAPS
A Norm-Referenced System for Final Grades In order for norm-referenced systems to work correctly, student scores have to be distributed according to the normal curve or at least the same on all measures which are to be combined. This is usually the case, especially in large or beginning level classes. If you are fortunate enough to have all the distributions on all your measures normally distributed or at least similarly distributed, you can follow the procedures outlined below. If any of the measures is badly out of line with the others in terms of the shape of its distribution, you
would be well-advised to convert all the scores to T-scores before any combining of scores for a final grade. This procedure is described in a separate section. For now, let's look at combining scores for a fairly standard class. Refer to the student records shown on the left in Figure 6a as we step through the process of figuring final grades. a. Create a frequency distribution of the raw scores on each measure. That entails listing all the scores possible between the highest score obtained and the lowest score obtained. Then tally how many students obtained each score. The frequency distributions for these measures are found in Figure 6b. b. Decide beforehand what percentage of students should receive each letter grade. For example, in a class of one hundred students, you may decide that the top ten percent should receive A's (10 students), the next twenty percent B's (20 students), the middle forty percent C's (40 students), the next twenty percent D's (20 students) and the remaining ten percent F's (10 students). In this case shown at the right ten percent equals 2.5 students. c. Count down from the top score obtained two or three people and look for a natural break in the distribution somewhere nearby. In this case a break occurs between 44 and 46 on the first hour test. That can be set as the cut-off for A. Then we proceed with the next five (20 percent), looking for a natural gap again. This time we have to settle for a low point in the spread at 41 since the next three scores each have 2
Hour Test 1
Hour Test 2
Hour Test 3
Final Exam
48
1
38
1
49
1
97
1
46 44 43 42 41 40 39 38 37 36 35 32 31 30 29 27
1 1 1 2 1 2 2 2 1 1 2 2 1 2 1 2
32 31 30 29 28 27 26 25 24 22 21 20 19
1 1 1 3 3 1 1 4 2 2 2 2 1
48 43 42 41 40 39 37 35 33 31 30 29 28 27 25 21
1 2 1 1 1 2 2 1 2 2 1 3 1 1 2 1
96 95 94 93 92 91 88 87 85 84 82 80 79 78 77 73
2 1 1 1 1 2 2 2 1 2 2 2 1 2 1 1
their value and the final as four times its value. We see this with student #1 who has: a.
Lab Test 1 25 24 23 22 21 20 19 17 15 14 13 11
2 3 4 1 3 4 1 2 2 1 1 1
Lab Test 2
Lab Test 3
Lab Final
25 24 23 20 19 17 15 14 13 12 11 10
25 24 23 22 21 20 18 17 16 15 14 13 1 1
49 48 47 45 43 40 39 38 37 35 33 30 1 1
2 1 2 4 3 1 2 1 1 3 3 2 12 10
5 3 1 2 2 2 1 1 1 3 1 1 29 25
Figure 6b: Frequency Distribution for Various Tests
students. Continue this process through the entire class for each test. d. Once the grade cut-offs have been determined, assign each student the appropriate letter grade based on his/her raw score. e. Convert the letter grades into points on the basis of A=4, B=3, etc., or some similar scale. This step is not shown. f. Multiply the points earned for each measure by the weighting desired. For example, if the final is intended to count twice the weight of an hour test and the lab tests are intended to be half as much as an hour test, the letter grades earned on the lab tests could be designated as weighing one times their value, the hour tests as twice
2 2 1 3 2 2 1 1 3 1 1 4
hour tests of D (1 point x 2 weight = 2) C (2 points x 2 weight = 4) and C (2 points x 2 weight = 4), b. a final of C (4 points x 4 weight = 16), c. 2 lab tests of A (4 points each x 1 weight = 4 each or 8 total) and 1 lab test of B (3 points x 1 weight = 3), d. a lab final of A (4 points x 2 weight = 8) for a total of 37 points.
g. Sum the points earned (after weighting) for all measures. h. Determine the number of points needed to earn each final letter grade. One way to do this is to decide that if a student earned straight C's on all measures, a solid C would add up to 30 points: a.
3 hour exams x 2 points per C x 2 weight = 12 b. 1 final x 2 points for the C x 4 weight = 8 c. 3 lab exams x 2 points x 1 weight = 6 d. 1 lab final x 2 points x 2 weight = 4 for a total of 30.
A straight B would be 45 points: a. 3 exams x 3 points per B x 2 weight = 18 b. 1 final x 3 points x 4 weight = 12 c. 3 lab exams x 3 points = 9 d. 1 lab final x 3 points x 2 weight = 6 for a total of 45
Half way between these two would be the cut-off between B and C. The same figuring would go into determining all the cut-off points. i.
Assign letter grades to the final totals.
This system results in a final grade distribution shown in the last column at the bottom right of the table. There are 3 A's, 7 B's, 7 C's, 8 D's, and no F's. Now compare the results of this procedure to the same class done under a criterion-referenced system, shown in the next figure (Figure 6c).
student 1 1 2 3 4 5 6 7 8 9 10 11 12 13 14 15 16 17 18 19 20 21 22 23 24 25 A # B # C # D # F #
32.D 44.A> 31.D 38.B 27.F 30.D 46.A 43.A> 38.B> 27.F 29.D 30.D 32.D 35.C 39.B> 48.A 42.B 40.B> 41.B 40.B> 42.B 39.B> 35.C 36.C 37.C 43+ 4 38-42 9 33-37 4 28-32 6 272
hour tests 2 3
final
29.C 38.A 25.D 32.B 24.D 26.C 30.B 28.C 29.C 20.F< 25.D< 28.C 21.F< 25.D< 27.C 31.B 29.C 28.C 24.D 25.D< 22.D 19.F 20.F< 21.F< 22.D
88.B> 92.A> 87.B 84.B 73.C 78.C> 95.A> 94.A> 87.B> 80.B> 85.B> 82.B> 78.C> 79.C> 88.B> 96.A 91.A> 93.A> 96.A 97.A 91.A> 84.B> 80.B> 82.B> 77.C>
34+ 1 30-33 3 26-29 8 22-25 8 215
37.C 39.C< 33.D 31.D 25.F 27.F< 48.A 42.B 29.F< 21.F 31.D< 33.D< 29.F< 30.D< 37.C 49.A 40.B 39.C< 43.B 43.B 41.B 35.C 25.F 29.F< 28.F< 45+ 2 40-44 5 35-39 5 30-34 5 298
1
90+ 9 80-89 6 70-79 10 60-69 0 590
25.A 24.A> 20.B 20.B 11.F 15.D 24.A> 23.A> 19.B> 13.D 14.D 15.D 17.C> 21.B> 23.A> 25.A 23.A> 20.B> 21.B> 24.A> 23.A> 20.B> 17.C> 21.B> 22.A> 22+ 10 19-21 8 16-18 2 13-15 6 121
lab tests 2 23.A> 25.A 19.B 20.B 13.D 12.F 23.A> 15.D 20.B> 10.F 11.F 20.B> 14.D 20.B> 11.F 24.A> 25.A 19.B> 15.D 17.C 19.B> 12.F 12.F 10.F 11.F 22+ 5 19-21 7 16-18 1 13-15 4 128
final
Grade for course
48.A 47.A 30.D 37.C 38.C 29.F< 49.A 45.A> 40.B> 25.F 33.D 37.C 30.D 43.B 39.C 49.A 48.A 30.D 45.A> 43.B 45.A> 40.B> 37.C 35.C> 30.D
42 56 27 40 17 17 58 51 37 14 21 31 17 31 38 58 52 39 46 46 49 34 23 23 21
3 24.A 25.A 15.D 22.A 18.C 17.C 25.A 24.A 20.B 14.D 12.F< 21.B 16.C 21.B 22.A> 25.A 25.A 15.D< 23.A> 25.A 24.A 20.B 13.D 10.F 15.D