Evaluating Capture and Replay and Model-based Performance Testing Tools: An Empirical Comparison Elder M. Rodrigues
PUCRS Porto Alegre, RS, Brasil
Flavio M. Oliveira
PUCRS Porto Alegre, RS, Brasil
Maicon Bernardino
PUCRS Porto Alegre, RS, Brasil
[email protected] Rodrigo S. Saad
[email protected] Leandro T. Costa
[email protected] Avelino F. Zorzo
[email protected]
[email protected]
[email protected]
Dell Computer of Brazil Ltd Porto Alegre, RS, Brasil
PUCRS Porto Alegre, RS, Brasil
PUCRS Porto Alegre, RS, Brasil
ABSTRACT
1.
[Context] A variety of testing tools have been developed to support and automate software performance testing activities. These tools may use di↵erent techniques, such as Model-Based Testing (MBT) or Capture and Replay (CR). [Goal] For software companies, it is important to evaluate such tools w.r.t. the e↵ort required for creating test artifacts using them; despite its importance, there are few empirical studies comparing performance testing tools, specially tools developed with di↵erent approaches. [Method] We are conducting experimental studies to provide evidence about the required e↵ort to use CR-based tools and MBT tools. In this paper, we present our first results, evaluating the e↵ort (time spent) when using LoadRunner and Visual Studio CRbased tools, and the PLeTsPerf MBT tool to create performance test scripts and scenarios to test Web applications, in the context of a collaboration project between Software Engineering Research Center at PUCRS and a technological laboratory of a global IT company. [Results] Our results indicate that, for simple testing tasks, the e↵ort of using a CR-based tool was lower than using an MBT tool, but as the testing complexity increases tasks, the advantage of using MBT grows significantly. [Conclusions] To conclude, we discuss the lessons we learned from the design, operation, and analysis of our empirical experiment.
Software testing is a costly and time-consuming activity when compared to other phases of the software development life-cycle, since it can represent up to 60% of the overall software development e↵ort [15]. To mitigate the e↵ort and the financial resources spent in this phase, testing teams have been focusing their e↵orts on automation testing tasks. Performance testing, due to its own nature, involves a high degree of automation. Thus, there are a range of tools (also called load generator) to support performance testing, such as Apache JMeter [11], HP LoadRunner [10], IBM Rational Performance Tester [4], Borland SilkPerformer [21], and Microsoft Visual Studio [3].
Categories and Subject Descriptors D.2.5 [Testing and Debugging]: Testing tools
General Terms Experimentation, Measurement, Performance
Keywords Performance Testing, Testing Tools, Experiment Permission to make digital or hard copies of all or part of this work for personal or classroom use is granted without fee provided that copies are not made or distributed for profit or commercial advantage and that copies bear this notice and the full citation on the first page. To copy otherwise, or republish, to post on servers or to redistribute to lists, requires prior specific permission and/or a fee. ESEM’14, September 18–19, 2014, Torino, Italy. Copyright 2014 ACM 978-1-4503-2774-9/14/09...$15.00
INTRODUCTION
Normally, these tools support manual script coding or - more frequently - a Capture and Replay (CR) [7] approach: a test engineer executes the tests manually once on the application to be tested, using the load generator in “record” mode, then defines scenario parameters (e.g., number of virtual users and test duration) and runs the generator. In recent years, some tools are applying a Model-Based Testing (MBT) approach to support performance testing, such as TestOptimal [22], MBPeT (Model-Based Performance Testing Tool) [1], WALTy (Web Application Load-based Testing) [19], and PLeTs (Product Line of Model-Based Testing Tools) [18]. Although there are many tools available, test engineers face some key issues when considering to move from manual coding scripts to a CR performance testing process or to replace a testing tool, e.g., motivated by business decisions. For instance, what is the learning curve when using the tool or what is the required e↵ort to generate performance scripts and scenarios when using a specific tool? Despite these doubts, to the best of our knowledge there is little work discussing the benefits and issues on the adoption of these tools; a case study by Grechanik et al. [9] is one of the few, concentrating on HP QTP. Furthermore, there are no discussions about the e↵ort required when using an MBT tool to generate performance test scripts and scenarios. Motivated by this lack of knowledge to support the decisions on the replacement of a CR-based tool or the adoption of an MBT tool to support the performance testing process,
we are conducting experimental studies to provide evidence about the required e↵ort to use CR-based and MBT tools. In this paper, we present our first results, evaluating the e↵ort (time spent) when using the LoadRunner [10] and Visual Studio [3] CR-based tools, and the PLeTsPerf MBT tool [18] to create performance test scripts and scenarios to test Web applications, in the context of a collaboration project between Software Engineering Research Center at PUCRS and a technological laboratory of a global IT company. This paper is organized as follows. Section 2 presents some context relative to the company in place, as well as details of the study motivations. Section 3 introduces the experiment instruments and the test documents. Section 4 presents the experiment design and introduces our research questions. Section 5 describes the execution of the experiment, while Section 6 presents our analysis and interpretation of results. Finally, we present the lessons learned on Section 7.
2.
EXPERIMENT CONTEXT
Our research group at CePES (Software Engineering Research Center) 1 works in cooperation with the Technology Development Lab (hereafter referred as TDL) of a global IT company. In the partner company, performance testing teams use a few frameworks together with commercial and open sources tools to support the automation of their testing activities. However, most of the performance testing teams rely on a single CR-based tool, namely LoadRunner [10], to support the automation of their tasks to test Web applications. The adoption of a single testing tool present some benefits, such as concentrating all the executable artifacts in a single technology or language and the easy exchange of testers. Although LoadRunner is comprehensive and is widely used by many companies, some strategic decisions led the team leaders to start investing in tools or new approaches to replace it. During an initial investigation performed by the company, several tools and their characteristics were analysed, such as license and training cost, usability, load generation, monitoring and reporting features, and automation approach. Based on the company’s preliminary analysis a set of tools were identified that meet, at di↵erent levels, their requirements, from which two tools were selected: Visual Studio [3] and PLeTsPerf [16]. Despite the suitability of these tools to the testing teams, there is an additional question that could not be addressed by the previous analysis: What is the required e↵ort to use these tools to support the automation of the testing process? Providing a properly answer to this question is fundamental to choosing the right tool, i.e, the chosen tool cannot require more e↵ort than the current tool to generate scenarios and scripts. Furthermore, this question become more relevant as one of the selected tools uses an approach to generate the test artifacts which is di↵erent from the one used by the current tool. Visual Studio, as is LoadRunner, 1
www.cepes.pucrs.br
is a CR-based tool, but PLeTsPerf is an MBT tool. Moreover, in the software industry, engineers are skeptical about the MBT benefits, mainly due to the learning and modeling time and e↵ort and the lack of work describing its usage on real projects. Actually, we initially addressed this issue in a previous experiment [17], where we compared the e↵ort to use a CR-based approach and an MBT approach. It is important to note that we reused some experiment’s artifacts, such as guidelines, test documents, and some tools in the current experiment. Moreover, the experiment subjects come from the same university, college and partner industry. To provide evidence about the e↵ort required by these tools on support Web domain applications testing process, we started to design and setup an empirical experiment in collaboration with the TDL of our partner company. Thus, we apply the PLeTsPerf MBT tool and the Visual Studio CR-based tool for the purpose of evaluation with respect to the e↵ort to generate scripts and scenarios from the perspective of the performance testers and the performance test engineers in the context of undergraduates, M.Sc. and Ph.D. students, performance testers and performance test engineers for the generation of performance test scripts and scenarios.
3.
EXPERIMENT INSTRUMENTS
In this section we briefly introduce the experiment instruments: System Under Test (SUT), LoadRunner, Visual Studio, and PLeTsPerf tools. • LoadRunner (LR) [10] is a performance testing tool based on the CR technique that supports scripts generation and execution to test Web-based applications. In LoadRunner, a tester manually interacts with the Web application under test performing predefined actions, in accordance with a test case, while LR is running in “record” mode. from the recorded result of the tester interactions with the SUT, LR produces performance test scripts. After that, the scenario configuration using the LR Scenario module must be defined. Thus, the tester must provide scenario parameters, such as the path to the recorded script, the probability of executing each script, the number of virtual users and the test duration. The test scenarios and scripts are then ready to be executed by LR. It is important to mention that LR is a tool with several others features and modules, such as test monitoring and results analysis, but they are out of the scope of this work. • Visual Studio (VS) [3] is an Integrated Development Environment (IDE) developed by Microsoft to support software design, development and test. This IDE provides a code editor to several .NET framework-based languages, such as C#, VB, and C++. Moreover, it also provides support for automated tests, such as performance testing. Visual Studio, as well as LoadRunner, is based on a CRbased approach to create performance test scenarios and scripts. • PLeTsPerf (PP) [16] is a model-based performance testing tool developed at our project, in the context of our collaboration with the TDL of the partner company. PP receives as input UML use cases and activity diagrams annotated with stereotypes and tagged values. In our automation strategy, stereotypes provide the base to annotate the
test scenario information into an use case diagram and the test case information into an activity diagram. Based on this information the tool generates performance test scenarios and scripts and automatically loads them into an external load generator tool [6] [20]. The main di↵erences between PP and VS or LR is the way that test analyst design test cases and generate performance test scenarios and scripts. Moreover, the tool can generate performance test scripts for di↵erent load generators, e.g., Apache JMeter [11]. • In this work we defined two Web applications as SUT: Workforce Planning - Skill Management Tool (SKILLS) [20] and Transaction Performance Council - Web (TPC-W) [13]. SKILLS is an in-house Web application that manages competences, certifications and experiences of employees at a given organization. Employees access SKILLS to insert their competences, certifications and professional experiences, while team managers use SKILLS to find and allocate employees with desirable competences to their teams or projects. TPC-W is a transactional Web service benchmark that provides an e-commerce application and a workload generator to measure the performance of the infra-structure in which the e-commerce application is running on. The ecommerce application is a complete implementation of a Web store, similar to Amazon [2].
4.
EXPERIMENT DESIGN
In this section we describe our experimental design, as well as introduce the research questions. Our Research Questions (RQ) are stated below: RQ1. What is the e↵ort to generate a single performance test script and scenario using PP, LR, and VS? Null hypothesis, H0 : e↵ort is the same when using PP, LR, and VS to generate a single performance test script and scenario. Alternative hypothesis, H1 : the e↵ort is less when using PP to generate single performance test script and scenario than when using LR or VS. Alternative hypothesis, H2 : the e↵ort is less when using LR to generate a single performance test script and scenario than when using VS or PP. Alternative hypothesis, H3 : the e↵ort is less when using VS to generate a single performance test script and scenario than when using LR or PP. RQ2. What is the e↵ort to re-generate performance test scripts and scenarios when using PP, LR, and VS? Null hypothesis, H0 : e↵ort is the same to re-generate performance test scripts and scenarios using PP, LR, and VS. Alternative hypothesis, H1 : the e↵ort is less to regenerate performance test scripts and scenarios when using PP than when using LR or VS. Alternative hypothesis, H2 : the e↵ort is less to re-generate performance test scripts and scenarios when using LR than when using VS or PP. Alternative hypothesis, H3 : the e↵ort is less to re-generate performance test scripts and scenarios when using VS than when using LR or PP. RQ3. What is the e↵ort to generate a set of performance test scripts and scenarios using PP, LR, and VS?
Null hypothesis, H0 : e↵ort is the same using PP, LR, and VS to generate a set of performance test scripts and scenarios. Alternative hypothesis, H1 : the e↵ort is less when using PP to generate a set of performance test scripts and scenarios than when using LR or VS. Alternative hypothesis, H2 : the e↵ort is less when using LR to generate a set of performance test scripts and scenarios than when using VS or PP. Alternative hypothesis, H3 : the e↵ort is less when using VS to generate a set of performance test scripts and scenarios than when using LR or PP.
4.1
Design
In our experiment we used an in-vitro approach, since it refers to the experiment in the laboratory under controlled conditions, addressing a real problem, i.e., the di↵erences in individual e↵ort to create performance test scripts and scenarios using LoadRunner, Visual Studio and PLeTsPerf. The subject selection was defined by the availability of academic and professional performance testers/engineers. We invited doctoral, master and undergraduate students to participate in our experiment as subjects. The undergraduate students were from Computer Science or Information Systems courses, ranging from second to fourth year. They come from one university (PUCRS2 ) and from one college (Senac3 ). Each subject had di↵erent experience knowledge, such as: experience in the industry as a software analyst or as a developer, or just experience developing software in an IT undergraduate course. The professional subjects were from only one IT company. The subjects were randomly allocated to each testing tool. Moreover, as all subjects would execute all treatments we always randomly defined their execution sequence, since the selected subjects for this experiment had di↵erent backgrounds in performance testing. Thus, to minimize the e↵ect of those di↵erences, the subjects were classified in two blocks according to their skills in software testing (beginner and advanced groups). To define if a subject is beginner or advanced, we applied a survey, prior to the experiment, to quantify the subject’s background. Furthermore, the subjects are randomly grouped into each group (randomized block design), so that each approach is performed by the same number of subjects (balancing).
4.2
Instrumentation
The main objects are the performance test scripts and scenarios generated for testing the TPC-W application. Other documents were provided for the execution of the experiment, such as: non-functional requirements, test specification and test plan. We have provided a supporting tool, called Argo UML [24], for modeling the use cases and activity diagrams. The tools were presented to the subjects through a printed manual, with an overview of the tools and detailed instructions on how to apply them to create performance test scripts and scenarios to test the SUT. Moreover, we performed a training phase in a laboratory room for all the experiment’s subjects. During the training, the subjects could ask open questions about the approaches and tools, the modeling process and the creation of scripts and scenarios described in the manual. It is important to mention that in the training phase, a di↵erent application is used to create performance test scripts and scenarios. Questions and 2 3
www.pucrs.br www.senacrs.com.br/faculdadesenacpoa
answers were shared among all the subjects in the training room. During the experiment execution, a printed guide is used by the subjects. It includes the test cases and scenarios and the related information about the process for generating performance test scripts and scenarios using both approaches, i.e., PLeTsPerf (a guideline to modeling performance using Argo UML tool was also included), Visual Studio, and LoadRunner. From the execution we collected e↵ort metrics for each subject. All subjects performed the tasks using the same computational resources.
4.3
Threats to Validity
An experimental process must clearly identify the concerns on the di↵erent types of threats to the experiment validity [23], defining an experimental process and describing each threat, and how we work to mitigate it. We adopted the threat classification scheme published by [5], which is divided in four types of threats: • Conclusion validity: This type of threat a↵ect the ability to draw conclusions about relations between the treatment and the outcome of an experiment. For instance, a relevant threat to the conclusion validity is the small number of subjects. We are aware that this can impact the “accuracy” of the experiment’s results, but the e↵ort in setting up the experiment and the achieved results showed an important feedback when introducing these tools in industry. The threats to the experiment conclusion validity are the following: Measures reliability: this perspective suggests that objective measures are more reliable than subjective measures, i.e., they do not depend on human judgement. In our study, the measurements of e↵ort and error rate do not involve human judgement; Treatment reliability implementation: even though we use the same SUT application to apply all treatments, there is a risk that the treatment implementation is not similar between di↵erent subjects. This risk cannot be completely avoided in our study since we cannot interfere with the subjects when they are generating performance test scripts and scenarios. To mitigate this threat, the starting point for all treatments are detailed test cases and scenarios documents instead of System Requirement Specification (SRS) documents. We are aware that a better experiment design should not restrict the subjects to perform a set of pre-defined scenarios and test cases. However, the target sample (students) from where we selected the experiment’s subjects did not have an adequate experience level or knowledge on performance testing or software requirements documentation. Therefore, they could face some difficulties to correctly identify the SUT performance requirements and also to correctly design the test cases and scenarios. Random irrelevancies in the experimental setting: the experiment was executed in an isolated laboratory, to avoid external interaction, such as the use of mobile phones, interruptions, etc.; Random heterogeneity of subjects: the variation due to the choice of heterogeneous participants with di↵erent know-how on software testing, modeling and also academic degrees may be a threat to the validation of the experiment results. To mitigate this threat we defined academic degree and background on performance testing (Beginner or Advanced) as blocking variables. We based our decision on assigning the subjects to each treatment on the following questions from
the applied survey: What is your knowledge on software testing? 31.4% had more than six months of professional experience, 17.6% had less than six months of experience, 29.4% took an university course or used the tool by themselves, and 21.6% had no knowledge on software testing. What is your knowledge about the LoadRunner tool? 29.4% had more than six months of professional experience, 11.8% had less than six months of experience, 11.8% took an university course or used the tool by themselves, and 47.1% did not know how to use the tool. What is your knowledge about the Visual Studio tool? 5.9% had more than six months of professional experience, 29.4% had less than six months of experience, 29.4% took an university course or used the tool by themselves, and 35.4% did not know how to use the tool. What is your knowledge on UML modeling? 9.8% had more than six months of professional experience, 19.6% had less than six months of experience, 52.9% took an university course or used the tool by themselves, and 17.6% had no knowledge on UML. • Internal validity: focus on the threats to the internal validity of the experiment: History: the date to start the experiment execution was defined to avoid periods in which subjects may be exposed to external influences, e.g., avoid running the experiment during the exam period (student subjects) and close to the start/end of an important project (industry subjects); Maturation: each experiment session was applied in the morning because the subjects are more motivated and less tired by the day’s workload; Selection: a survey was applied to assess the knowledge and the experience of subjects and then used to select and group (block) the subjects. • External validity: Subjects: a threat to the experiment’s external validity was to select a group of subjects that may not be representative to the performance testing community. Thus, to mitigate this threat, we selected students with some skills, basic programming and UML modeling knowledge, to work with performance testing and professionals with di↵erent levels of expertise in performance testing. To avoid the e↵ect of a learning curve influencing the results, the subjects of each block were random divided into three groups, where each group started with a di↵erent treatment; Tasks: another threat to the experiment validity is that the tasks defined to generate performance test scripts during the experiment execution may not reflect the activities performed by a performance tester when testing an application. To mitigate this threat we interviewed some senior performance testers and performance engineers, from di↵erent companies, to define how the scripts must be generated and what is a reasonable task size (defined by the number of test cases). The performance consultants did not participate and did not have any contact with the experiment subjects; • Construct validity: a possible threat, that may be present in every experiment, is the fact that some subjects can erroneously conclude that their personal performance is measured to, for instance, ranking the experiment subjects. To mitigate this threat, before each session we explained that we were evaluating the approaches/tools, not the subjects. Other possible threat is that the complexity and the size of the generated scripts during the experiment may not be representative to generalize the results. To minimize this
threat, we interviewed senior performance testers and performance engineers to define the complexity and the size of scripts.
5.
OPERATION OF THE EXPERIMENTAL STUDY
This section discusses the preparation and execution steps performed during the experiment operation.
5.1
Treatments PP - PLeTsPerf LR - LoadRunner VS - Visual Studio
Blocks Beginner Advanced Beginner Advanced Beginner Advanced
Number of Subjects 32 19 32 19 32 19
Preparation
In this section, we present how the experiment was conducted, how the documentation was prepared and how the experiment environment was configured. We also describe how the experiment subjects were involved and motivated. Our first personal contact with the experiment subjects was made through a presentation session, where the experiment was described. As mentioned previously, when defining the schedule of sessions, we took special care to avoid running the experiment during the exam period (an issue for student subjects) and close to the start/end of a project (an issue for industry subjects). The presentation session was divided into two parts: an initial explanation about the general idea of the experiment, and a space for the subjects to question or to suggest changes on the experiment. Other issues addressed during the presentation session were related to certify that all the subjects understood the research objective and how and which results would be published, making clear that any personal data would be kept confidential. At the end of the session a subject profile form was provided to all the subjects. The information extracted from the forms was used to classify and distribute the subjects through the blocks before running the experiment. Another issue we discussed during the experiment preparation was related to how the experiment data should be collected. To avoid human mistakes, we defined that the data collection related to e↵ort (time spent to perform an activity) should be automated. Thus, we used simple software that measures how much time each subject spent to generate each script using the tools.
5.2
Table 1: Assigning subjects to the treatments for a randomized design
Execution
The experiment execution took place from January to November of 2013 and was composed of two phases: training and experiment execution. The training phase was divided into three sessions: one was used to train subjects in modeling performance testing using UML and to use PLeTsPerf; other two session were used for training on the use of Visual Studio and LoadRunner to generate performance test scripts and scenarios to test a Web-based application. Furthermore, each session was divided in two parts: in the first part, we presented and demonstrated how to use the tool; in the second part, each subject used a tool to generate a performance test script in accordance with the training guidelines and the test case and scenarios documents. For the training phase, the SUT was the SKILLS application (see Section 3). Table 1 represents how the experiment subjects were distributed per blocks and treatments. It is important to highlight that the subjects were randomly selected to start using one of three treatments.
The experiment execution phase was split into three sessions, each composed of three tasks. These tasks were performed using the PP (PLeTsPerf), LR (LoadRunner), and VS (Visual Studio) approaches, one for each task, and all tasks should generate an equivalent performance test script as an output. For the experiment execution phase, the SUT was TPC-W. Each session of the execution phase is described next: • Session 1: to generate a single performance test script and scenario in accordance to the experiment guidelines (this session is related to RQ1): – Task 1 : this task consists of creating an UML model from scratch, based on a test case and scenario documents, and adding performance test information on the model. Initially, the experiment subjects had to model the test scenario using our modeling strategy. Therefore, they had to model a use case diagram composed by an actor, a related use case element and annotate these elements with performance stereotypes and tags. Secondly, the subjects had to model an activity diagram4 to represent a test case. Thus, this activity diagram had to be modeled to represent user interactions with the SUT. Once these two diagrams were modeled and annotated with performance information, they had to be exported as a XMI file and then the subjects had to use PLeTsPerf that loaded the XMI file in order to generate the performance test script5 . – Task 2 : in this task the subjects had to use the LoadRunner to generate a performance test script and scenario in accordance with test case and scenario documents. In order to generate these test artifacts the experiment subjects had to use the LoadRunner modules, i.e., capture and replay and test scenario. Using the CR module, the subject had to record a script corresponding to the user interactions with the SUT. In the LoadRunner test scenario module, the subject had to set the performance test scenario where the previous recorded script had to be included. Finally, the tester started the test execution6 ; – Task 3 : during the execution of this task the subjects had to use the Visual Studio to generate a performance test 4 A sample of the models and scripts designed when performing the experiment’s tasks can be found in: http://www.cepes.pucrs.br/experiment/esem 5 The activities described in the last phrase had to be performed by the experiment subjects when executing Task 1 in all sessions. 6 The activity described in the last phrase had to be performed by the experiment subjects when executing Task 2 in all sessions.
Table 2: Summarized data of the e↵ort in sessions
Treatments PP - PleTsPerf LR - LoadRunner VS - Visual Studio
Blocks Beginner Advanced Beginner Advanced Beginner Advanced
E↵ort (minutes) Block Average Time/Session Session 1 Session 2 Session 3 36.41 15.78 20.78 32.11 13.47 19.58 15.31 21.22 35.66 13.16 19.26 37.32 13.47 20.72 32.81 11.00 17.53 31.47
script and scenario in accordance with the same test case and scenario documents used in Tasks 1 and 2. The first step to create the performance test scenarios and scripts, the experiment subjects had to use the VS Web Test module, which is similar to the LR capture and replay. The subjects had to use the Web Test module to record a script corresponding to those interactions described in the test cases. After that, the subject must use the VS Load Test module to set the performance scenario information, and then start the test execution; • Session 2: to edit a script/model in accordance with the experiment guidelines (this session is related to RQ2): – Task 1 : this task consists of editing the UML model created in Task 1 of Session 1. Therefore, the use case and the activity diagram were modified by the subjects in order to meet some changes in the test specifications described in the test case and scenario documents. Thus, the subjects had to reflect these changes into the existing activity diagram, by adding actions and decision elements. These modifications were made to meet the changes into the test case and scenario documents, that describe four test cases. The use case diagram was also modified by the subject, in which the number of virtual users was changed; – Task 2 : when the subjects were performing this task, they had to create some new scripts and edit the existing LoadRunner scenario (created in Task 2 of Session 1) to meet the changes in the test system specification (the same changes described in Task 1 of Session 2). Based on these documents the subjects had to generate three new scripts from scratch using the capture and replay module. The scenario generated in Session 1 had to be changed to include the three generated scripts and also set another number of virtual users; – Task 3 : in this task, the subjects have used the Visual Studio to create new scripts and edit the existing scenario (created in Task 2 of Session 1) to meet the changes in the test system specification (the same changes described in Tasks 1 and 2 of Session 2). Based on these documents the subjects had to generate three new scripts from scratch using the VS Web Test module. Into the Load Test module, the number of virtual users was changed. • Session 3: to generate a set of performance test scripts and scenarios in accordance with the experiment guidelines (this session is related to RQ3): – Task 1 : the subjects had to edit the UML model created in the Task 1 of Session 2. Therefore, use case and activity
Avg. Blc. 24.32 21.72 24.06 23.25 22.33 20.00
Treatment Average Time/Session Session 1 Session 2 Session 3
Avg. Trt.
34.26
14.63
20.18
23.02
14.24
20.24
36.49
23.65
12.23
19.12
32.14
21.17
diagrams were modified in order to meet a change on the test system specification, properly described in the test cases and scenario documents. Based on these documents, the subjects had to modify the activity diagram by adding more action elements and more decision elements. These changes were made to represent all the fourteen test cases. The subjects had also to modify the use case diagram, changing the number of virtual users; – Task 2 : in this task the subjects had to create LoadRunner scripts and edit the LoadRunner scenario created in Session 2 to meet the same changes in the test specifications documents (the same changes described in the Task 1 of Session 3). Based on these documents, the subject had to generate ten more scripts from scratch. The scenario generated in Session 2 had to be changed as well, in which the virtual user’s field was changed; – Task 3 : here, the subjects had to create Visual Studio scripts and also edit the scenario created in Task 3 of Session 2 to meet the same changes in the test specifications documents (already described in the Task 1 and 2 of Session 3). Thus, the subject had to generate ten more scripts from scratch and edit scenario generated in Session 2.
6.
RESULTS
In this section, we present the e↵ort data collected from our experiment. It is important to note that we will present and discuss the results per session, which in turn address a research question. Table 2 shows the summarized e↵ort data (time spent) by subjects to perform each tasks of the Sessions 1, 2 and 3, which were presented in Section 5.2. In the table, columns Session 1, Session 2, and Session 3 present the average session time per block and per treatment. For instance, the Beginner block that applied the PP - PLeTsPerf treatment spent an average time of 36.41 min in Session 1, 15.78 min in Session 2 and 20.78 min in Session 3. The Avg. Blc. column presents the sessions average time per block and per treatment, i.e., the subjects blocked as beginner spent an average time of 24.32 min to perform a session ((Session 1 + Session 2 + Session 3)/3) applying the PP - PLeTsPerf treatment. To better summarize the results, we also present the average time spent per treatment to complete the sessions. Thus, the second group of columns Session 1, Session 2, and Session 3 show the average time spent by beginner and advanced subjects to apply each treatment (PP, LR, and VS) per session. For instance, the subjects who applied the VS treatment
80 30
40
60 min
min
min
60
20
20
20
10 0
PP
LR Treatments
VS
Figure 1: Boxplot Session 1
40
PP
LR Treatments
VS
Figure 2: Boxplot Session 2
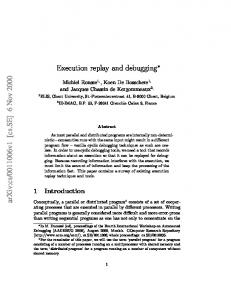
spent an average time of 12.23 min in Session 1, 19.12 in Session 2 and 32.14 in Session 3. Moreover, beginner and advanced subjects spent an average time of 21.17 min (Avg. Trt.) per session ((Session 1 + Session 2 + Session 3)/3). Based on the results summarized in the table the average e↵ort using VS was less than with LR and PP in Session 1 (12.23 min vs 14.24 min vs 34.26 min). Otherwise, in Sessions 2 and 3 the average e↵ort using PP was less than with VS and LR: in Session 2 the e↵ort (min) were 14.63 vs 19.12 vs 20.24 and 20.18 vs 32.14 vs 36.49 in Session 3. These results indicate that VS requires less e↵ort when dealing with simple test cases and scenarios (Session 1 tasks are based on a single test case) than LR and PP. In another way, PP requires less e↵ort to apply regression test or to generate a bunch of test cases than VS and LR. Figure 1 presents the box-plot graph of the Session 1 data set. In this session, the median of execution time with VS and LR were 13.0 minutes and with PP was 31.0 minutes. Moreover, the PP standard deviation was 12.08, LR 4.29 and VS was 3.62. It is important to note that there are two outlier in the data set for PP and one outlier for LR and VS. In another way, Figure 2 presents the box-plot graph of the Session 2, were the median time to execute the PP treatment was 15.0 minutes, while VS and LR treatments were, respectively, 19.0 and 20.0 minutes. Again, note that there are outliers in the data set, in this case two outliers for VS. Finally, Figure 3 presents the box-plot graph of the Session 3 data set. Here, the median of execution time with PP was 20.0 minutes, inasmuch as VS was 30.0 and LR was 36.0 minutes. It is important to note that in this session, PP standard deviation (5.65) is about almost 2 times lower than the other treatments (LR 10.34 and VS 11.26). Although we do not applied a statistical test on the experiment data set, because of the sample size, based on the results presented above we can informally identify the research questions stated in Section 4: RQ1. What is the e↵ort to generate a single performance test script and scenario using PP, LR, and VS? The e↵ort when applying the VS treatment was 12.23 min, the LR was 14.24 min and PP was 34.26 min. Thus, the VS treatment requires less e↵ort, then we reject H0 and accept H3 . RQ2. What is the e↵ort to re-generate performance test scripts and scenarios
PP
LR Treatments
VS
Figure 3: Boxplot Session 3
when using PP, LR, and VS? The e↵ort (minutes) when using the PP, VS, and LR are respectively: 14.63, 19.12, and 20.24. Thus, the PP treatment requires less e↵ort, then we reject H0 and accept H1 . RQ3. What is the e↵ort to generate a set of performance test scripts and scenarios using PP, LR and VS? The e↵ort when applying the PP, VS, and LR treatments are: 20.18, 32.14, and 36.49 min. Thus, we reject H0 and accept H1 .
7.
LESSONS LEARNED
Basically, the main lessons we learned from the design, operation, and analysis of our empirical experiment are:
• Experiment replication. In the context of Software Engineering, an experiment replication consists of repeating an original study to reuse its experiment design, instruments, analysis procedures, among other [12]. An experimental replication can be divided into internal and external [14]: former is conducted by the same research group of the original study; while the latter is applied in a di↵erent context. Therefore, we design our experiment protocol with the intention to replicate it in the future to collect more results for a relevant statistical analysis. Moreover, since we select the experiment subject from a university, that usually provide potential candidates to work in our partner company, and from our partner company employees the results could present bias. It is important to highlight that in our experimental context, our results are useful to support the company’s decision. • Validity of the experiment. From a statistical point of view, these initial results are yet not strong enough to support precise conclusions; For this reason, we did not present the statistics analysis of results, since the sample is not geographically relevant. Nevertheless, they provided significant insights to our partner to take a business decision. In the software industry, engineers are sceptical of the benefits of MBT, mainly due to the needed learning and modeling time and e↵ort. The experiment results provided evidence of e↵ort gains that may support interest in the model-based approach. In the future, we plan to perform external replication of this study, together with studies at real, not in-vitro, environments, to provide significant evidences that could be generalized.
• Lack of a standard performance language/script. One of the issues that motivated our research is the learning curve to replace or upgrade a load generator technology. The experiment’s results point that reuse of this drawback could be handled if the load generators use the same script or technique. For instance, an alternative to avoid this issue could be use a graphical notation, such as a DomainSpecific Languages (DSL) [8], for modeling performance testing and the load generators have a feature to transform (model transformation) the notation into scripts and scenarios, as well as its reverse-engineering.
8.
ADDITIONAL AUTHORS
Additional authors: Priscila Guarienti (PUCRS, email:
[email protected])
9.
REFERENCES
[1] F. Abbors, T. Ahmad, D. Truscan, and I. Porres. MBPeT - a model-based performance testing tool. In Proceedings of the 4th International Conference on Advances in System Testing and Validation Lifecycle, pages 1–8. IARIA, 2012. [2] Amazon. Amazon.com: online shop. Avaliable in: http://www.amazon.com/, 2014. [3] X. Bai. Testing the performance of an ssas cube using vsts. In Proceedings of the 2010 7th International Conference on Information Technology: New Generations, pages 986–991, Washington, USA, 2010. IEEE Computer Society. [4] D. Chadwick, C. Davis, M. Dunn, E. Jessee, A. Kofaldt, K. Mooney, R. Nicolas, A. Patel, J. Reinstrom, K. Siefkes, P. Silva, S. Ulrich, and W. Yeung. Using Rational Performance Tester Version 7. IBM Redbooks, 2008. [5] T. D. Cook and D. T. Campbell. Quasi-Experimentation: Design and Analysis Issues for Field Settings. Houghton Mi✏in, 1979. [6] L. T. Costa, R. Czekster, F. M. Oliveira, E. M. Rodrigues, M. B. Silveira, and A. F. Zorzo. Generating performance test scripts and scenarios based on abstract intermediate models. In Proceedings of the 24rd International Conference on Software Engineering and Knowledge Engineering, pages 112–117, San Francisco, CA, USA, 2012. Knowledge Systems Institute Graduate School. [7] O. El Ariss, D. Xu, S. Dandey, B. Vender, P. McClean, and B. Slator. A systematic capture and replay strategy for testing complex gui based java applications. In Proceedings of the 7th International Conference on Information Technology: New Generations, pages 1038–1043, apr. 2010. [8] M. Fowler. Domain Specific Languages. Addison-Wesley Professional, 1st edition, 2010. [9] M. Grechanik, Q. Xie, and C. Fu. Experimental assessment of manual versus tool-based maintenance of gui-directed test scripts. In Proceedings of the IEEE International Conference on Software Maintenance, pages 9–18, Washington, DC, USA, 2009. IEEE Computer Society. [10] Hewlett Packard HP. Software HP LoadRunner. Available in: http://goo.gl/JU2R5d, 2014.
[11] Y. Jing, Z. Lan, W. Hongyuan, S. Yuqiang, and C. Guizhen. JMeter-based aging simulation of computing system. In Proceedings of the International Conference on Computer, Mechatronics, Control and Electronic Engineering, pages 282–285, Washington, DC, USA, 2010. IEEE Computer Society. [12] N. Juristo and O. S. G´ omez. Replication of software engineering experiments. In B. Meyer and M. Nordio, editors, Empirical Software Engineering and Verification, volume 7007 of LNCS, pages 60–88. Springer Berlin Heidelberg, 2012. [13] D. Menasce. TPC-W: A benchmark for e-commerce. IEEE Internet Computing, 36:83–87, 2002. [14] M. Mendonca, J. Maldonado, M. de Oliveira, J. Carver, S. Fabbri, F. Shull, G. H. Travassos, E. Hohn, and V. Basili. A framework for software engineering experimental replications. In 13th IEEE International Conference on Engineering of Complex Computer Systems, pages 203–212, March 2008. [15] G. J. Myers and C. Sandler. The Art of Software Testing. Wiley, New York, NY, USA, 2004. [16] E. M. Rodrigues. PLeTs: A Product Line of Model-based Testing Tools. PhD thesis, Pontifical Catholic University of Rio Grande do Sul, Porto Alegre, Brazil, 2013. [17] E. M. Rodrigues, F. M. Oliveira, L. T. Costa, M. Bernardino, S. Souza, R. Saad, and A. Zorzo. Model-based testing applied to performance testing: An empirical study (Under Review ). Empirical Software Engineering, 2014. [18] E. M. Rodrigues, L. D. Viccari, A. F. Zorzo, and I. M. Gimenes. PLeTs tool - test automation using software product lines and model based testing. In Proceedings of the 22th International Conference on Software Engineering and Knowledge Engineering, pages 483–488, Redwood City, CA, USA, jul. 2010. [19] G. Ru↵o, R. Schifanella, M. Sereno, and R. Politi. WALTy: A user behavior tailored tool for evaluating web application performance. In Proceedings of the Network Computing and Applications, Third IEEE International Symposium, pages 77–86, Washington, DC, USA, 2004. IEEE Computer Society. [20] M. B. Silveira, E. M. Rodrigues, A. F. Zorzo, H. Vieira, and F. Oliveira. Model-based automatic generation of performance test scripts. In Proceedings of the 23rd International Conference on Software Engineering and Knowledge Engineering, pages 258–263, Miami, FL, USA, 2011. [21] B. Software. Performance benchmarking kit using incident management with silkperformer. Technical report, BMC Software, 2007. [22] TestOptimal. Testoptimal model-based test automation. Available in: http://www.testoptimal.com/, 2014. [23] C. Wohlin, P. Runeson, M. H¨ ost, M. C. Ohlsson, B. Regnell, and A. Wessl´en. Experimentation in Software Engineering: An Introduction. Kluwer Academic Publishers, 2000. [24] M. Zhang. Argouml. Journal of Computing Sciences in Colleges, 21:6–7, 2006.