665697
research-article2016
ASMXXX10.1177/1073191116665697AssessmentLouie et al.
Article
Evaluating Circumplex Structure in the Interpersonal Scales for the NEO-PI-3
Assessment 1–7 © The Author(s) 2016 Reprints and permissions: sagepub.com/journalsPermissions.nav DOI: 10.1177/1073191116665697 asm.sagepub.com
Jennifer F. Louie1, John E. Kurtz2, and Patrick M. Markey2
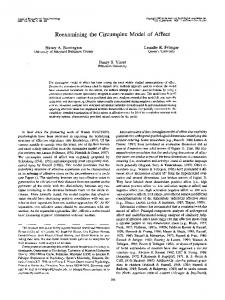
Abstract Scales to assess the eight octants and two axes of the interpersonal circumplex (IPC) using items from the revised NEO Personality Inventory were introduced by Traupman et al. Item changes in the revised and renormed third edition of the NEO instrument (NEO-PI-3) have affected item content in all eight octant scales, underscoring the need to reexamine the IPC scales. The current study examines the circumplex structure of the revised octant scales in the NEO-PI-3 and their correlations with the Dominance and Warmth scales of the Personality Assessment Inventory in 568 undergraduate students. The data show perfect fit to circumplex structure, suggesting equivalent or better assessment of the IPC with the NEO-PI-3 octant scales. Convergence of the eight octants with the Personality Assessment Inventory interpersonal scales further supports their saturation with interpersonal content and appropriate location within the IPC. Keywords interpersonal circumplex, NEO-PI-3, PAI, dominance, warmth, convergent validity Interpersonal theory (Carson, 1969; Sullivan, 1953) and its associated circumplex model for assessment (Kiesler, 1983; Leary, 1957; Wiggins, 1979) provide an elegant account of individual differences with utility for research in personality theory and psychotherapy process. Wiggins (2003) maintains that the two fundamental dimensions of interpersonal behavior, dominance (agency, control) and warmth (communion, nurturance), represent metaconcepts that are at the core of all personality theories. A wide array of social phenomena are represented by the interpersonal circumplex (IPC), a well-specified structural model in which the dominance and warmth axes are positioned orthogonally to each other in a two-dimensional space, and this circumplex space is further divided into eight equal sectors or “octants.” See Figure 1 for the names and acronyms of the two axes and eight sectors. Octants that represent highly related constructs are positioned in adjacent octants in the IPC, octants representing unrelated constructs are positioned at a 90° angle, and octants representing constructs that are conceptually opposite are positioned at 180°. Strong support for the IPC as a model of interpersonal style has accumulated through decades of research (Gurtman, 1992). There are several reasons why psychologists find it useful to measure and study interpersonal variables. First, the IPC has contributed to our understanding of basic personality trait dimensions, as it intersects meaningfully with the largest two factors of the five-factor taxonomy (McCrae & Costa, 1989; Trapnell & Wiggins, 1990). Second, the constructs of the IPC have direct relevance for conceptualization and assessment of
the personality disorders (Benjamin, 1993; Hopwood, Wright, Ansell, & Pincus, 2013; Wiggins & Pincus, 1989). Third, applying interpersonal research to clinical practice may enhance understanding of therapeutic process and improve outcome (Kiesler, 1996), as the pervasiveness of interpersonal problems in clinical settings makes them an optimal target for treatment (Horowitz, 1979). For example, evidence suggests an association between treatment outcome and the patients’ interpersonal style. Patients with more “cold” and “dominant” personalities show poorer prognosis in brief dynamic psychotherapy relative to patients with “warm” and “submissive” personalities (Horowitz, Rosenberg, & Bartholomew, 1993). A variety of approaches have been developed for assessment of the IPC variables. First, there are stand-alone measures of the IPC, including the Interpersonal Adjectives Scale (IAS; Wiggins, 1995), a collection of 64 adjective items that are rated using an 8-point response format. The simple adjective presentation on the IAS lends itself to gathering self-ratings or ratings from informants (Kurtz, Lee, & Sherker, 1999). A collection of 32 items from the International Personality Item Pool (Goldberg et al., 2006) has been identified to measure the eight octants with 4-item 1
University of Central Florida, Orlando, FL, USA Villanova University, Villanova, PA, USA
2
Corresponding Author: Jennifer F. Louie, Department of Psychology, University of Central Florida, 4000 Central Florida Boulevard, Orlando, FL 32816, USA. Email:
[email protected]
Downloaded from asm.sagepub.com at VILLANOVA UNIV on November 9, 2016
2
Assessment
Figure 1. Generic interpersonal circumplex model (e.g., Carson, 1969; Leary 1957; Wiggins, 1979).
scales (Markey & Markey, 2009). Alden, Wiggins, and Pincus (1990) used the IPC model to construct a 64-item circumplex version of the original 127-item Inventory of Interpersonal Problems (IIP; Horowitz, Rosenberg, Baer, Ureño, & Villaseñor, 1988), and this measure was followed with a 32-item short circumplex version (IIP-SC; Soldz, Budman, Demby, & Merry, 1995). Assessment of the IPC has also been incorporated within broadband personality measures, such as the Personality Assessment Inventory (PAI; Morey, 2007). The PAI includes two 12-item interpersonal scales, Dominance (DOM) and Warmth (WRM) to measure the primary axes of the IPC. Ansell, Kurtz, DeMoor, and Markey (2011) showed strong convergence between the PAI interpersonal scales and the principal axes of the IAS and IIP-SC. The ubiquitous nature of interpersonal content in published personality inventories also allows for the prospect of extracting IPC scales within existing item pools. For example, Ayearst, Sellbom, Trobst, and Bagby (2013) located six scales from the restructured form of the Minnesota Multiphasic Personality Inventory–2 (Tellegen & Ben-Porath, 2008) in IPC space. Finally, eight IPC octant scales have been derived from the item pool of the revised NEO Personality Inventory (NEO-PI-R; Costa & McCrae, 1992). Using item sets identified by Wiggins and Trobst (1998), Traupman et al. (2009) evaluated the circumplex structure of these NEO-IPC octant scales in a sample of 301 married couples from the community. Each octant scale contains 6 items, and all 48 items were taken from the NEO-PI-R Extraversion and Agreeableness domain scales. All 12 facet scales from these two domains contribute at least one item to the NEO-IPC octants, and some items are scored in the opposite direction of the original NEO-PI-R scoring key. For example, the PA (assured–dominant) octant items are mostly taken from the
Assertiveness facet scale of Extraversion, and the BC (arrogant–calculating) octant items are reversed scored items taken from the Modesty and Straightforwardness facet scales of Agreeableness. Traupman et al. (2009) report modest internal reliability for the original NEO-IPC octant scales, with coefficient alphas ranging from .54 (JK [unassuming–ingenuous]) to .77 (BC) and median alpha of .68. Principal components analysis revealed a clear two-factor structure, identifiable as control and affiliation, for each of four separate analyses (self-reports and spouse ratings from wives and husbands). Additionally, self-spouse correlations demonstrated convergent and discriminant validity, with strongest correlations for corresponding octants and octants located adjacent to each other and weakest correlations for polar opposite octant scales. Overall, the eight octants showed rotational equivalence to IPC structure, and this has encouraged use of the NEO-IPC octant scales in subsequent research (e.g., Baron, Smith, Uchino, Baucom, & Birmingham, 2016; Cain et al., 2012; Cundiff, Smith, Uchino, & Berg, 2011; Smith, Ruiz, Cundiff, Baron, & Nealey-Moore, 2013; Thomas et al., 2014).
Development of the NEO Personality Inventory–3 The NEO-PI-3 (McCrae & Costa, 2010) is a recently revised and renormed version of the NEO-PI-R, developed as a means to reduce difficulties in reading comprehension and increase internal consistency for the facet scales (McCrae, Costa, & Martin, 2005). McCrae et al. (2002) noted that some respondents experience difficulty in comprehending certain items (e.g., those containing vocabulary such as fastidious or lackadaisical). Using data from adolescent and adult respondents, McCrae et al. identified 48 items from the 240 items of the NEO-PI-R that were problematic candidates for revision. Two alternative versions were composed for each item to create a set of 96 experimental items. These 96 alternative items were interspersed among the original 240 NEO-PI-R items to create an experimental form that was administered to 536 respondents aged 14 to 20 years. The corrected item–facet correlations and estimates of reading level were employed in final item selection, resulting in the replacement of 37 NEO-PI-R items with one of the two alternative items. Internal consistency of the revised domain and facet scales remained the same or increased with both Form S (i.e., self-report format) and Form R (i.e., observer format).
Aims of the Present Study It is unknown if the item changes in the NEO-PI-3 have had an impact on the octant scales introduced by Traupman et al. (2009). Twenty-one of the 48 original items have been
Downloaded from asm.sagepub.com at VILLANOVA UNIV on November 9, 2016
3
Louie et al. substituted or revised, with at least two item changes for each of the eight octant scales. Accordingly, the primary aim of the current study is to evaluate the circumplex structure of the NEO-IPC octants when measured with the new NEO-PI-3 items. In addition, the convergence of the new octant scales with other interpersonal variables is evaluated using concurrent data from the PAI, as previous work by Ansell et al. (2011) suggests strong convergence of the PAI interpersonal scales with two other established IPC measures. Collectively, these analyses would test the usefulness of the NEO-PI-3 as a tool for measuring the IPC.
Table 1. Items From the NEO-PI-3 Organized by Interpersonal Octant Scales.
Method
Note. NEO-PI-3 = NEO Personality Inventory–3; NEO-PI-R = revised NEO Personality Inventory; PA = assured–dominant; BC = arrogant– calculating; DE = coldhearted; FG = aloof–introverted; HI = unassured– submissive; JK = unassuming–ingenuous; LM = warm–agreeable; NO = gregarious–extraverted. *Wording of this item was changed from the NEO-PI-R in the NEO-PI-3 revision.
Participants and Procedure Five hundred and sixty-eight undergraduate students from a medium-size, private university in the Northeastern United States took part in the present study and provided complete data in exchange for credit toward course requirements. The sample includes 329 females (57.9%) and 239 males (42.1%). Participants were normal age college students (M = 19.0 years; SD = 1.5), with most (89%) in the freshman or sophomore class. The majority (81%) reported their ethnicity as White; the remaining participants reported as African American (4%), Latino/Latina (4%), Asian (7%), or mixed/ other ethnicity (4%). Half of the participants (49.3%) completed the NEO-PI-3 before the PAI, while the remaining half completed the PAI before the NEO-PI-3. The gender ratio was comparable across the two order conditions; 41.2% of the NEO-first group was male and 42.8% of the PAI-first group was male. Participants completed both measures in their entirety.
Measures NEO Personality Inventory–3 (McCrae & Costa, 2010). The NEO-PI-3 is a 240-item inventory of general personality traits, originally constructed in accordance with the fivefactor model. Items are endorsed using a 5-point response format ranging from strongly disagree to strongly agree. The reliability and validity of the NEO-PI-3 to measure fivefactor model personality traits has been established across both English and non-English-speaking cultures (de Fruyt, de Bolle, McCrae, Terracciano, & Costa, 2009). Central to the current study, the eight NEO-IPC octant scales were scored using the original item formulae for the NEO-PI-R provided by Traupman et al. (2009; see Table 1). None of the 48 items used to score the NEO-IPC scales were missing. Median coefficient alpha for the eight scales was .70, ranging from .56 (FG [aloof–introverted]) to .73 (BC). Personality Assessment Inventory (Morey, 2007). The PAI is a 344-item multiscale inventory used to assess personality and psychopathology in adults. It consists of 22 nonoverlapping
Scale
Item numbers in NEO-PI-3
PA BC DE FG HI JK LM NO
12, 47*, 72, 132, 142*, 192 24, 39, 144*, 159, 189*, 234 4*, 14*, 74, 92, 124, 134* 27, 67, 87*, 127*, 137*, 187 42*, 54, 79, 102, 162, 222* 9, 19*, 69, 139*, 174*, 204 44*, 104, 184*, 194, 209, 224* 37, 117*, 122, 177*, 217*, 237
Table 2. Intercorrelation Matrix of the NEO-PI-3 Octant Scales.
PA BC DE FG HI JK LM NO
PA
BC
— .31 .01 −.35 −.65 −.33 .17 .41
— .44 .09 −.31 −.59 −.38 −.08
DE
— .42 .01 −.37 −.57 −.43
FG
— .39 −.04 −.31 −.60
HI
— .41 .00 −.28
JK
— .37 .13
LM
NO
— .46
—
Note. NEO-PI-3 = NEO Personality Inventory–3; PA = assured– dominant; BC = arrogant–calculating; DE = coldhearted; FG = aloof– introverted; HI = unassured–submissive; JK = unassuming–ingenuous; LM = warm–agreeable; NO = gregarious–extraverted; n = 568. Bolded values indicate the largest negative for each international personality item pool–interpersonal circumplex (IPIP-IPC) scale.
scales: 4 validity scales, 11 clinical scales, 5 treatment considerations scales, and 2 interpersonal scales. The interpersonal scales, relevant to the current study, are Dominance (DOM) and Warmth (WRM). Each scale consists of 12 items that are endorsed using a 4-point response format labeled: False, Slightly True, Mainly True, and Very True.
Results Circumplex Structure Analyses Table 2 presents the intercorrelations of the eight NEO scales. As would be expected from a circular structure, the highest positive correlation for each scale occurred with an adjacent octant and the highest negative correlation was with an opposite octant. When a principal components analysis
Downloaded from asm.sagepub.com at VILLANOVA UNIV on November 9, 2016
4
Assessment
Figure 2. Component loadings of the NEO Personality Inventory–3 octant scales in the current sample.
Note. PA = assured–dominant; BC = arrogant–calculating; DE = coldhearted; FG = aloof–introverted; HI = unassured–submissive; JK = unassuming–ingenuous; LM = warm–agreeable; NO = gregarious– extraverted.
was conducted on these intercorrelations, a clear two-factor solution emerged as evidenced by the second to third eigenvalue ratio (eigenvalues = 2.18, 2.51, and .63). To visually demonstrate the circular nature of the scales, Figure 2 displays the loadings of the eight octant scales on the two factors. A more precise way to assess the extent to which the scales conform to a circular structure is to examine whether the eight scales are related to each other in a manner predicted by the IPC. Specifically, the correlations of octants closer on the circle are predicted to be greater than those more distal. The correlations for the octant scales separated by 45° (e.g., PA and BC, BC and DE [coldhearted], DE and FG, etc.) should be greater than the correlations for the octants separated by 90° (e.g., PA and DE, BC and FG, DE and HI [unassured–submissive], etc.); the correlations for the octants separated by 90° should be greater than the octants separated by 135° (e.g., PA and FG, BC and HI, DE and JK, etc.); and the correlations for the octants separated by 135° should be greater than the correlations for the octants separated by 180° (e.g., PA and HI, BC and JK, DE and LM [warm–agreeable], etc.). The circular structure also suggests that the correlations of octants separated by 45° are greater than those separated by 135° and those separated by 180°; and the correlations of the octants separated by 90° are greater than the octants separated by 180°. Taken together, the circular structure presented in Figure 1 generates a total of 288 order predictions for a perfect circumplex model. To evaluate the fit of the circular model to the obtained correlation matrices, a correspondence index (CI) was computed (Hubert & Arabie, 1987). The CI serves as a measure of fit of a correlation matrix with the order predictions and is computed by
Figure 3. Correlations between Personality Assessment Inventory Dominance and Warmth scales and the eight octants of the NEO Personality Inventory–3. Note. PA = assured–dominant; BC = arrogant–calculating; DE = coldhearted; FG = aloof–introverted; HI = unassured–submissive; JK = unassuming–ingenuous; LM = warm–agreeable; NO = gregarious– extraverted.
comparing an obtained correlation matrix with the 288 order predictions (Hubert & Arabie, 1987). The CI is a correlation coefficient (Somers’s D; Somers, 1962) that can range from +1 (perfect fit) to −1 (no predictions were met), with a CI of 0.0 indicating the number of predictions met is equal to the number of predictions violated. To evaluate the significance of the fit of a circumplex model to the obtained correlation matrices, the confirmation or violation of the 288 order predictions for that circumplex model is examined with a randomization test of hypothesized order relations (Hubert & Arabie, 1987; Rounds, Tracey, & Hubert, 1992). This test yields an exact probability of obtaining the predicted order among the correlations in the observed data matrix under the null hypothesis that the octant scales are relabeled at random; no assumptions about the independence of the order predictions are made. In a correlation matrix with eight variables, there are a total of 8 (40,320) possible random matrices that can be used to create a comparison distribution for evaluating the fit of the original matrix. Randomization tests were computed to examine the 288 predicted order relations using the RANDALL (Tracey, 1997) set of computer programs. Results indicated perfect fit (CI = 1.0) for the order predictions and none of the random matrices fit the predicted order relations better than the original matrices (p < .001).1
Convergence With PAI Dominance and Warmth In order to relate PAI Dominance and Warmth to the NEOIPC octants, the two PAI scales were first correlated with the eight octants of the NEO-IPC. Figure 3 displays the obtained
Downloaded from asm.sagepub.com at VILLANOVA UNIV on November 9, 2016
5
Louie et al. Table 3. Structural Summary of PAI Interpersonal Scales. PAI scale Dominance Warmth
Elevation
Amplitude
R2
Angular location
−.02 .02
.60 .63
.92 .99
94° 33°
Note. PAI = Personality Assessment Inventory; n = 568.
correlations between each of the NEO octants and PAI Dominance and Warmth. To better define the correlation patterns presented in this figure, data were next analyzed using the structural summary method (Gurtman 1992; Gurtman & Balakrishnan, 1998; Gurtman & Pincus, 2000; Wright, Pincus, Conroy, & Hilsenroth, 2009). This methodology recognizes that, given the circumplex structure of the NEO-IPC, the pattern of correlations presented in the figures should exhibit a sinusoidal pattern. The pattern of a sinusoidal curve can be summarized using the formula (Gurtman, 1992):
ri = e + a × cos(θi - δ) + d (1)
where ri is the expected correlation for octant i, e is the elevation of the curve, a is the amplitude, θi is the angular location of octant i, δ is the angular displacement of the curve, and d is a deviation component. The elevation of the curve represents the predicted average correlation between a given PAI scale and the NEO-IPC octant scales. Because the NEO-IPC has no general factor, this value should be close to zero. As shown in Table 3, the elevations for both scales were near zero. The amplitude of the curve represents the highest predicted positive correlation of a given PAI scale with the eight NEO-IPC octant scores minus the elevation of the curve. In the current data, both amplitude values were .60 or greater. The angular displacement of the curve is the point at which the curve reaches its highest point (i.e., where the correlation is predicted to be highest) and represents the angular location of the PAI Scale on the circumplex. PAI Dominance obtained an angular location of 94°, placing it in the assured-dominant octant of the IPC, whereas PAI Warmth obtained an angular location of 33°, placing it in the gregarious–extraverted octant of the IPC. A goodness-of-fit statistic, R2, indicates the extent to which the predicted and actual values converge (i.e., the proportion of variability in the correlation profile accounted for by the model), and can be computed to determine how well the PAI scale profiles presented in Figure 3 fit the predicted sinusoidal pattern (Gurtman & Balakrishnan, 1998). A high R2 value (i.e., greater than .75; Wright et al., 2009) indicates that the angular displacement of a given PAI scale is interpretable, whereas a low value indicates that the observed behavioral pattern of a PAI scale cannot be adequately summarized by a single angular displacement value. In the current analysis, both of the PAI interpersonal scales
obtained high R2 values (R2 = .92 and .99), indicating that PAI Dominance and Warmth contain strong interpersonal content and the IPC angular locations computed above can be used to better understand the interpersonal nature of these scales.
Discussion Personality assessment and research can benefit from the availability of octant scales to assess the IPC within a larger existing inventory. Traupman et al. (2009) have previously introduced such scales for the NEO-PI-R, an instrument that is well validated and widely used in social sciences research. Revision to the larger instrument in the creation of the NEO-PI-3, however, has introduced changes in item content to nearly half (44%) of the items that comprise the NEO-IPC of Traupman et al. (2009). Accordingly, the current study sought to confirm that valid assessment of the IPC was retained in the revised NEO-PI-3. Statistical tests of circumplex structure strongly support the validity of the NEO-PI-3 interpersonal scales as a tool for measuring the IPC. As shown by the intercorrelations between the octants, octants that are theoretically related are also highly and positively correlated. As octants become less theoretically related, their correlations exhibit smaller values. The obtained CI indicates a perfect fit between the correlation matrix and the circular model, meaning that all 288 order predictions are met with the current data. Traupman et al. (2009) conducted similar RANDALL tests (Tracey, 1997) of circumplex structure and reported CI values ranging from .93 to .99 across their four data sets. Thomas et al. (2014) also performed RANDALL tests on the NEO-PI-R octant scores gathered from 155 patients with personality disorders, and, like the current study, they report perfect correspondence to the order predictions. Thus, the current finding of perfect fit to circumplex structure suggests that the octant scales for the NEO-PI-3 have a circular structure that shows equal or better fit than the original octant scales for the NEO-PI-R. The current study also evaluated the interpersonal content of the octant scales by examining their convergence with the PAI interpersonal scales, Dominance and Warmth. Projecting the two PAI dimensions into the space created by the NEO-IPC octant scales produced the desired sinusoidal pattern. The resulting structural summary statistics showed the PAI scales to be well saturated with interpersonal content. DOM scores located very close to the purely dominant position in the IPC (90°), whereas WRM scores located somewhat oblique to the purely warm position (i.e., 0°) and in an adjacent octant region (NO; gregarious–extraverted). The content of the WRM items on the PAI are somewhat slanted toward the more agentic manifestations of warm or nurturing behavior. With the exception of angular displacement for WRM, the structural summary findings reported in Table 3 compare favorably with those reported by Ansell
Downloaded from asm.sagepub.com at VILLANOVA UNIV on November 9, 2016
6
Assessment
et al. (2011), projecting DOM and WRM into IPC spaces created by the IAS and IIP-C. In addition to validating the octant scales for the NEO-PI-3, the current findings also lend additional support for the validity of the PAI interpersonal scales, DOM and WRM. Although these results are encouraging for prospective users of the NEO-IPC from the NEO-PI-3, the primary limitation of the current study is the lack of representativeness of the sample. Undergraduate students from a private, selective university have a restricted age range and above average socioeconomic status. In light of this lack of demographic diversity, it is noteworthy that perfect fit to circumplex structure was obtained, as this would require ample variability in interpersonal style among these students. Nonetheless, the octant scales should be evaluated in older adults and in clinical samples to ensure their validity to assess the main dimensions and octants of the IPC. Acknowledgments We would like to thank Hilary DeShong, Catherine Sanders, Nicole Cross, Lindsey Bupp, Kelly McCusker, Mark Versella, Nicholas Brown, Jimena Escolan, Mary-Kate Duffy, and Kristen Panny for their assistance with protocol administration and data management.
Declaration of Conflicting Interests The author(s) declared no potential conflicts of interest with respect to the research, authorship, and/or publication of this article.
Funding The author(s) received no financial support for the research, authorship, and/or publication of this article.
Note 1. The circumplex structure of the NEO-IPC was further demonstrated when the specialized SEM program CIRCUM was employed (Browne & Cudeck, 1992). Even the most constrained model with equal communalities and equal spacing among the scales produced extremely good fit (adjusted goodness-of-fit index = .96; root mean square of approximation = .06).
References Alden, L. E., Wiggins, J. S., & Pincus, A. L. (1990). Construction of circumplex scales for the Inventory of Interpersonal Problems. Journal of Personality Assessment, 55, 521-536. Ansell, E. B., Kurtz, J. E., DeMoor, R. M., & Markey, P. M. (2011). Validity of the PAI interpersonal scales for measuring dimensions of the interpersonal circumplex. Journal of Personality Assessment, 93, 33-39. Ayearst, L. E., Sellbom, M., Trobst, K. K., & Bagby, M. (2013). Evaluating the interpersonal content of the MMPI-2-RF interpersonal scales. Journal of Personality Assessment, 95, 187-196. Baron, C. E., Smith, T. W., Uchino, B. N., Baucom, B. R., & Birmingham, W. C. (2016). Getting along and getting ahead:
Affiliation and dominance predict ambulatory blood pressure. Health Psychology, 35, 253-261. Benjamin, L. S. (1993). Interpersonal diagnosis and treatment of personality disorders. New York, NY: Guilford Press. Browne, M. W., & Cudeck, R. (1992). Alternative ways of assessing model fit. Sociological Methods & Research, 21, 230-258. Cain, N. M., Ansell, E. B., Wright, A. G. C., Hopwood, C. J., Thomas, K. M., Pinto, A., . . .Grilo, C. M. (2012). Interpersonal pathoplasticity in the course of major depression. Journal of Consulting and Clinical Psychology, 80, 78-86. Carson, R. C. (1969). Interaction concepts of personality. Chicago, IL: Aldine. Costa, P. T., & McCrae, R. R. (1992). NEO PI-R professional manual. Odessa, FL: Psychological Assessment Resources. Cundiff, J. M., Smith, T. W., Uchino, B. N., & Berg, C. A. (2011). An interpersonal analysis of subjective social status and psychosocial risk. Journal of Social and Clinical Psychology, 30, 47-74. de Fruyt, F., de Bolle, M., McCrae, R. R., Terracciano, A., & Costa, P. T. (2009). Assessing the universal structure of personality in early adolescence: The NEO-PI-R and NEO-PI-3 in 24 cultures. Assessment, 16, 301-311. Goldberg, L. R., Johnson, J. A., Eber, H. W., Hogan, R., Ashton, M. C., Cloninger, C. R., & Gough, H. G.(2006). The international personality item pool and the future of public-domain personality measures. Journal of Research in Personality, 40, 84-96. Gurtman, M. B. (1992). Construct validity of interpersonal personality measures: The interpersonal circumplex as a nomological net. Journal of Personality and Social Psychology, 63, 105-118. Gurtman, M. B., & Balakrishnan, J. (1998). Circular measurement redux: The analysis and interpretation of interpersonal circle profiles. Clinical Psychology: Science and Practice, 5, 344-360. Gurtman, M. B., & Pincus, A. L. (2000). Interpersonal Adjective Scales: Confirmation of circumplex structure from multiple perspectives. Personality and Social Psychology Bulletin, 26, 374-384. Hopwood, C. J., Wright, A. G. C., Ansell, E. B., & Pincus, A. L. (2013). The interpersonal core of personality pathology. Journal of Personality Disorders, 27, 270-295. Horowitz, L. M. (1979). On the cognitive structure of interpersonal problems treated in psychotherapy. Journal of Consulting and Clinical Psychology, 47, 5-15. Horowitz, L. M., Rosenberg, S. E., Baer, B. A., Ureño, G., & Villaseñor, V. S. (1988). Inventory of interpersonal problems: Psychometric properties and clinical applications. Journal of Consulting and Clinical Psychology, 56, 885-892. Horowitz, L. M., Rosenberg, S. E., & Bartholomew, K. (1993). Interpersonal problems, attachment styles, and outcome in brief dynamic psychotherapy. Journal of Consulting and Clinical Psychology, 61, 549-560. Hubert, L., & Arabie, P. (1987). Evaluating order hypotheses within proximity matrices. Psychological Bulletin, 102, 172-178. Kiesler, D. J. (1983). The 1982 interpersonal circle: A taxonomy for complementarity in human transactions. Psychological Review, 90, 185-214. Kiesler, D. J. (1996). Contemporary interpersonal theory and research: Personality, psychopathology, and psychotherapy. New York, NY: Wiley.
Downloaded from asm.sagepub.com at VILLANOVA UNIV on November 9, 2016
7
Louie et al. Kurtz, J. E., Lee, P. A., & Sherker, J. L. (1999). Internal and temporal reliability estimates for informant ratings of personality using the NEO PI-R and IAS. Assessment, 6, 103-113. Leary, T. (1957). Interpersonal diagnosis of personality. New York, NY: Ronald Press. Markey, P. M., & Markey, C. N. (2009). A brief assessment of the interpersonal circumplex: The IPIP-IPC. Assessment, 16, 352-361. McCrae, R. R., & Costa, P. T. (1989). The structure of interpersonal traits: Wiggin’s circumplex and the five-factor model. Journal of Personality and Social Psychology, 56, 586-595. McCrae, R. R., & Costa, P. T. (2010). NEO Inventories professional manual. Lutz, FL: Psychological Assessment Resources. McCrae, R. R., Costa, Jr., P. T., & Martin, T. A. (2005). The NEO– PI–3: A more readable revised NEO Personality Inventory. Journal of Personality Assessment, 84, 261-270. McCrae, R. R., Costa, P. T., Terracciano, A., Parker, W. D., Mills, C. J., de Fruyt, F. D., & Mervielde, I. (2002). Personality trait development from age 12 to age 18: Longitudinal, crosssectional, and cross-cultural analyses. Journal of Personality and Social Psychology, 83, 1456-1468. Morey, L. C. (2007). The Personality Assessment Inventory professional manual (2nd ed.). Lutz, FL: Psychological Assessment Resources. Rounds, J., Tracey, T. J., & Hubert, L. (1992). Methods for evaluating vocational interest structural hypotheses. Journal of Vocational Behavior, 40, 239-259. Smith, T. W., Ruiz, J. M., Cundiff, J. M., Baron, K. G., & NealeyMoore, J. (2013). Optimism and pessimism in social context: An interpersonal perspective on resilience and risk. Journal of Research in Personality, 47, 553-562. Soldz, S., Budman, S., Demby, A., & Merry, J. (1995). A short form of the Inventory of Interpersonal Problems Circumplex scales. Assessment, 2, 53-63. Somers, R. H. (1962). A new asymmetric measure of association for ordinal variables. American Sociological Review, 27, 799-811. Sullivan, H. S. (1953). The interpersonal theory of psychiatry. New York, NY: Norton.
Tellegen, A., & Ben-Porath, Y. S. (2008). Minnesota Multiphasic Personality Inventory-2-restructured form: Technical manual. Minneapolis: University of Minnesota Press. Thomas, K. M., Hopwood, C. J., Donnellan, M. B., Wright, A. G. C., Sanislow, C. A., McDevitt-Murphy, M., . . .Morey, L. C. (2014). Personality heterogeneity in PTSD: Distinct temperament and interpersonal typologies. Psychological Assessment, 26, 23-34. Tracey, T. J. (1997). RANDALL: A Microsoft FORTRAN program for a randomization test of hypothesized order relations. Educational and Psychological Measurement, 57, 164-168. Trapnell, P., & Wiggins, J. S. (1990). Extension of the Interpersonal Adjective Scales to include the Big Five dimensions of personality. Journal of Personality and Social Psychology, 59, 781-790. Traupman, E. K., Smith, T. W., Uchino, B. N., Berg, C. A., Trobst, K. K., & Costa, P. T. (2009). Interpersonal circumplex octant, control, and affiliation scales for the NEO-PI-R. Personality and Individual Differences, 47, 457-463. Wiggins, J. S. (1979). A psychological taxonomy of trait-descriptive terms: The interpersonal domain. Journal of Personality and Social Psychology, 37, 395-412. Wiggins, J. S. (1995). Interpersonal Adjective Scales: Professional manual. Odessa, FL: Psychological Assessment Resources. Wiggins, J. S. (2003). Paradigms of personality assessment. New York, NY: Guilford Press. Wiggins, J. S., & Pincus, A. L. (1989). Conceptions of personality disorders and dimensions of personality. Psychological Assessment, 1, 305-316. Wiggins, J. S., & Trobst, K. K. (1998, August). A circumplex model for the NEO-PI-R. Paper presented at the annual meeting of the American Psychological Association, San Francisco, CA. Wright, A. G. C., Pincus, A. L., Conroy, D., & Hilsenroth, M. (2009). Integrating methods to optimize circumplex description and comparison of groups. Journal of Personality Assessment, 91, 311-322.
Downloaded from asm.sagepub.com at VILLANOVA UNIV on November 9, 2016