management application performance while minimizing cost. We evaluate a range of host and ... that reduces overall maintenance costs. For example, several.
1
Evaluating Impact of Manageability Features on Device Performance Jacob Leverich, Vanish Talwar*, Parthasarathy Ranganathan*, Christos Kozyrakis Stanford University * HP Labs, Palo Alto Abstract—Manageability is a key design constraint for IT solutions, defined as the range of operations required to maintain and administer system resources through their lifecycle phases. Emerging complex and powerful management platforms and automation software expose new tensions — between the host and management applications, between costs and performance, and between costs and complexity. In this paper, we take a systematic approach to the evaluation of manageability workloads and define metrics for evaluating manageability efficiency. We propose the Manageability Quotient (MaQ) as a holistic measure of a system’s ability to deliver guarantees on both host and management application performance while minimizing cost. We evaluate a range of host and management workloads on various manageability platforms using the metrics. Our results, based on more than 4000 experiments, provides insights on the merits and demerits of different configurations.
I. I NTRODUCTION From consumer desktops to enterprise data centers, the increasing complexity of computer systems and IT solutions is making manageability (management, maintainability) one of the key design considerations Indeed, several studies have identified that, sometimes, up to 60-70% of IT costs can be spent on manageability [2]. With rising complexity and scale, many of the management tasks have become nontrivial in computation, design, and in the number of execution steps performed by system administrators. As a result, we are seeing a vast growth in the development of manageability platforms, and an adoption of automation software that reduces overall maintenance costs. For example, several software-based solutions are commercially available such as HP OpenView/System Insight Manager and IBM Tivoli. Similarly, there have also been efforts to enhance manageability support at the hardware level, e.g., HP’s integrated lights out (iLO) processor [3] or Intel’s Active Management Technology (AMT) [4]. With the proliferation of these new approaches, there is a corresponding need to evaluate the effectiveness of such manageability solutions. Prior studies have only relied on adhoc methods or intuition to demonstrate the benefits of their approach, or have focused purely on the reduction in the number of steps performed by the system administrator [6], [1]. There is a need for a good metric and thorough evaluation that captures the impact of manageability solutions on overall device performance. This includes both the interference of management applications with host workloads, as well as the impact of host applications to management performance. Furthermore, the evaluation must consider various hardware and system software choices for deploying management applications. This paper addresses these challenges. In particular we make two key contributions.
We specify the requirements for, and design, several metrics for evaluating the impact of manageability solutions. In particular, we also propose a metric — the MaQ number of a manageability solution — that provides a unified metric to address performance, both for the management application and host application, and cost tradeoffs in terms of increased hardware/software complexity, and associated recurring operational costs such as power and cooling. We implement a wide variety of management solutions (provisioning, diagnostics, security, maintenance), on several different hardware (shared with host or using separate inband or out-of-band management processors) and software platforms (shared or separate software stacks, with or without priority scheduling). Based on more than 4000 experiments on these configurations, we evaluate various configurations using the chosen metrics. IT managers can use such a systematic study to understand the impact of manageability features on overall device performance and make appropriate design choices. The study can also be used to influence the design of future hardware and software manageability solutions. II. M ANAGEABILITY M ETRICS Manageability in our context refers to the range of operations required to maintain system resources through their lifecycle phases. Example of management workloads include provisioning, backup, disk protection, virus scan, fault diagnostics, hardware monitoring, and asset management. These various management workloads can be executed in a variety of configurations - both hardware and software. Among hardware alternatives, the management applications and the host applications can either run (i) on the same processor/core, or (ii) on different cores in a multi-core Chip Multiprocessor (CMP) configuration, or (iii) alternatively on different CPU sockets in a multi-socket shared memory multiprocessor, or (iv) one could offload the management applications to off-chip southbridge accelerators such as manageability processors extending available manageability ASICS such as iLO [3], iAMT [4]. These typically would be low power embedded processors and they run a separate operating system stack independent form host OS. From the software point of view, a manageability application can be executed as either with equal priority whereby manageability and host applications share all of the OS resources equally, or in alternate configurations the manageability tasks can be executed at reduced or throttled priority. Furthermore, the manageability application itself could be designed to be deployed in manual or semi-automated manner, or as a fully automated solution. We thus see that one can instantiate a manageability solution in a production environment in a variety of ways But in all
2
configurations, there is some trade off with respect to the effect of a manageability workload on host application, and the CPU, memory, and I/O resource contention. Additionally, the multi-core and multi-socket configurations may have power inefficiencies and hence increased energy costs from having an entire core or processor powered on for manageability applications. Furthermore, the reverse scenario also takes place, i.e, a resource-hogging host application can negatively impact the progress of the management application. Thus, we see that an inefficient and ad-hoc mapping of management applications to system configurations can affect the efficacy of both the host and management tasks. In order to evaluate the effectiveness and tradeoffs of the various manageability system configurations, we explore various metric choices. Below, we present a logical set of choices, progressively increasing the complexity and integration of the metric parameters as we go along in the description. Host application performance metric (h). This metric represents performance of the host applications while they are running in conjunction with a management application (examples could be page requests served per second by a web server, or runtime to do a complex SQL query by a database server). To facilitate meaningful comparison, we normalize each host application measurement to a baseline measurement taken on the server with no management workload interfering with it. Management application performance metric (m). This metric represents the progress of the management applications while they are running in conjunction with a host application. Similar to the host application performance metric, it consists of throughput and/or runtime measurements (i.e. runtime for a complete backup, files virus-scanned per second, number of components installed and so forth), and are similarly normalized to a baseline measurement. Combined system guarantees metric (G). Since our goal is to provide least disruption to the host applications while optimizing the management application output, we seek to integrate the above two axes - host performance and the management application performance metrics in a manner that optimizes the combination. Since h and m are both performance ratios, the natural operator to take both into account is a geometric mean. To favor the host application performance over the management application performance, we propose that the mean be weighted according to a hostmanagement balance coefficient b: 1
G = (hb ∗ m) (1+b) For b > 1, this equation implicitly and intentionally biases the combined metric towards the host application metric (h), but still returns a low value should the management application performance be severely compromised. Since h and m are normalized performance ratios, this metric is valid to evaluate measurements that would otherwise be incomparable (i.e. compare logs scanned per second to time to upgrade PHP). Also, note that in some cases, h and m may not be independent variables; for example, a closed loop solution wherein the management application uses feedback control
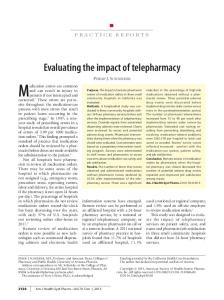
to improve host performance. Here, the more progress a management application makes, the better it will reflect on the host performance. Cost metric (C). This metric needs to take the combined effect of the hardware, software, and the human costs, both in terms of the capital and the operational expenses. For the evaluation in this paper, we have only considered hardware costs, and plan to include software and operational costs in future. The hardware cost can be measured in terms of the invoice price of adding extra hardware components, e.g., processor, memory, SMB board, as well the ongoing facilities cost such as extra power consumed and cooling expenses. Manageability Quotient (MaQ). While the guarantees metric (G) and the cost metric (C) capture critical aspects of a manageability system, what we really care about overall is to provide the maximum guarantees at the lowest cost. Accordingly, we propose MaQ as an integrated metric that captures both the guarantees and the cost attributes of a manageability system: 1 (hb ∗ m) (1+b) G = MaQ = C C In this way, the higher the value of MaQ for a given manageability system, the more favorable that configuration would be since it would provide lower disruption to host applications while optimizing the management application output (reflected in a higher value for G), at lower cost (reflected in a lower value for C). III. R ESULTS In order to evaluate the manageability metrics introduced in Section II, we have taken measurements of many host applications and management applications running in conjunction on exemplar solution platforms. Table I gives a summary of the manageability and host benchmarks, and the various manageability solution configurations used in our experiments. The data used in this study are plotted in 1,080 data points derived from over 4,600 discrete experiments which were collected on a continual basis from our benchmark systems over a period of several weeks. Host Application Performance (h):Figure 1(a) plots the performance of each host application when they are combined with each manageability application. The first row represents the BASELINE solution: the host and management application being run conjuctively on the same processor core. These results are quite volatile; in some cases, such as AV+WS (the security workload combined with the internet services workload), the host application experiences almost no degradation (h = .97). In other cases, such as LA+CP (the diagnostic workload combined with the file copy workload), the host application sees significant slowdown (h = .13) due to contention for the disk. The volatility of the results for the BASELINE solution succintly demonstrate the unfortunate consequence of combining workloads on a single system: the processes compete for resources, often at the unfair exclusion of each other’s forward progress. A typical system administrator, upon discovering that their host application performance was being adversely affected by
3
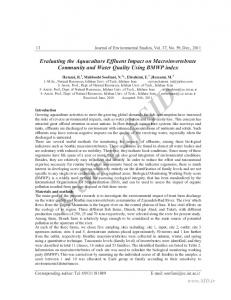
Category Provisioning Security Diagnostics Maintenance Maintenance —
(a) Manageability Benchmark Applications Application Benchmark Disk CPU Software apt-get X X Installation Virus scan ClamAV X X Log Analysis analog X Disk Indexing updatedb X X Disk Imaging dd X Microbenchmark while(1); X
(c) Manageability Solutions Type Manageability Configuration BASELINE — Share processor with host app. NICE S/W Reduced in prcoess priority THROTTLE S/W Reduced in performance CMP H/W Offloaded to second core SMP H/W Offloaded to second chip SAN H/W Offloaded to second system via SAN Name
Data set install gnome-core from Debian/4.0 164 MB file hierarchy 940MB access.log 506,776 files 1,198 MB image file
(d) Benchmark Legend Benchmark Abbr. Benchmark Provisioning PR Internet Services Security AV Business Apps. Diagnostics LA Compiling Disk Indexing IX Copying Disk Imaging IM Microbenchmark
Abbr. WS JB MK CP UB
Category Internet Services Business Applications Interactive Interactive —
(b) Host Application Web Serving 3-tier Java benchmark Compiling Copying Files Microbenchmark
(e) Parts List Part Cost Case $109.99 Memory $238.99 Disk $139.99 SCSI Card $141.99 Xeon Single-Core $186.00 Server Board $219.99 Xeon Dual-Core $523.99 SMP Server Board $350.99 Proliant DL145 $985.00
Benchmark Applications Benchmark Disk Apache 2.2.3 SPECjbb2000 make bzImage cp -a while(1);
X X
CPU X X X
Data set static page 1 warehouse Linux-2.6.17.8 source 1,198 MB directory tree
X
(f) Operational Cost Peak Power H/W Costop Power BASELINE 126 W $1213.95 CMP 137 W $1319.93 SMP 164 W $1580.06 SAN 126+100 W $2177.40
Solution
(g) Solution Total Cost Solution Cost BASELINE $2250.90 CMP $2694.87 SMP $3609.99 SAN $4199.35
TABLE I TABLES 1( A ) AND 1( B ) PRESENT THE APPLICATIONS STUDIED IN THIS PAPER . A CHECK IN THE D ISK COLUMN INDICATES THAT A BENCHMARK HAS SIGNIFICANT DISK UTILIZATION AND A CHECK IN THE CPU COLUMN INDICATES THAT A BENCHMARK HAS SIGNIFICANT CPU- BOUND PHASES . TABLE 1( C ) PRESENTS THE MANAGEABILITY SOLUTIONS STUDIED IN THIS PAPER . TABLE 1( D ) IS THE BENCHMARK LEGEND FOR S ECTION III. TABLE 1( E ) REPRESENTS THE PARTS L IST USED IN H/W CAPITAL EXPENDITURE COST MODEL , TABLE 1( F ) REPRESENTS THE OPERATIONAL EXPENDITURES AND 1( G ) REPESENTS THE TOTAL MANAGEABILITY SOLUTION H/W COST, INCLUDING CAPITAL AND OPERATIONAL EXPENDITURES .
(a) Host Application Performance (h)
(b) Manageability Application Performance (m)
(c) Combined Application Performance (G), b=2
(d) MaQ value, considering only hardware expenditures
Fig. 1. Each color patch in the figures above indicate the value of a performance metric (given by its chart’s caption) for a particular combination of host and management workloads, indicated by the x-axis (“Manageability Workload + Host Workload”), executed on a particular manageability solution, indicated by the y-axis. The key for the workloads on the x-axis is as given in Table I. Darker colors indicate poor performance while lighter colors indicate nominal performance (i.e. comparable to running a single workload on an otherwise idle system). Each chart presents 180 data points from 900 measurements.
their management applications, would likely be tempted to use the operating system’s process priority mechanism to enforce a performance isolation guarantee; this scenario is shown in the NICE solution. The h data for this solution clearly show the allure of manipulating process priority; the volatility seen in the BASELINE solution is almost entirely eliminated. To a lesser degree, the THROTTLE solution also mitigates the volatility of the BASELINE solution. Finally, the remaining h results demonstrate that offloading the manageability application to another core (CMP solution), chip (SMP solution), or system (SAN solution) all significantly provide improvement to the host application’s performance. That being said, the rare instances of slowdown in the SAN solution (e.g. IM+CP) compared to the BASELINE solution merit additional discussion. Since the SAN solution
involves a second host and operating system competing for a shared disk, we hypothesize that the slowdown is due to poor aggregate block I/O scheduling since neither system has complete information about the requests being issued to the disk. We have additionally experimented with a cooperative block I/O scheduler we developed that seems to mitigate this effect, though we omit those results in this paper for brevity. Management Application Performance (m): Figure 1(b) plots the results of each manageability application when they are combined with each host application. Again, the BASELINE solution shows volatile sensitivity when workloads are combined. Not unexpectedly, in many of the instances where host performance was poor (e.g. LA+CP), manageability performance is reasonably high (m = .74). The converse is also true (e.g. see AV+WS). It is also interesting to note that
4
good performance is not always mutually exclusive between h and m. For example, in the Business Applications and Disk Imaging workload pair (IM+JB), both the host and management application maintain nominal performance. This is because these two workloads share few resources; the Disk Imaging benchmark spends the majority of its time waiting for disk I/O, and the Business Applications benchmark spends all of its time in user code. While the BASELINE results for m are relatively comparable to h, the NICE solution results stand in stark contrast. Now confronted with the m results, it is obvious that the large improvement in h when employing the NICE solution came at the cost of catastrophic degradation in performance of the victimized manageability application. This result is repeated to a small degree with the THROTTLE solution, but the trade-off is far more equitable. This is because during the periods that the throttled application is not sleeping, it is allowed normal scheduling priority. Like the h results, the m chart shows significant improvement in manageability application performance when it is offloaded to another core, chip, or system. It is none-theless interesting to note that there is still a fairly significant performance degradation when a management application is combined with the host File Copying workload. Despite not sharing computational resources, the workloads still experience resource contention since they share a common disk, and this is reflected in the chart. Combined Performance (G): Now having explored the pitfalls of individual application performance metrics, the G results plotted in Figure 1(c) paint a more holistic view of system performance. This particular chart is plotted assuming b=2 (host application performance is valued more than management application performance). In the BASELINE solution, we see a consistent degradation across most workload pairs. This empirically confirms the earlier observation that typically at least one of the host or manageability workload is adversely affected by resource contention. In considering the NICE solution, the combined performance results show that the improvement in host application performance is ultimately not worth the severe degradation in manageability application performance. Rather, it indicates that even the original BASELINE solution is preferable to the NICE solution, since it does not starve the management applications. With respect to the offloading solutions (CMP, SMP, and SAN), the combined performance still indicates a significant performance boost over the BASELINE solution. Overall, the NICE and THROTTLE combined performance results show that software measures alone may be insufficient to mitigate the performance degradation of combining host applications and management applications; this is an obvious observation, and a reasonable benchmark conclusion of our combined metric. The combined performance allows for quantitative comparison of the different software-based solutions, enabling the study of the trade-offs thereof. Lastly, the combined performance metric unequivocably prefers solutions that truly offer higher aggregate performance, like the offload solutions. It is immune to red herring results, like the NICE solution’s results, since it takes performance of both the host
and manageability application into account. Hardware Costs: The combined performance metrics have so far elucidated architectural configurations that exhibit desirable behavior when combining host and management workloads. Not surprisingly, they suggest that the best performance can be achieved when offloading the management applications to a separate high-performance processor core. While this is a useful result when comparing the absolute affinity of a system for manageability performance, combining the preceding performance results with the cost of the system allows for a more prudent comparison. Figure 1(d) depicts results for the combined performance value divided by the capital and operating costs of the hardware on which it is measured. Capital expenditure consists merely of the parts to build each manageability solution, the parts list of which we present in Table I(e). We estimate operational expenditures by considering power consumption and cooling costs integrated over a 3-year time period using Equation 3.14 from [5]. Cost = (1 + K1 + L1 + K2 L1 )U$,grid Pconsumed Where K1 = 1.33 is the burdened power delivery factor, L1 = 0.8 is the cooling load factor, K2 = 0.667 is the burdened cooling cost factor, U$,grid is estimated as $100/M W h, and Pconsumed is a function of the solution being tested. Table I(f) shows the power consumption we measured on our benchmark systems, and the calculated associated 3-year operational cost. Table I(g) shows the total solution cost, including capital and operational expenditures. From the results, we can see that the BASELINE, NICE, and THROTTLE results are unchanged from the performance results. Since these all represent software solutions of the same hardware, the cost equation remains constant. When cost is taken into consideration, the actual differences between the CMP, SMP, and OFFLOAD solutions becomes clear: while each provides nearly ideal performance, they each entail very different hardware costs. For instance, the CMP system requires relatively little hardware cost over that of the BASELINE, while the SMP system entails much higher capital expenditure as well as far increased power consumption. While they provide nearly identical performance guarantees, the unified metric suggests that the CMP system is preferred. The SAN system is shown to be even less desirable, owing to it requiring the purchase of an entirely separate system and even more power consumption. Only in the event that this SAN-connected manageability system could be shared by several host systems, and its cost thus amortized, would it be a prudent manageability solution to pursue. Otherwise, the MaQ suggests that even the BASELINE solution is preferable to the SAN solution, regardless of the higher performance of the SAN solution. Overall, taking into account hardware costs suggests that the CMP solution, which entails only a marginal increase in cost for a significant increase in host and management application performance, is a well-balanced hardware platform for manageability applications. This trend is likely to continue as CMPs grow to contain more cores, ultimately to the point
5
that the potential loss in host performance by sacrificing a core for manageability applications is minimal. IV. C ONCLUSIONS In this paper, we proposed metrics to evaluate elements of manageability effectiveness – the guarantees and functionality of the actual manageability solution, its interaction (and potential interference) with the host application, and its benefits and tradeoffs from a cost perspective. We also build a host of different manageability solutions and platforms and perform a detailed evaluation. Our results show the benefits from having a single metric to compare different solutions and highlight how a unified metric can help identify insights often missed in conventional metrics. Going forward, we are working towards improving the metric definition further, we are developing appropriate software and human cost models, and we would be conducting further experiments with more application workloads and management applications. We would also experiment with combination of multiple management applications running at the same time mimicing real-world scenarios. R EFERENCES [1] A. B. Brown and et. al. A Model of Configuration Complexity and its application to a Change Management System. In IM, May 2005. [2] Gartner. TCO Reports. 2005-present. [3] HP. Integrated Lights Out. http://www.hp.com/go/ilo. [4] Intel. Active Management Technology. http://www.intel.com/go/iamt. [5] C. Patel and A. Shah. Cost model for planning, development and operation of a data center. Technical Report HPL-2005-107, HP Labs. [6] V. Talwar, Q. Wu, C. Pu, W. Yan, G. Jung, and D. Milojicic. Comparison of Approaches to Service Deployment. In ICDCS, 2005.