Hindawi Advances in Meteorology Volume 2018, Article ID 1217830, 7 pages https://doi.org/10.1155/2018/1217830
Research Article Evaluating Linkages between Atmospheric Blocking Patterns and Heavy Rainfall Events across the North-Central Mississippi River Valley for Different ENSO Phases Jordan L. Rabinowitz ,1 Anthony R. Lupo,1,2 and Patrick E. Guinan3 1
Atmospheric Sciences Program, School of Natural Resources, University of Missouri, Columbia, MO, USA Department of Natural Resources Management and Land Cadastre, Belgorod State University, Belgorod 308015, Russia 3 Missouri Climate Center, College of Agriculture, Food, and Natural Resources, University of Missouri, Columbia, MO 65211, USA 2
Correspondence should be addressed to Jordan L. Rabinowitz;
[email protected] Received 29 August 2017; Accepted 15 January 2018; Published 11 March 2018 Academic Editor: Tomeu Rigo Copyright © 2018 Jordan L. Rabinowitz et al. This is an open access article distributed under the Creative Commons Attribution License, which permits unrestricted use, distribution, and reproduction in any medium, provided the original work is properly cited. Over the last six to seven decades, there has been a substantial increase in atmospheric research to better understand the dynamics and evolution of atmospheric blocking events. It is well known that atmospheric blocking serves as a catalyst for increasing the frequency of atmospheric flow regime stagnation and forecast unpredictability. This study built upon the results of previous work by expanding upon the findings of various climatologies and case studies. This work analyzes specific trends observed in association with atmospheric blocking predominantly across the central and eastern Pacific Ocean. Such trends include the relationship between the size, duration, and onset position of atmospheric blocking events and the frequency, duration, and intensity of heavy rainfall events across the central United States. A strong focus is placed on examining the duration and spatial extent of atmospheric blocking which has been found to influence the intensity of heavy rainfall events. The goal is to further bridge the gap between the location and duration of blocking highs and the intensity, duration, and frequency of heavy rainfall events which occur downstream of such blocking events.
1. Introduction Since the onset of the remote sensing era, there have been many advances in the analysis and forecasting of atmospheric blocking which is known to have a noticeable influence on the occurrence frequency and evolution of high-impact weather events such as cold waves [1] or the Russian heat wave of 2010 [2–4]. Over the past five to six decades, much research has been conducted in order to gain an understanding of the dynamics that contribute evolution of atmospheric blocking events. The work of [5] began this research by working to understand the climatological behavior of blocking and speculated that atmospheric blocking events and their dynamics may be likened to a mechanical analogue. Then researchers such as [6, 7] further elaborated upon the work of Rex (1950) through elaborating upon how atmospheric blocking events are generated through the interaction of transient, synopticscale perturbations with the planetary-scale environment.
In this context, blocking may be understood as resonance between the planetary waves to synoptic-scale perturbations (e.g., [7]) which act as sources of energy and vorticity. These studies and others showed that the nature of a given atmospheric blocking response may often depend on the location of the synoptic-scale perturbation relative to the planetary waves. Studies of flow regime dynamics such as [8–11] found evidence for multiple persistent flow regimes in the Northern Hemisphere flow including regimes that represent blocking flows [8]. These studies describe only the mean structure of blocking, and others (e.g., [12]) described blocking as a soliton. Such studies, however, could not describe the evolution of blocking. Then [13] constructed a soliton model that described the evolution of blocking as a scale-interaction problem as described above. Further, [14, 15] used an analytic channel-type model to explore the phase transitions of a
2
Advances in Meteorology The predominant issue has been the ability (or lack thereof) of operational forecasters to accurately anticipate the onset and decay of atmospheric blocking events [3]. Through garnering an improved understanding of the link between atmospheric blocking and heavy rainfall events in our region, the atmospheric research community will be able to generate a more efficient “roadmap” for improving the anticipation of heavy rain events.
2. Data and Methodology
Figure 1: A map of the study region. The approximate region is outlined with the thick line.
North Atlantic Oscillation- (NAO-) like pattern. They impose a low-frequency planetary-scale wave with a period of about two to three weeks on a zonal flow as well as a synopticscale perturbation of about three days in length to describe the transitions between the positive and negative phases of the NAO and the presence and role of blocking in these transitions. The model was extended by [16] to demonstrate the interactions among the mean flow, planetary waves, and synoptic eddies and proposed a new mechanism to explain the onset or destruction of blocking regimes. In addition to studies that examined the synoptic and dynamic behavior of atmospheric blocking, investigators have related blocking to the weather and climate of regions within and adjacent to these events. For example, [13] built a relationship between large-scale temperature regimes across entire oceanic basins, the prevalence of atmospheric blocking events just to the south of Alaska, and the downstream impacts of such blocking events on precipitation frequency and intensity across the central and eastern United States. A few studies have examined the relationship of blocking to the seasonal character of weather, such as temperature and precipitation amounts, across the central United States [14– 16]. This work more closely investigates how different preblocking factors affect the spatial extent and intensity of heavy rainfall events across the region of concern. For this work, the study region is the North-Central Mississippi River Valley (Figure 1) and the period examined was between 1 January 2000 to 31 December 2015. This work is unique in that it will examine the character and impact of individual heavy rainfall events across the North-Central Mississippi River Valley and relate these to the climatological character of blocking (e.g., frequency, duration, and intensity) in the Pacific Ocean Basin. This study will also examine the linkage between interannual variability as related to El Nino and Southern Oscillation (ENSO) for heavy rainfall and blocking. Previous studies of heavy snowfall and the connection to large-scale flow regimes and well as interannual variability have been done for this region [18]. Lastly, the onset and occurrence of atmospheric blocking continue to present major forecasting problems [3].
2.1. Data. The data used in this analysis for blocking are archived at the University of Missouri and may be accessed online [20]. The data integrated into this study from this blocking archive included the following parameters: block intensity (BI), block duration (BD), block size (BS), blocking onset lead-time (BOLT), and longitude at block onset (LABO). Other indexes that describe blocking character such as those derived by [21, 22] could be used here. However, the dataset used here was readily available and has been used in many studies by this research group. A comparison of these indexes is beyond the scope of this study. The block intensity (BI) parameter was developed and later modified for automated use by [17]. Briefly, BI normalizes the central height value of a block (MZ) by the gradient of the height field surrounding the event (RC) [17] and averaged over the block lifetime. The calculation of BI was represented by the following equation: BI = 100 ∗ ((
MZ ) − 1) . RC
(1)
Additionally, recent study [23] demonstrated that BI can be related to dynamic quantities such as enstrophy and entropy and thus related to flow regime stability and predictability. The block duration (BD) parameter was included via the criteria first established by [5, 22] and modified, whereby a blocking event is verifiable only if a blocking high pressure persists for a minimum of five days as evaluated by flow at the 500 mb level. The intent behind evaluating BD is to study observed differences between the respective ENSO phases and the persistence of the blocking events formed between 2000 and 2014. This BD analysis is an extension of previous work (e.g., [17]). The block size (BS) parameter was included based on a framework wherein they designated the BS value as the half-wavelength distance (measured in units of km). The BS parameter was included to assess if a relationship existed between BS and event rainfall duration. The analysis related to the BS parameter expands on pertinent results from previous work [13]. The blocking onset lead-time (BOLT) parameter is a newly coined parameter used to distinguish blocking events which had an association between block onset and the occurrence of heavy rain. The definition for the BOLT parameter is such that only blocking events existing for at least two days prior to the day of a heavy rainfall event are considered. Another important parameter was the “longitude at block onset” (LABO) parameter which was used to assess possible relationships between the location of blocking events (i.e., the longitudinal position within the Pacific Ocean where
Advances in Meteorology
3
Table 1: List of ENSO years 2000–2015: see [19] for definition; ENSO year begins 1 October of the given year. Neutral 2000-2001 2003–2005 2008 2011–2013
La Nina 1999 2007 2010
blocking events were centered) and the duration/intensity of rainfall events. For the LABO parameter, the Pacific Ocean was divided into four regions to differentiate between the various blocking events. These four regions were designated as the eastern Pacific Ocean (between 120∘ W and 140∘ W), the east central Pacific Ocean (which between 140∘ W and 180∘ W), the west central Pacific Ocean (between 160∘ E and 180∘ E), and the western Pacific Ocean (between 140∘ E and 160∘ E). Finally, each heavy rainfall event that occurred concurrently with a Pacific Ocean blocking event is referenced throughout the following text as an event during a given ENSO phase whether they occurred with the same blocking event or not. Also, the distribution of the respective ENSO phases is shown in Table 1, and ENSO is defined using the Japanese Meteorological Agency (JMA) criterion [19]. This definition has been used by many studies of interannual variability in the broader region (e.g., [15] and references therein) and will facilitate comparing these results with those studies. Furthermore, any heavy rainfall event which was considered to be admissible for this study had to be a minimum 24-hour rainfall threshold of 50.8 mm (2.00 inches) or more at the Saint Louis Weather Service Forecast Office (STL WFO). This definition is consistent with that used by [24].
3. Characteristics of Atmospheric Blocking: Implications for Downstream Flow Regimes 3.1. Overall Climatology: Heavy Rain Events Associated with Blocking. All 16 events are listed in Table 2. Of these, nine are summer season events, three events occurred during both the winter and spring, and only one was a fall season event. There was no statistically significant relationship between BI, BD, BS, or any of these variables and rainfall amounts. This is likely due to the small sample size since there was a statistically significant relationship between the respective variables and rainfall amounts. Additionally, while [9, 17] found that there were more winter season blocking events than summer season events within the Pacific Ocean Basin, it was the summer season, which resulted in more blocking events associated with heavy rain since the summer season is the associated with the largest number of heavy rain events. Also, winter season events were generally stronger, while summer events were comparatively weak within the region as found by [17]. An analysis of the synoptic maps demonstrated that the heavy rain events were associated with synoptic-scale
L
El Nino 2002 2006 2009 2014-2015
H
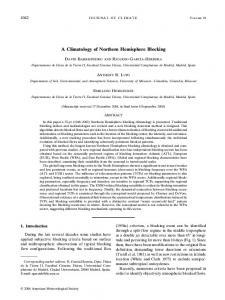
Figure 2: The Northern Hemisphere 500 hPa heights (m) for 16–24 November 2010 contoured every 60 m. The location of the block is noted with an H and the location of the surface feature associated with the heavy rain event of 24 November 2010 is marked with L. The black arrows represent the 300 hPa jet maximum for 24 November 2010.
transients, and the jet stream was strong over the central United States (not shown). Figure 2 shows an example for the 24 November 2010 heavy rain event (Event #15 in Table 2). There was no preference for the surface feature to be located west or east of the region, or the attendant surface fronts to be warm, cold, or a stationary front. 3.2. ENSO Related Interannual Variability. There were five El Nino events which occurred during the study period, and only two of these El Nino years were associated with four heavy rain events associated with a blocking event (Table 2). Each of these events was summer season events, and these events were stronger and more persistent than the typical summer season event. The mean BI was 2.39 and the standard deviation was 0.95. The mean for these four events was slightly stronger than the typical summer season Pacific Region blocking events found by [17] (BI = 2.11). The BD for these events was 13 days, the BS was 2078 km (standard deviation = 340 km), and the BOLT was 6 days. The onset location for each of these blocking events associated with heavy rain; three of these events were positioned across the east Pacific Ocean (i.e., with a blocking onset longitude of 150∘ W (two locking events) and 130∘ W). The last remaining El Nino event was located in the west Pacific Ocean (i.e., with a blocking onset longitude of 130∘ E). There were only three La Nina events, which occurred between the years 2000–2015, and all three years were associated with at least two blocking events that featured heavy rain in our region (Table 2, seven total). These seven heavy rain events were found among all seasons of the year. The mean
4
Advances in Meteorology
Table 2: Breakdown of analyzed heavy rain events associated with atmospheric blocking included blocking parameters are the block intensity [17], block duration, and block size. The event number, date (dd mm yy), season (W, Sp, Su, and F), and ENSO phase are shown in column one (E is El Nino, L is La Nina, and N is Neutral).
3.3. Discussion. When examining the block intensity, it was clear that only the El Nino year blocking events were stronger than their respective sample when compared to a similar
Size 1712 2658 1470 2614 1812 1812 2151 2658 2983 3765 2166 1538 1189 1908 2827 3003
Onset location 150∘ W 175∘ E 130∘ W 160∘ W 150∘ W 150∘ W 130∘ W 150∘ W 140∘ E 140∘ E 130∘ E 170∘ E 170∘ E 150∘ W 180∘ 140∘ E
Wiedenmann block intensity breakdown 5 4.5 4 3.5 3 2.5 2 1.5 1 0.5 0
84.08
78.23
74.68
71.12
68.07
68.07
62.48
59.94
56.9
57.15
55.88
55.63
55.37
53.85
y = 0.0305x + 2.5293
53.09
BI was 2.99 and an associated standard deviation of 1.06, and these values were very close to the 30-year climatological values for each quantity [17], and the individual events were above their respective Pacific Region seasonal mean as often as they were below the season mean. The mean BD was 12 days and the mean BS was 2119 km (standard deviation = 705 km), while the BOLT was 6.5 days. Among the seven La Nina heavy rain event that occurred concurrently with a Pacific blocking event, four of the events occurred with blocking events positioned across the west central Pacific Ocean, and one more over the west Pacific. Of the two remaining La Nina events occurred with blocking events positioned across the eastern Pacific Ocean. The greater number of La Nina year blocking found to be associated with heavy rain agrees with [17] and references therein, who found that in the Pacific Region blocking was more frequent and stronger. Lastly, there were nine Neutral years during the study period, but only three of these years were associated with heavy rain events that featured a Pacific Region blocking event. There were five of these heavy rain events in total, occurring over most seasons. Among those five events, the mean BI was 2.53 and the standard deviation was 1.18. The mean BD was only eight days and the BS was 2698 km (standard deviation = 805 km), while the BOLT was only 4 days. Among the five Neutral year heavy rain events that occurred in association with a Pacific blocking event, two of the five events occurred with a blocking event positioned across the eastern Pacific Ocean, and one was located over the east central Pacific Ocean Basin. Only two of the five Neutral year events occurred with blocking events positioned across the west Pacific Ocean.
Duration 12 14 9 8 18.5 18.5 11 9.5 5 9.5 7.5 10.5 13 14.5 8 11.5
51.31
Intensity 4.22 1.47 2.45 2.43 3.2 3.2 3.2 4.51 1.49 1.77 1.75 2.68 3.68 2.78 4.14 1.99
Wiedenmann block intensity
Event number (1) 18 02 00 L W (2) 24 06 00 L Su (3) 12 05 02 N Sp (4) 06 08 02 N Su (5) 10 06 03 E Su (6) 12 06 03 E Su (7) 26 06 03 E Su (8) 04 01 04 N W (9) 30 07 04 N Su (10) 11 06 05 N Su (11) 19 07 07 E Su (12) 05 02 08 L W (13) 18 03 08 L Sp (14) 26 05 08 L Sp (15) 24 11 10 L F (16) 25 06 11 L Su
Event rainfall totals (mm)
Figure 3: Bar plot of the block intensity [17] for all 16 analyzed blocking events with event rainfall totals (measured in millimeters) and block intensity.
seasonal and regional sample from [17]. The Neutral season events were the weakest and of the shortest duration and had the lowest BOLT parameter. Examining the correlation coefficient between BI and event rainfall total indicated there was only a slight positive relation (CC = 0.11), but not statistically supported at standard levels of confidence (Figure 3). The events in Figure 3 were reordered for the purpose of organizing the event rainfall totals from lowestto-highest in order to demonstrate the relationship. Additionally, the average heavy rainfall event totals from highest to lowest were 65.53 mm (La Nina events), 64.77 mm (El Nino events), and 57.56 mm (Neutral-ENSO events). This relationship between heavy rain totals and BI did not mirror precisely the decreasing order of BI for the respective ENSO phases. This reflects the variability among the BI values (e.g.,
84.08
78.23
74.68
71.12
68.07
68.07
62.48
59.94
56.9
57.15
55.88
55.63
55.37
53.09
51.31
53.85
Blocking onset lead time (BOLT) breakdown
10 9 8 7 6 5 4 3 2 1 0
Event rainfall totals (mm)
Figure 4: Bar plot of block onset lead times for all 16 analyzed blocking events with event rainfall totals (measured in millimeters) and number of days.
−140
Longitudinal position for blocking events in the central Pacific Ocean 53.09
55.63
55.88
56.9
59.94
68.07
68.07
84.08
−145 Longitude (∘ )
[25]). However, a closer inspection of BI values versus the heavy rainfall event totals indicated a possible relationship since the Neutral year BI values were weakest when compared to the relevant sample from [17], and the higher standard deviation likely reflects the small sample size and the fact these occurred in all seasons. One heavy rain-blocking event was identified as an anomaly (4 January 2004 event) which was the strongest event in the study (i.e., a BI value of 4.52 compared to the Neutral-ENSO blocking event BI average of 2.53). However, this event was a winter season event. Through evaluating the statistical results above, it is evident that block intensity may not be a reliable parameter for use in medium-range forecasting. The fact that a smaller BI value during Neutral years correlated with smaller heavy rainfall totals indicated that there may be a connection between these variables as found for seasonal precipitation and blocking [14, 15]. In order to ascertain whether there is a correlation between block intensities, it is imperative to study many more events in this (and other regions to further expand these findings) for this parameter to be more valuable in operational forecasting. When examining the BD parameter, the duration of El Nino and La Nina year blocking events associated with heavy rain persisted longer than their climatological counterparts, while the Neutral year blocking events persistence of eight days is similar to Pacific Region block persistence [17] (Table 2). The BS parameter demonstrated that the Neutral year events were larger than the La Nina and El Nino year events, which were of similar size. Thus, the lack of a relationship here is not surprising. Also, recall that the lowest mean value for heavy rainfall events was associated with Neutral year events. However, this inverse relationship is not statistically significant. During Neutral years, the lowest average event rainfall totals correlating with the lowest BD values was surprising since three of the five events had a tropical origin. Since tropical cyclones (TCs) are often steered by large-scale deep-layer atmospheric flow, TCs are sensitive to upstream blocking events ([13, 26, 27]). TCs positioned near blocking events are often affected in terms of both trajectory and the water vapor transport by TCs towards the US mainland [28]. The BOLT parameter was developed here and is similar to the findings of [29], and the mean BOLT values for all cases were about 5.5 days. The results for this parameter mirrored those of BD outcome in that El Nino and La Nina had the longest BD and BOLT and were associated with heavier rainfall events, while the Neutral year events had the shortest values and the lowest associated precipitation. In order to study the BOLT parameter from a different angle, a column plot was generated with the increasing event rainfall totals plotted on the abscissa and the BOLT values on the ordinate (Figure 4). Among the sixteen heavy rainfall events that occurred concurrently with Pacific blocking events, there was no seasonal preference for the occurrence of larger versus smaller BOLT values. When examining the LABO, it is important to note that, during La Nina years, there was a stronger preference for blocking events associated with heavy rain occurring west of the International Dateline (180∘ ). For El Nino years the
5
(Days)
Advances in Meteorology
−150 −155 −160 −165 −170 −175
Event rainfall totals (mm)
Figure 5: Bar plot of blocking events across the central Pacific Ocean with event rainfall totals (measured in millimeters) and longitudinal position (∘ west or east).
opposite was true, and for ENSO Neutral years, there was no preference (Figures 5–7). Supplemental analysis of those blocking events which developed across the central Pacific Ocean (via a clustered column plot) illustrated an increasing trend in event rainfall totals as the position of the blocking events moved from east to west across the central Pacific Ocean (Figure 5). A plausible explanation is that, by going further west across the central Pacific Ocean, there was a larger fetch over which warm, moist tropical air could accumulate before being transported downstream ([21, 30, 31]) or from the Gulf of Mexico via the atmospheric rivers (“Maya Express”) [32].
4. Summary and Conclusions In this study, sixteen heavy rainfall events that were associated Pacific Region blocking were studied here during the period 2000–2015. The Pacific Region blocking data were provided by the archive at the University of Missouri, which contains the character of all Northern Hemisphere blocking events, which have occurred since 1 January 2000. The rainfall data for this study were provided by the STL WFO, and the study region was the North-Central Mississippi River Basin.
Advances in Meteorology
Event rainfall totals (mm) and longitude (∘ )
6
200 180 160 140 120 100 80 60 40 20 0
Longitudinal position for blocking events in the eastern western Pacific Ocean
1
2
3
Event rainfall total (mm) Longitudinal position (∘ )
Figure 6: Bar plot of blocking events across the eastern-portion of the western Pacific Ocean with event rainfall totals (measured in millimeters and denoted by the blue bars) and longitudinal position (∘ west or east and denoted by the orange bars).
Longitude (∘ )
Longitudinal position for blocking events in the central western Pacific Ocean 152 150 148 146 144 142 140 138 136 134 51.31
53.85 57.15 Event rainfall totals (mm)
71.12
Figure 7: Bar plot of analyzed blocking events across the centralportion of the western Pacific Ocean with event rainfall totals (measured in millimeters) and longitudinal position (∘ west or east).
Among the various blocking parameters evaluated in this study, there were several pertinent findings that emerged. All La Nina years were associated with two or more blocking events that were accompanied by heavy rainfall. This is significant since [17] showed that only seven blocking events per year occurred within the Pacific Ocean Basin. Such occurrences were comparatively rare during El Nino or Neutral years; however, some of these years were associated with multiple occurrences. Many researchers showed that the Pacific Ocean Basin was more active in terms of blocking activity [24] and references therein during La Nina years, and this is associated with a more active storm track (e.g., [16, 17]). Thus, the greater number of blocking events associated with heavy rain in the central USA is consistent with the idea that there are more opportunities for simultaneous occurrence of each. Although there was a low positive correlation that was not statistically significant, there was a tendency for larger BI values to be correlated with heavier rainfall event totals. However, only El Nino year blocking events (associated with heavy precipitation) were stronger than their comparative
sample. Also, La Nina and El Nino years tended to be associated with longer-lived events and a longer period between block onset and the heavy rain (BOLT). Another major finding was found in association with the longitude at block onset (LABO) parameter. Throughout the LABO parameter data, there was a consistent trend defined by blocking events forming further west in the Pacific Ocean being correlated with heavier rainfall totals. It is hypothesized that with the further westward positioning of blocking high pressure systems, this favored stronger transport of warm, moist air into the region of concern (i.e., chiefly via “Maya Express” atmospheric rivers emanating from the Gulf of Mexico and/or western/central Caribbean). Finally, the results indicated that there is still much work to be done to better understand blocking dynamics and the connection to heavy rainfalls in the central USA. Additionally, a longer study period might provide more insight into the mechanisms responsible for these connections and provide guidance for forecasters in this region.
Conflicts of Interest There were no conflicts of interest tied to this paper whatsoever in any capacity.
Acknowledgments This work was partially funded by USDA Grant, “Rainfall Rates in North-Central Missouri’s LTAR.”
References [1] J. Sillmann, C.-M. Mischa, M. Kallache, and R. W. Katz, “Extreme cold winter temperatures in Europe under the influence of North Atlantic atmospheric blocking,” Journal of Climate, vol. 24, no. 22, pp. 5899–5913, 2011. [2] R. Dole, M. Hoerling, J. Perlwitz et al., “Was there a basis for anticipating the 2010 Russian heat wave?” Geophysical Research Letters, vol. 38, no. 6, Article ID L06702, 2011.
Advances in Meteorology [3] M. Matsueda, “Predictability of Euro-Russian blocking in summer of 2010,” Geophysical Research Letters, vol. 38, no. 6, Article ID L06801, 2011. [4] I. I. Mokhov, “Specific features of the 2010 summer heat formation in the European territory of Russia in the context of general climate changes and climate anomalies,” Izvestiya Atmospheric and Ocean Physics, vol. 47, no. 6, pp. 653–660, 2011. [5] D. F. Rex, “Blocking action in the middle troposphere and its effect upon regional climate,” Tellus, vol. 2, no. 4, pp. 275–301, 1950. [6] S. J. Colucci, “Explosive cyclogenesis and large-scale circulation changes: implications for atmospheric blocking,” Journal of the Atmospheric Sciences, vol. 42, no. 24, pp. 2701–2717, 1985. [7] J. P. Burkhardt and A. R. Lupo, “The planetary- and synopticscale interactions in a southeast Pacific blocking episode using PV diagnostics,” Journal of the Atmospheric Sciences, vol. 62, no. 6, pp. 1901–1916, 1985. [8] J. G. Charney and J. G. Devore, “Multiple flow equilibria in the atmosphere and blocking,” Journal of the Atmospheric Sciences, vol. 36, no. 7, pp. 1205–1216, 1979. [9] K. Mo and M. Ghil, “Cluster analysis of multiple planetary flow regimes,” Journal of Geophysical Research: Atmospheres, vol. 93, pp. 10927–10952, 1988. [10] F. Molteni, S. Tibaldi, and T. N. Palmer, “Regimes in the wintertime circulation over northern extratropics. I: Observational evidence,” Quarterly Journal of the Royal Meteorological Society, vol. 116, no. 491, pp. 31–67, 1990. [11] P. Smyth, K. Ide, and M. Ghil, “Multiple regimes in northern hemisphere height fields via mixture model clustering,” Journal of the Atmospheric Sciences, vol. 56, no. 21, pp. 3704–3723, 1999. [12] J. C. McWilliams, “An application of equivalent modons to atmospheric blocking,” Dynamics of Atmospheres and Oceans, vol. 5, no. 1, pp. 43–66, 1980. [13] M. L. Carrera, R. W. Higgins, and V. E. Kousky, “Downstream weather impacts associated with atmospheric blocking over the Northeast Pacific,” Journal of Climate, vol. 17, no. 24, pp. 4823– 4839, 2004. [14] A. R. Lupo, E. P. Kelsey, D. K. Weitlich, N. A. Davis, and P. S. Market, “Using the monthly classification of global SSTs and 500 hPa height anomalies to predict temperature and precipitation regimes one to two seasons in advance for the mid-Mississippi region,” National Weather Digest, vol. 32, no. 1, pp. 11–33, 2008. [15] R. G. Newberry, A. R. Lupo, A. D. Jensen, and R. A. Zalipynis, “An analysis of the spring-to-summer transition in the west central plains for application to long range forecasting,” Atmospheric and Climate Sciences, vol. 6, no. 3, pp. 375–393, 2016. [16] J. S. Renken, J. J. Herman, T. R. Bradshaw, P. S. Market, and A. R. Lupo, “The utility of the bering sea and east asia rules in longrange forecasting,” Advances in Meteorology, vol. 2017, Article ID 1765428, pp. 1–14, 2017. [17] J. M. Wiedenmann, A. R. Lupo, I. I. Mokhov, and E. A. Tikhonova, “The climatology of blocking anticyclones for the Northern and Southern Hemispheres: block intensity as a diagnostic,” Journal of Climate, vol. 15, no. 23, pp. 3459–3473, 2002. [18] C. L. Berger, A. R. Lupo, P. Browning, M. Bodner, M. D. Chambers, and C. C. Rayburn, “A climatology of northwest Missouri snowfall events: long-term trends and interannual variability,” Physical Geography, vol. 23, no. 6, pp. 427–448, 2003. [19] Center for Ocean and Atmosphere Prediction Studies (COAPS), 2017, http://coaps.fsu.edu.
7 [20] University of Missouri Blocking Archive, 2017, http://weather .missouri.edu/gcc. [21] P. Davini, C. Cagnazzo, S. Gualdi, and A. Navarra, “Bidimensional diagnostics, variability, and trends of northern hemisphere blocking,” Journal of Climate, vol. 25, no. 19, pp. 6496– 6509, 2012. [22] H. Lejenas and H. Okland, “Characteristics of Northern Hemisphere blocking as determined from a long time series of observational data,” Tellus A: Dynamic Meteorology and Oceanography, vol. 35, no. 5, pp. 350–362, 1983. [23] A. Jensen, A. Lupo, I. Mokhov, M. Akperov, and D. Reynolds, “Integrated regional enstrophy and block intensity as a measure of kolmogorov entropy,” Atmosphere, vol. 8, no. 12, p. 237, 2017. [24] J. S. Kastman, P. S. Market, S. M. Rochette, and A. R. Lupo, “Assessing upper tropospheric jet streak proximity using the rossby radius of deformation,” Atmosphere, vol. 8, no. 1, article no. 2, 2017. [25] T.-W. Park, Y. Deng, W. Li, S. Yang, and M. Cai, “Mass footprints of the north pacific atmospheric blocking highs,” Journal of Climate, vol. 28, no. 12, pp. 4941–4949, 2015. [26] E. Atallah, L. F. Bosart, and A. R. Aiyyer, “Precipitation distribution associated with landfalling tropical cyclones over the eastern United States,” Monthly Weather Review, vol. 135, no. 6, pp. 2185–2206, 2007. [27] T. J. Galarneau Jr., L. F. Bosart, and R. S. Schumacher, “Predecessor rain events ahead of tropical cyclones,” Monthly Weather Review, vol. 138, no. 8, pp. 3272–3297, 2010. [28] S.-Y. Wang and T.-C. Chen, “The late-spring maximum of rainfall over the U.S. central plains and the role of the low-level jet,” Journal of Climate, vol. 22, no. 17, pp. 4696–4709, 2009. [29] J. L. Pelly and B. J. Hoskins, “A new perspective on blocking,” Journal of the Atmospheric Sciences, vol. 60, no. 5, pp. 743–755, 2003. [30] R. L. Molinari, “Air mass modification over the eastern Gulf of Mexico as a function of surface wind fields and loop current position,” Monthly Weather Review, vol. 115, no. 3, pp. 646–652, 1986. [31] A. Donohoe, J. Marshall, D. Ferreira, and D. Mcgee, “The relationship between ITCZ location and cross-equatorial atmospheric heat transport: From the seasonal cycle to the last glacial maximum,” Journal of Climate, vol. 26, no. 11, pp. 3597–3618, 2013. [32] J. L. Rabinowitz, A. R. Lupo, P. S. Market, and P. E. Guinan, “The relationship between Atmospheric Rivers, HYSPLIT backward trajectories, upper-air soundings and heavy rainfall events in the North-Central Mississippi River Valley. Under Revision,” Hyrdological Processes, December 2017.
Journal of
International Journal of
Ecology
Journal of
Geochemistry Hindawi Publishing Corporation http://www.hindawi.com
Mining
The Scientific World Journal
Scientifica Volume 2014
Hindawi Publishing Corporation http://www.hindawi.com
Volume 2014
Hindawi Publishing Corporation http://www.hindawi.com
Volume 2014
Hindawi Publishing Corporation http://www.hindawi.com
Volume 2014
Journal of
Earthquakes Hindawi Publishing Corporation http://www.hindawi.com
Hindawi Publishing Corporation http://www.hindawi.com
Volume 2014
Paleontology Journal Hindawi Publishing Corporation http://www.hindawi.com
Volume 2014
Volume 2014
Journal of
Petroleum Engineering
Submit your manuscripts at https://www.hindawi.com
Geophysics International Journal of
Hindawi Publishing Corporation http://www.hindawi.com
Advances in
Volume 2014
Hindawi Publishing Corporation http://www.hindawi.com
Volume 2014
Journal of
Mineralogy
Geological Research Volume 2014
Hindawi Publishing Corporation http://www.hindawi.com
Advances in
Geology
Climatology
International Journal of Hindawi Publishing Corporation http://www.hindawi.com
Advances in
Journal of
Meteorology Hindawi Publishing Corporation http://www.hindawi.com
Hindawi Publishing Corporation http://www.hindawi.com
Volume 2014
Volume 2014
Hindawi Publishing Corporation http://www.hindawi.com
International Journal of
Atmospheric Sciences Hindawi Publishing Corporation http://www.hindawi.com
International Journal of
Oceanography Volume 2014
Volume 2014
Hindawi Publishing Corporation http://www.hindawi.com
Oceanography Volume 2014
Applied & Environmental Soil Science Hindawi Publishing Corporation http://www.hindawi.com
Volume 2014
Hindawi Publishing Corporation http://www.hindawi.com
Volume 2014
Journal of Computational Environmental Sciences Volume 2014
Hindawi Publishing Corporation http://www.hindawi.com
Volume 2014