Evaluating Models of Latent Document Semantics in the Presence of OCR Errors Daniel D. Walker, William B. Lund, and Eric K. Ringger Brigham Young University Provo, Utah, USA
[email protected], bill
[email protected],
[email protected]
Abstract Models of latent document semantics such as the mixture of multinomials model and Latent Dirichlet Allocation have received substantial attention for their ability to discover topical semantics in large collections of text. In an effort to apply such models to noisy optical character recognition (OCR) text output, we endeavor to understand the effect that character-level noise can have on unsupervised topic modeling. We show the effects both with document-level topic analysis (document clustering) and with word-level topic analysis (LDA) on both synthetic and real-world OCR data. As expected, experimental results show that performance declines as word error rates increase. Common techniques for alleviating these problems, such as filtering low-frequency words, are successful in enhancing model quality, but exhibit failure trends similar to models trained on unprocessed OCR output in the case of LDA. To our knowledge, this study is the first of its kind.
1
Introduction
As text data becomes available in massive quantities, it becomes increasingly difficult for human curators to manually catalog and index modern document collections. To aid in the automation of such tasks, algorithms can be used to create models of the latent semantics present in a given corpus. One example of this type of analysis is document clustering, in which documents are grouped into clusters by topic. Another type of topic analysis attempts to discover finer-grained topics—labeling individual words in a document as belonging to a particular
topic. This type of analysis has grown in popularity recently as inference on models containing large numbers of latent variables has become feasible. The modern explosion of data includes vast amounts of historical documents, made available by means of Optical Character Recognition (OCR), which can introduce significant numbers of errors. Undertakings to produce such data include the Google Books, Internet Archive, and HathiTrust projects. In addition, researchers are having increasing levels of success in digitizing hand-written manuscripts (Bunke, 2003), though error rates remain much higher than for OCR. Due to their nature, these collections often lack helpful meta-data or labels. In the absence of such labels, unsupervised machine learning methods can reveal patterns in the data. Finding good estimates for the parameters of models such as the mixture of multinomials document model (Walker and Ringger, 2008) and the Latent Dirichlet Allocation (LDA) model (Blei et al., 2003) requires accurate counts of the occurrences and co-occurrences of words. Depending on the age of a document and the way in which it was created, the OCR process results in text containing many types of noise, including character-level errors, which distort these counts. It is obvious, therefore, that model quality must suffer, especially since unsupervised methods are typically much more sensitive to noise than supervised methods. Good supervised learning algorithms are substantially more immune to spurious patterns in the data created by noise for the following reason: under the mostly reasonable assumption that the process contributing the noise operates independently from the class labels, the noise in the features will not correlate well with the class labels, and the algorithm will learn
240 Proceedings of the 2010 Conference on Empirical Methods in Natural Language Processing, pages 240–250, c MIT, Massachusetts, USA, 9-11 October 2010. 2010 Association for Computational Linguistics
to ignore those features arising from noise. Unsupervised models, in contrast, have no grounding in labels to prevent them from confusing patterns that emerge by chance in the noise with the “true” patterns of potential interest. For example, even on clean data, LDA will often do poorly if the very simple feature selection step of removing stop-words is not performed first. Though we expect model quality to decrease, it is not well understood how sensitive these models are to OCR errors, or how quality deteriorates as the level of OCR noise increases. In this work we show how the performance of unsupervised topic modeling algorithms degrades as character-level noise is introduced. We demonstrate the effect using both artificially corrupted data and an existing real-world OCR corpus. The results are promising, especially in the case of relatively low word error rates (e.g. less than 20%). Though model quality declines as errors increase, simple feature selection techniques enable the learning of relatively high quality models even as word error rates approach 50%. This result is particularly interesting in that even humans find it difficult to make sense of documents with error rates of that magnitude (Munteanu et al., 2006). Because of the difficulties in evaluating topic models, even on clean data, these results should not be interpreted as definitive answers, but they do offer insight into prominent trends. For example, properties of the OCR data suggest measures that can be taken to improve performance in future work. It is our hope that this work will lead to an increase in the usefulness of collections of OCRed texts, as document clustering and topic modeling expose useful patterns to historians and other interested parties. The remainder of the paper is outlined as follows. After an overview of related work in Section 2, Section 3 introduces the data used in our experiments, including an explanation of how the synthetic data were created and of some of their properties. Section 4 describes how the experiments were designed and carried out, and gives an analysis of the results both empirically and qualitatively. Finally, conclusions and future work are presented in Section 5. 241
2
Related Work
Topic models have been used previously to process documents digitized by OCR, including eighteenthcentury American newspapers (Newmann and Block, 2006), OCRed editions of Science (Blei and Lafferty, 2006), OCRed NIPS papers (Wang and McCallum, 2006), and books digitized by the Open Content Alliance (Mimno and Mccallum, 2007). Most of this previous work ignores the presence of OCR errors or attempts to remove corrupted tokens with special pre-processing such as stop-word removal and frequency cutoffs. Also, there are at least two instances of using topic modeling to improve the results of an OCR algorithm (Wick et al., 2007; Farooq et al., 2009). Similar evaluations to ours have been conducted to assess the effect of OCR errors on supervised document classification (Taghva et al., 2001; Agarwal et al., 2007), information retrieval (Taghva et al., 1994; Beitzel et al., 2003), and a more general set of natural language processing tasks (Lopresti, 2008). Results suggest that in these supervised tasks OCR errors have a minimal impact on the performance of the methods employed, though it has remained unclear how well these results transfer to unsupervised methods.
3
Data
We conducted experiments on synthetic and real OCR data. As a real-world dataset, we used a corpus consisting of 604 of the Eisenhower World War II communiqu´es (Jordan, 1945; Lund and Ringger, 2009). These documents relate the daily progress of the Allied campaign from D-Day until the German surrender. They were originally produced as telegrams and were distributed as mimeographed copies. The quality of the originals is often quite poor, making them a challenging case for OCR engines. The communiqu´es have been OCRed using three popular OCR engines: ABBYY FineReader (ABBYY, 2010), OmniPage Pro (Nuance Communications, Inc., 2010), and Tesseract (Google, Inc., 2010). In addition, the curator of the collection has created a “gold standard” transcription, from which it is possible to obtain accurate measures of average document word error rates (WER) for each engine, which are: 19.9%, 30.4%, and 50.1% respectively.
While the real-world data is attractive as an example of just the sort of data that the questions addressed here apply to, it is limited in size and scope. All of the documents in the Eisenhower corpus discuss the fairly narrow topic of troop movements and battle developments taking place at the end of World War II. Neither the subject matter nor the means of conveyance allowed for a large or diverse vocabulary of discourse. In an attempt to generalize our results to larger and more diverse data, we also ran experiments using synthetic OCR data. This synthetic data was created by corrupting “clean” datasets, adding character-level noise. The synthetic data was created by building a noise model based on mistakes made by the worst performing OCR engine on the Eisenhower dataset, Tesseract. To construct the noise model, a character-level alignment between the human transcribed Eisenhower documents and the OCR output was first computed. From this alignment, the contingency table Md was generated such that Mdx,y was the count of the instances in which a character x in the transcript was aligned with a y in the OCR output. The rows in this matrix were then normalized so that each represented the parameters of a categorical distribution, conditioned on x. To parameterize the amount of noise being generated, the Md matrix was interpolated with an identity matrix I using a parameter γ so that the final interpolated parameters Mi were calculated with the formula Mi = γMd + (1 − γ)I. So that at γ = 0, Mi = I and no errors were introduced. At γ = 1.0, Mi = Md , and we would expect to see characters corrupted at the same rate as in the output of the OCR engine. We then iterated over each document, choosing a new (possibly the same) character yl for each original character xl according to the probability distrii bution p(yl = w0 |xl = w) = Mw,w 0 . Our process was a one-substitution algorithm, as we did not include instances of insertions or deletions, consequently words were changed but not split or deleted. This allowed for a more straightforward calculation of word error rate. Segmentation errors can still occur in the learning stage, however, as the noise model sometimes replaced alphabet characters with punctuation characters, which were treated as delimiters by our tokenizer. 242
Dataset 20 News Reuters Enron Eisenhower
|D| 19997 11367 4935 604
K 20 81 32 N/A
# Types 107211 29034 60495 8039
# Tokens 2261805 747458 2063667 76674
Table 1: Summary of test dataset characteristics. |D| is the number of documents in the dataset. K is the number of human-labeled classes provided with the dataset.
We chose three datasets to corrupt: 20 Newsgroups (Lang, 1995), Reuters 21578 (Lewis, 1997), and the LDC-annotated portion of the Enron e-mail archive (Berry et al., 2007). Each of these datasets were corrupted at values γ = i ∗ 0.01 for i ∈ (0, 13). At this point, the word error rate of the corrupted data was near 50% and, since this was approximately the WER observed for the worst OCR engine on the real-world data, we chose to stop there. The word error rate was calculated during the corruption process. Here is an example sentence corrupted at two γ values: γ = 0.000 I am also attaching the RFP itself. γ = 0.02 I am also attachEng the RFP itself. γ = 0.10 I Jm alAo attaching the RFP itself.
Table 3 shows some basic statistics for the datasets. The values shown are for the “clean” versions of the data. For an example of how noise and pre-processing techniques affect these counts see Section 4.1. It is interesting to note that the word error rates produced by the noise model appear to be significantly higher than first expected. One might assume that the WER should increase fairly steadily from 0% at γ = 0 to about 50% (the error rate achieved by the Tesseract OCR engine on the Eisenhower dataset) at γ = 1. There are at least two sources for the discrepancy. First, the vocabulary of the Eisenhower dataset does not match well with that of any of the source datasets from which the synthetic data were generated. This means that the word and character distributions are different and so the error rates will be as well. Secondly, whereas our technique gives the same probability of corruption to all instances of a given character, errors in true OCR output are bursty and more likely to be concentrated in specific tokens, or regions, of a document. This
243
1000000
Number of Features Culled
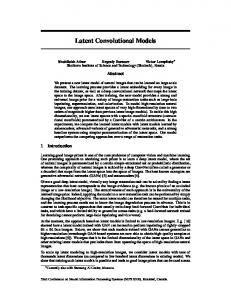
is because most sources of noise do not affect document images uniformly. Also, modern OCR engines do not operate at just the character level. They incorporate dictionaries and language models to prevent them from positing words that are highly unlikely. As a consequence, an OCR engine is much more likely to either get a whole word correct, or to miss it completely, concentrating multiple errors in a single word. This is the difference between 10 errors in a single word, which only contributes 1 to the numerator of the WER formula and 10 errors spread across 10 different words, which contributes 10 to the numerator. Furthermore, because content bearing words tend to be relatively rare, language models are poorer for them than for frequent function words, meaning that the words most correlated with semantics are also the most likely to be corrupted by an OCR engine. An example of this phenomenon is easy to find. In the Enron corpus, there are 165,871 instances of the word “the” and 102 instances of the string “thc”. Since “c” has a high rate of confusion with “e”, we would expect at least some instances of “the” to be corrupted to “thc” by the error model. At γ = 0.03, there are 156,663 instances of the word “the” and 513 instances of “thc”. So, the noise model converts “the” to “thc” roughly 0.3% of the time. In contrast, there are no instances of “thc” in the Tesseract OCR output even though there are 5186 instances of “the” in the transcription text, and so we would expect approximately 16 occurrences of “thc” if the errors introduced by the noise model were truly representative of the errors in the actual OCR output. Another interesting property of the noise introduced by actual OCR engines and our synthetic noise model is the way in which this noise affects words distributions. This is very important, since word occurrence and co-occurrence counts are the basis for model inference in both clustering and topic modeling. As mentioned previously, one common way of lessening the impact of OCR noise when training topic models over OCRed data is to apply a frequency cutoff filter to cull words that occur fewer than a certain number of times. Figures 1 and 2 show the number of word types that are culled from the synthetic 20 Newsgroups OCR data and the Eisenhower OCR data, respectively, at various levels of noise. Note that the cutoff filters use a strict “less
800000
2 5 10
600000 400000 200000 00
10
20
WER
30
40
50
Figure 1: The number of word types culled with frequency cutoff filters applied to the 20 Newsgroups data with various levels of errors introduced.
than”, so a frequency cutoff of 2 eliminates only words that occur once in the entire dataset. Also, these series are additive, as the words culled with a frequency cutoff of 2 are a subset of those culled with a frequency cutoff of j > 2. In both cases, it is apparent that by far the largest impact that noise has is in the creation of singletons. It seems that the most common corruptions in these scenarios is the creation of one-off word types through a unique corruption of a (most likely rare) word. This means that it is unlikely that enough evidence will be available to associate, through similar contexts, the original word and its corrupted forms. Due to the fact that most clustering and topic models ignore the forms of word tokens (the characters that make them up), and only take into account word identities, we believe that the similarity in the way in which real OCR engines and our synthetic OCR noise model distort word distributions is sufficient evidence to support the use of the synthetic data until larger and better real-world OCR datasets can be made available. Though the actual errors will take a different form, the character-level details of the errors are less relevant than the word distribution alterations for the models in question.
4
Experimental Results
We ran experiments on both the real and synthetic OCR data. In this section we explain our experi-
30000
Number of Words Culled
25000
2 5 10
20000 15000 10000 50000
10
20
30
WER
40
50
60
Figure 2: The number of word types culled with frequency cutoff filters applied to the transcript and three OCR engine outputs for the Eisenhower data.
mental methodology and present both empirical and qualitative analyses of the results. 4.1
Methodology
For the synthetic OCR datasets, we ran clustering experiments using EM on a mixture of multinomials (c.f. (Walker and Ringger, 2008)). We specified the number of clusters to be the same as the number of classes provided with the data. Clusters were evaluated using several external cluster quality metrics which compare “gold standard” labels to those created through clustering. The metrics used were Variation of Information (VI) (Meil˘a, 2007), and the Adjusted Rand Index (ARI) (Hubert and Arabie, 1985). Other metrics were also calculated (e.g. the V-Measure (Rosenberg and Hirschberg, 2007), and Average Entropy (Liu et al., 2003)), but these results were excluded due to space constraints and the fact that their plots are similar to those shown. We did not cluster the Eisenhower data because of the absence of the class labels necessary for evaluation. For both the synthetic and non-synthetic data we also trained LDA topic models (Blei et al., 2003) using Gibbs sampling. We used the implementation found in the MALLET software package (McCallum, 2002) with the option enabled to learn the priors during sampling as discussed by Wallach et al. (2009a). Each LDA model was trained on 90% of the documents in each dataset. The trained model 244
was used to calculate an estimate of the marginal log-likelihood of the remaining 10% of the documents using the left-to-right algorithm (Wallach et al., 2009b). The number of topics used for each dataset was adjusted a priori according to the number of documents it contained. We used 100 topics for Enron and Eisenhower, 150 for Reuters, and 200 for 20 Newsgroups. In addition to running experiments on the “raw” synthetic data, we also applied simple unsupervised feature selectors before training in order to evaluate the effectiveness of such measures in mitigating problems caused by OCR errors. For the topic modeling (LDA) experiments three feature selectors were used. The first method employed was a simple term frequency cutoff filter (TFCF), with a cutoff of 5 as in (Wang and McCallum, 2006). The next method employed was Term Contribution (TC), a feature selection algorithm developed for document clustering (Liu et al., 2003). Term contribution is parameterized by the number of word types that are to remain after selection. We attempted three values for this parameter, 10,000, 20,000, and 50,000. The final method we employed was a method called Top-N per Document (TNPD) (Walker and Ringger, 2010), which is a simple feature selection algorithm that first assigns each type in every document a document-specific score (e.g. its TF-IDF weight), and then selects words to include in the final vocabulary by choosing the N words with the highest score from each document in the corpus. We found that N = 1 gave the best results at the greatest reduction in word types. After the vocabulary is built, all words not in the vocabulary are culled from the documents. This does not mean that all documents contain only one word after feature selection, as the top word in one document may occur in many other documents, even if it is not the top word in those documents. Likewise, if two documents would both contribute the same word, then the second document makes no contribution to the vocabulary. This process can result in vocabularies with thousands of words, leaving sufficient words in each document for analysis. For the clustering experiments, initial tests showed little difference in the performance of the feature selectors, so only the TNPD selector was used. Figures 3(a) and 3(b) show how the various pre-processing methods affect word type and token
60000
2200000 2000000
50000
1800000
tc.10000 tc.20000 tc.50000 tfcf.5 tnpd.1
30000 20000
1600000
Tokens
Types
40000
1400000 1200000
tc.10000 tc.20000 tc.50000 tfcf.5 tnpd.1
1000000 10000 00
800000 5
10
15
20
25
30
Word Error Rate
35
40
6000000
45
(a) The number of word types remaining after pre-processing.
5
10
15
20
25
30
Word Error Rate
35
40
45
(b) The number of word tokens remaining after pre-processing.
Figure 3: The effect of pre-processing on token and type counts for the 20 Newsgroups dataset at various error rates.
counts, respectively, for the 20 Newsgroups dataset. In contrast, without pre-processing the number of types scales from 107,211 to 892,983 and the number of tokens from 2,261,805 to 3,073,208. Because all of these procedures alter the number of words and tokens in the final data, log-likelihood measured on a held-out set cannot be used to accurately compare the quality of topic models trained on pre-processed data, as the held-out data will contain many unknown words. If the held-out data is also pre-processed to only include known words, then the likelihood will be greater for those procedures that remove the most tokens, as the product that dominates the calculation will have fewer terms. If unknown words are allowed to remain, even a smoothed model will assign them very little probability and so models will be heavily penalized. We use an alternative method for evaluating the topic models, discussed in (Griffiths et al., 2005), to avoid the aforementioned problems with an evaluation based on log-likelihood. Since the synthetic data is derived from datasets that have topical document labels, we are able to use the output from LDA in a classification problem with the word vectors for each document being replaced by the assigned topic vectors. This is equivalent to using LDA as a dimensionality reduction pre-process for document classification. A naive Bayes learner is trained on a portion of the topic vectors, labeled with the original document label, and then the classification accu245
racy on a held-out portion of the data is computed. Ten-fold cross-validation is used to control for sampling issues. The rationale behind this evaluation is that, even though the topics discovered by LDA will not correspond directly to the labels, there should at least be a high degree of correlation. Models that discover topical semantics that correlate well with the labels applied by humans will yield higher classification accuracies and be considered better models according to this metric. To compensate for the randomness inherent in the algorithms, each experiment was replicated ten times. The results of these runs were averaged to produce the values reported here. 4.2
Empirical Analysis
Both the mixture of multinomials document model and LDA appear to be fairly resilient to characterlevel noise. Figures 4 and 5 show the results of the document clustering experiments with and without feature selection, respectively. Memory issues prevented the collection of results for the highest error rates on the Enron and Reuters data without feature selection. With no pre-processing, the results are somewhat mixed. The Enron dataset experiences almost no quality degradation as the WER increases, yielding remarkably constant results according to the metrics. However, this may be an artifact of the relatively poor starting performance for this dataset, a result of the fact that the gold standard labels do not align
4.5
20_newsgroups reuters21578 enron
0.5
20_newsgroups reuters21578 enron
4.0
0.4 3.5
vi
ari
0.3
3.0 0.2 2.5
0.1 0.00
5
10
15
20
25
30
Word Error Rate
35
40
2.00
45
(a) Adjusted Rand Index results
5
10
15
20
25
30
Word Error Rate
35
40
45
(b) Variation of Information results (lower is better)
Figure 4: Results for the clustering experiments on the three synthetic datasets without feature selection.
well with automatically discovered patterns because they correspond to external events. In contrast, the Reuters data appears to experience drastic degradation in performance. Once feature selection occurs, however, performance remains much more stable as error rates increase. Figure 6(a) shows the results of running LDA on the transcript and digitized versions of the Eisenhower dataset. Log-likelihoods of the held-out set are plotted with respect to the WER observed for each OCR engine. The results support the finding that the WER of the OCR engine that produced the data has a significant negative correlation with model quality. Unfortunately, it was not possible to compare the performance of the pre-processing methods on this dataset, due to a lack of document topic labels and the deficiencies of log-likelihood mentioned previously. Figure 6(b) shows the results of the LDA topicmodeling experiments on the three “raw” synthetic datasets. Similar trends are observed in this graph. LDA experiences a marked degree of performance degradation, with all of the trend lines indicating a linear decrease in log-likelihood. Figures 7(a) through 7(c) show the results of evaluating the various proposed pre-processing procedures in the context of topic modeling. In the graph “noop.0” represents no pre-processing, “tc.N ” are the Term Contribution method parameterized to select N word types, “tfcf.5” is the term frequency cut246
off filter with a cutoff of 5 and “tnpd.1” is the Top N per Document method with N = 1. The y-axis is the average of the results for 10 distinct trials, where the output for each trial is the average of the ten accuracies achieved using ten-fold cross-validation as described in Section 4.1. Here, the cross-validation accuracy metric reveals a slightly different story. These results show that topic quality on both the raw and pre-processed noisy data degrades at a rate relative to the amount of errors in the data. That is, the difference in performance between two relatively low word error rates (e.g. 5% and 7% on the Reuters data) is small, whereas the differences between two high error rates (e.g. 30% and 32% on the Reuters data) can be relatively quite large. While pre-processing does improve model quality, in the case of LDA this improvement amounts to a nearly constant boost; at high error rates quality is improved the same amount as at low error rates. Degradations in model quality, therefore, follow the same trends, occurring at mostly the same rate in pre-processed data as in the raw noisy data. This is in contrast to the clustering experiments where preprocessing virtually eliminates failure trends. 4.3
Qualitative Analysis
Higher values measured with automated metrics such as log-likelihood on a held-out set and the cross-validation classification metric discussed here
0.5
4.5
20_newsgroups reuters21578 enron
4.0
0.4 3.5
20_newsgroups reuters21578 enron
vi
ari
0.3
3.0 0.2 2.5
0.1 0.00
10
20
30
Word Error Rate
40
2.00
50
(a) Adjusted Rand Index results
10
20
30
Word Error Rate
40
50
(b) Variation of Information results (lower is better)
Figure 5: Results for the clustering experiments on the three synthetic OCR datasets with TNPD feature selection.
do not necessarily indicate superior topics according to human judgement (Chang et al., 2009). In order to provide a more thorough discussion of the relative quality of the topic models induced on the OCR data versus those induced on clean data, we sampled the results of several of the runs of the LDA algorithm. In Tables 2 and 3 we show the top words for the five topics with the highest learned topic prior (α in the LDA literature) learned during Gibbs sampling. This information is shown for the Reuters data first with no corruption and then at the highest error rate for which we have results for that data of 45% WER. In general, there appears to be a surprisingly good correlation between the topics learned on the clean data and those learned on the corrupted data, given the high level of noise involved. The topics are generally cohesive, containing mostly terms relating to financial market news. However, the topics trained on the clean data, though all related to financial markets, are fairly distinctive. Topic 3, for example seems to be about fluctuations in stock prices, and Topics 106 and 34 about business acquisitions and mergers. The topics trained on the noisy data are fairly homogeneous and the differences between them are more difficult to identify. In addition, it appears as though the first topic (topic 93) is not very coherent at all. This topic is significantly larger, in terms of the number of tokens assigned to it than the other topics shown in either table. In addition, the most probable words listed for 247
the topic seem less cohesive than for the other topics. It contains many two-letter words that are likely a mixture of valid terms (e.g., stock exchange and ticker symbols, and parts of place names like “Rio de Janeiro”) and corruptions of real words. For example, even though there are no instances of “ts” as a distinct token in the clean Reuters data, it is in the list of the top 19 words for topic 93. This is perhaps due to the fact that “is” can easily be converted to “ts” by mistaking t for i. It is also the case that, for most topics learned on the corrupted data, the most probable words for those topics tend to be shorter, on average, than for topics learned on clean data. We believe this is due to the fact that the processes used to add noise to the data (both real OCR engines and our synthetic noise model) are more likely to corrupt long words, especially in the case of the synthetic data which was created using a character-level noise model. Examination of the data tends to corroborate this hypothesis, though even long words usually contain only a few errors. For example, in the 20 Newsgroups data there are 379 instances of the word “yesterday”, a long word that is not close to other English words in edit distance. When the data has been corrupted to a WER of 47.9%, however, there are only 109 instances of “yesterday” and 132 tokens that are within an edit distance of 1 from “yesterday”. To some extent, we would expect to observe similar trends in real-world data. However, most OCR
0
abbyy omnipage tesseract transcript
75000
1000000
Log-likelihood of Held-out
Log-likelihood of Held-out
70000
80000 85000 90000 9500010
0
10
20
30
Word Error Rate
40
50
2000000 3000000 4000000 5000000
20_newsgroups reuters21578 enron
6000000 70000000
60
10
(a) Eisenhower Communiqu´es
20
30
Word Error Rate
40
50
(b) Synthetic Data
Figure 6: Log-likelihood of heldout data for the LDA experiments.
70
noop.0 tc.10000 tc.20000 tc.50000 tfcf.5 tnpd.1
Avereage CV Accuracy
68 66 64 62 60 58 56 54 520
5
10
15
20
25
30
Word Error Rate
35
40
45
(a) 20 Newsgroups Data 73
43 42
Avereage CV Accuracy
Avereage CV Accuracy
72 71 70 69 68 670
noop.0 tc.10000 tc.20000 tc.50000 tfcf.5 tnpd.1 5
10
41 40 39 38 37 36 35
15
20
25
30
Word Error Rate
35
40
340
45
(b) Reuters Data
noop.0 tc.10000 tc.20000 tc.50000 tfcf.5 tnpd.1 5
10
15
20
25
30
Word Error Rate
35
40
45
(c) Enron Data
Figure 7: Average ten-fold cross-validation accuracy for the LDA pre-processing experiments on the synthetic OCR data.
248
Topic 64
3
106
34
7
Words told, market, reuters, reuter, added, time, year, major, years, president, make, made, march, world, today, officials, industry, government, move year, pct, prices, expected, rise, lower, higher, demand, increase, due, fall, decline, current, high, end, added, level, drop, market reuter, corp, company, unit, sale, march, dlrs, mln, sell, subsidiary, acquisition, terms, group, april, purchase, acquired, products, division, business shares, dlrs, company, mln, stock, pct, share, common, reuter, corp, agreement, march, shareholders, buy, cash, outstanding, merger, acquire, acquisition mln, cts, net, shr, qtr, revs, reuter, avg, shrs, march, mths, dlrs, sales, st, corp, oct, note, year, april
Tokens 67159
Topic 93
99 32907 96 22167 141
22668
53
Tokens 258932
50377
54659
40475
22556
18511
Table 2: Top words for the five topics with the highest α prior values found using MALLET for one run of LDA on the uncorrupted Reuters data.
engines employ language models and dictionaries to attempt to mitigate OCR errors. As a result, given that a word recognition error has occurred in true OCR output, it is more likely to be an error that lies at an edit distance greater than one from the true word, or else it would have been corrected internally. For example, there are 349 instances of the word “yesterday” in the Eisenhower transcripts, and 284 instances in the Tesserect OCR output and only 5 tokens within an edit distance of one, meaning that 60 corruptions of this word contained more than one error, making up 90% of the errors for that word. However, many of these errors still contain most of the letters from the original word (e.g. “yesterdj.”, and “yestjkday”). In all cases, the corrupted versions of a given word are very rare, occurring usually only once or twice in the noisy output, making them useless features for informing a model.
5
Words reuter, march, pct, year, april, ed, market, er, told, es, st, end, ts, al, de, ng, id, sa, added company, pct, corp, shares, stock, dlrs, share, offer, group, reuter, mln, march, unit, stake, buy, cash, bid, sale, board mln, cts, net, shr, qtr, dlrs, revs, reuter, note, oper, avg, march, shrs, year, mths, st, sales, corp, oct mln, dlrs, year, net, quarter, share, company, billion, tax, sales, earnings, dlr, profit, march, income, ln, results, sale, corp pct, year, rose, rise, january, february, fell, march, index, december, month, figures, compared, reuter, rate, earlier, show, ago, base
Conclusions and Future Work
Table 3: Top words for the five topics with the highest α prior values found using MALLET for one run of LDA on the Reuters data corrupted with the data-derived noise model to a WER of 45%.
with the addition of character level errors to its input, with higher error rates impacting model quality in a way that was apparent empirically in the loglikelihood and ten-fold cross-validation metrics as well as through human inspection of the produced topics. Pre-processing the data also helps model quality for LDA, yet still yields failure trends similar to those observed on unprocessed data. We found it to be the case that even in data with high word error rates, corrupted words often share many characters in common with their uncorrupted form. This suggests an approach in which word similarities are used to cluster the unique corrupted versions of a word in order to increase the evidence available to the topic model during training time and improve model quality. As the quality of models increases on these noisy datasets, we anticipate a consequent rise in their usefulness to researchers and historians as browsing the data and mining it for useful patterns becomes more efficient and profitable.
Acknowledgments
The primary outcome of these experiments is an understanding regarding when clustering and LDA topic models can be expected to function well on noisy OCR data. Our results imply that clustering methods should perform almost as well on OCR data as they do on clean data, provided that a reasonable feature selection algorithm is employed. The LDA topic model degraded less gracefully in performance 249
We would like to thank the Fulton Supercomputing Center at BYU for providing the computing resources required for experiments reported here.
References ABBYY. 2010. http://finereader.abbyy.com.
ABBYY
finereader.
S. Agarwal, S. Godbole, D. Punjani, and Shourya Roy. 2007. How much noise is too much: A study in automatic text classification. In Proceedings of the Seventh IEEE Intl. Conf. on Data Mining (ICDM 2007), pages 3–12. Steven M. Beitzel, Eric C. Jensen, and David A. Grossman. 2003. A survey of retrieval strategies for ocr text collections. In In Proceedings of the Symposium on Document Image Understanding Technologies. Michael W. Berry, Murray Brown, and Ben Signer. 2007. 2001 topic annotated Enron email data set. David M. Blei and John D. Lafferty. 2006. Dynamic topic models. In Proceedings of the 23rd Intl. Conf. on Machine Learning (ICML 2006). David M. Blei, Andrew Y. Ng, and Michael I. Jordan. 2003. Latent Dirichlet allocation. Journal of Machine Learning Research, 3:993–1022. Horst Bunke. 2003. Recognition of cursive roman handwriting- past, present and future. In 7th International Conference on Document Analysis and Recognition (ICDAR 2003), volume 1, pages 448–459. Jonathan Chang, Jordan Boyd-Graber, Sean Gerrish, Chong Wang, and David Blei. 2009. Reading tea leaves: How humans interpret topic models. In Advances in Neural Information Processing Systems 22, pages 288–296. Faisal Farooq, Anurag Bhardwaj, and Venu Govindaraju. 2009. Using topic models for OCR correction. Intl. Journal on Document Analysis and Recognition (IJDAR), 12(3), September. Google, Inc. 2010. Tesseract. http://code.google.com/p/tesseract-ocr. Thomas L. Griffiths, Mark Steyvers, David M. Blei, and Joshua B. Tenenbaum. 2005. Integrating topics and syntax. In In Advances in Neural Information Processing Systems 17, pages 537–544. MIT Press. Lawrence Hubert and Phipps Arabie. 1985. Comparing partitions. Journal of Classification, 2(1):193–218, December. David Reed Jordan. 1945. Daily battle communiques, 19441945. Harold B. Lee Library, L. Tom Perry Special Collections, MSS 2766. Ken Lang. 1995. NewsWeeder: Learning to filter netnews. In Proceedings of the Twelfth International Conference on Machine Learning, pages 331–339. D. Lewis. 1997. Reuters-21578 text categorization test collection. http://www.research.att.com/˜lewis. Tao Liu, Shengping Liu, Zheng Chen, and Wei-Ying Ma. 2003. An evaluation on feature selection for text clustering. In Proceedings of the Twentieth Intl. Conf. on Machine Learning (ICML 2003), August. Daniel Lopresti. 2008. Optical character recognition errors and their effects on natural language processing. In Proceedings of the second workshop on Analytics for noisy unstructured text data (AND 2008), pages 9–16. William B. Lund and Eric. K Ringger. 2009. Improving optical character recognition through efficient multiple system alignment. In Proceedings of the Joint Conf. on Digital Libraries (JCDL’09), June. Andrew Kachites McCallum. 2002. MALLET: A machine learning for language toolkit. http://mallet.cs.umass.edu.
250
Marina Meil˘a. 2007. Comparing clusterings—an information based distance. Journal of Multivariate Analysis, 98(5):873–895. David Mimno and Andrew Mccallum. 2007. Organizing the OCA: learning faceted subjects from a library of digital books. In Proceedings of the Joint Conf. on Digital Libraries (JCDL’07), pages 376–385. Cosmin Munteanu, Ronald Baecker, Gerald Penn, Elaine Toms, and David James. 2006. The effect of speech recognition accuracy rates on the usefulness and usability of webcast archives. In Proceedings of the SIGCHI conference on Human Factors in computing systems, pages 493–502. David J. Newmann and Sharon Block. 2006. Probabilistic topic decomposition of an eighteenth-century american newspaper. J. Am. Soc. Inf. Sci. Technol., 57(6):753–767, February. Nuance Communications, Inc. 2010. OmniPage Pro. http://www.nuance.com/imaging/products/omnipage.asp. Andrew Rosenberg and Julia Hirschberg. 2007. V-measure: A conditional entropy-based external cluster evaluation measure. In Joint Conference on Empirical Methods in Natural Language Processing and Computational Language Learning (EMNLP-CoNLL 2007). Kazem Taghva, Julie Borsack, and Allen Condit. 1994. Results of applying probabilistic ir to ocr text. In in Proc. 17th Intl. ACM/SIGIR Conf. on Research and Development in Information Retrieval, pages 202–211. Kazem Taghva, Tom Nartker, Julie Borsack, Steve Lumos, Allen Condit, and Ron Young. 2001. Evaluating text categorization in the presence of ocr errors. In In Proc. IS&T/SPIE 2001 Intl. Symp. on Electronic Imaging Science and Technology, pages 68–74. SPIE. Daniel Walker and Eric Ringger. 2008. Model-based document clustering with a collapsed gibbs sampler. In Proceedings of the 14th ACM SIGKDD Intl. Conf. on Knowledge Discovery and Data Mining (KDD 2008). Daniel Walker and Erik K. Ringger. 2010. Top N per document: Fast and effective unsupervised feature selection for document clustering. Technical Report 6, Brigham Young University. http://nlp.cs.byu.edu/techreports/BYUNLPTR6.pdf. Hanna Wallach, David Mimno, and Andrew McCallum. 2009a. Rethinking LDA: Why priors matter. In Advances in Neural Information Processing Systems 22, pages 1973–1981. Hanna M. Wallach, Iain Murray, Ruslan Salakhutdinov, and David Mimno. 2009b. Evaluation methods for topic models. In Proceedings of the 26th Annual Intl. Conf. on Machine Learning (ICML 2009), pages 1105–1112. Xuerui Wang and Andrew McCallum. 2006. Topics over time: A non-markov continuous-time model of topical trends. In Proceedings of the 12th ACM SIGKDD Intl. Conf. on Knowledge Discovery and Data Mining (KDD 2006). Michael L. Wick, Michael G. Ross, and Erik G. LearnedMiller. 2007. Context-sensitive error correction: Using topic models to improve OCR. In Proceedings of the Ninth Intl. Conf. on Document Analysis and Recognition (ICDAR 2007), pages 1168–1172.