ers the theory of user-centric evaluation of recommender systems, and gives an ...... Köhler, C.F., Breugelmans, E., Del
Accepted with minor revisions to be included in the 2nd edition of the Recommender Systems handbook. Please do not share publicly, and consult the authors before citing this chapter.
Evaluating Recommender Systems with User Experiments Bart P. Knijnenburg, Martijn C. Willemsen
Abstract Proper evaluation of the user experience of recommender systems requires conducting user experiments. This chapter is a guideline for students and researchers aspiring to conduct user experiments with their recommender systems. It first covers the theory of user-centric evaluation of recommender systems, and gives an overview of recommender system aspects to evaluate. It then provides a detailed practical description of how to conduct user experiments, covering the following topics: formulating hypotheses, sampling participants, creating experimental manipulations, measuring subjective constructs with questionnaires, and statistically evaluating the results.
1 Introduction Traditionally, the field of recommender systems has evaluated the fruits of its labor using metrics of algorithmic accuracy and precision (see Chapter ?? for an overview of recommender systems evaluation practices). Netflix organized a million-dollar contest for just this goal of improving the accuracy of its movie recommendation algorithm [7]. In recent years, however, researchers have come to realize that the goal of a recommender system extends well beyond accurate predictions; its primary real-world purpose is to provide personalized help in discovering relevant content or items [72]. This has caused two important changes in the field. The first change was incited by McNee et al. [83] who argued that “being accurate is not enough” and that one should instead “study recommenders from a user-centric perspective to make them not only accurate and helpful, but also a pleasure to use” (p. 1101). McNee et al. Bart P. Knijnenburg UC Irvine, CA, USA, e-mail:
[email protected] Martijn C. Willemsen Eindhoven University of Technology, Eindhoven, The Netherlands, e-mail:
[email protected]
1
2
Bart P. Knijnenburg, Martijn C. Willemsen
suggest broadening the scope of research regarding the outcomes of the evaluation beyond accuracy measures. This suggestion has spawned a research area that evaluates recommender systems in online user experiments with user-centric evaluation metrics that span behaviors (e.g. user retention and consumption) as well as attitudes (e.g. usability, choice satisfaction, and perceived usefulness; cf. [67, 95]). The second change is a broadening of the scope of research regarding the system aspects to investigate beyond just the algorithm of the recommender. In essence, recommender systems apply algorithms on user input with the goal of providing some kind of personalized output. This means that aside from the algorithm, there are two important interactive components to any recommender: the mechanism through which users provide their input, and the means by which they receive the system’s output. Realizing the importance of these interactive components, McNee et al. [84] suggested that researchers should put more focus on the “Human-Recommender Interaction” and investigate these interactive components. Moreover, in his RecSys 2009 keynote Martin emphasized the importance of this endeavor: he argued that the interactive components of a recommender account for about 50% of its commercial success, while he provocatively estimated that the algorithm accounts for only 5% [81]. Indeed, research has shown that the preference elicitation mechanism and the presentation of recommendations have a substantial impact on users’ acceptance and evaluation of recommender systems as well as their usage behavior (cf. [19, 67, 96]). These two changes have gradually evolved the field to take broader perspective on the user experience of recommender systems [72]. However, the majority of current research on recommender systems is still primarily focused on creating better algorithms, and conducts offline machine learning evaluations instead of “live” user experiments. The contribution of that research is thus limited to claims about algorithmic accuracy and precision; without performing any user-centric evaluations it is difficult to extend these claims to the more user-centric objective of recommender systems: giving users a pleasant and useful personalized experience. Proper evaluation of the user experience of a recommender system requires conducting a user experiment,1 either in the form of a lab experiment or a randomized field trial (which includes—but also extends beyond—conventional A/B tests). This chapter of the Recommender System Handbook is meant as a guideline for students and researchers aspiring to conduct user experiments with their recommender systems, as well as for editors and reviewers of conferences and journals to evaluate manuscripts. To this end, this chapter will provide both theoretical and practical guidelines. The theoretical part starts with the description of the Knijnenburg et al. [67] User-Centric Evaluation Framework for Recommender Systems. We subsequently use this framework to highlight aspects of recommenders and their users that could be the object of study. We outline what has already been tested, and where gaps in the literature exist. In the practical part, we provide guidelines regarding all 1
We use the term “user experiment” to denote the use of experimental conditions and formal measurement as a means of testing theories about users interacting with recommender systems. This as opposed to “user studies”, which are typically smaller observational studies used to iteratively improve the usability of a recommender system.
Evaluating Recommender Systems with User Experiments
3
the steps involved in setting up, conducting and analyzing user experiments. The framework will be used there to motivate and illustrate our practical guidelines. This chapter is meant as a practical primer; a succinct yet comprehensive introduction to user experiments, motivated by numerous examples of published recommender systems studies. The reader who is serious about conducting user experiments is encouraged to continue their learning process beyond this chapter. To this effect we have listed a number of excellent textbooks in the conclusion of this chapter.
2 Theoretical Foundation and Existing Work An essential part of conducting a good experiment is to have a good research model (or descriptive theory, cf. [53]) of how the aspects under evaluation interact (see Sect. 3.1). Such models are usually based on a synthesis of formal theories and existing research, identifying the unknown parameters, and formulating testable hypotheses regarding these parameters. To add some structure to the process of theory development, it is helpful to conceptualize the interaction between users and recommenders within a theoretical framework. Several of such frameworks exist (cf. [84, 95]), but we choose to structure this chapter around the Knijnenburg et al. [67] User-Centric Evaluation Framework for Recommender Systems.
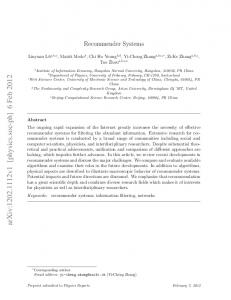
2.1 Theoretical Foundation: The Knijnenburg et al. Evaluation Framework The Knijnenburg et al. [67] framework consists of two levels (see Fig. 1). The top level is a middle range “EP type” theory2 of how users experience an interactive information system. A middle range theory is a theory about human behavior that is applicable in a specific but reasonably generic situation (in this case: in using an interactive information system). An “EP type” theory is a theory that can be used to explain (E) the described behavior and to predict (P) how users would behave under specific circumstances. The theory that comprises the top level of the Knijnenburg et al. framework combines 3 existing theories of attitudes and behaviors [2, 3, 4, 37], technology acceptance [26, 116], and user experience [46, 47]. Specifically, it describes how users’ subjective interpretation (Subjective System Aspects, or SSA) of a system’s critical features (Objective System Aspects) influences their experi2
See [45] for a taxonomy of different types of theory. Like Hassenzahl [46, 47], our framework describes the formation of experiences during technology use rather than the longer-term phenomenon of technology acceptance, but it extends this model to behavioral consequences using attitude-behavior theories [2, 3, 4, 37] (a theoretical structure that is prominent in technology acceptance models [26, 116]). 3
4
Bart P. Knijnenburg, Martijn C. Willemsen
ence of (EXP) and interaction with (INT) a system. Note that the top level of the framework can potentially be applied beyond the field of recommender systems. The lower level of the Knijnenburg et al. framework is a classification of recommender system related constructs under these higher level concepts (inspired by related analysis-type frameworks of recommender system aspects [84, 95, 122]). These constructs can be used to turn the top-level theory into models for specific recommender system evaluation studies. The combination of a top level theory and a lower level taxonomy makes our framework more actionable than [84] (because the EP type theory provides concrete suggestions for specific research hypotheses) and more generic than [95] (because the EP type theory is generative, which makes our framework more easily adaptable to new areas of recommender system research). The Knijnenburg et al. framework has been put to practice in several published and unpublished studies, so we will be able to illustrate many of our practical guidelines with examples from existing applications of this framework. An updated version4 of the Knijnenburg et al. [67] evaluation framework is displayed in Fig. 1. It represents the user-centric evaluation of recommender systems as six interrelated conceptual components: Objective System Aspects (OSAs) As recommender systems are typically multifaceted systems, their evaluation should be simplified by considering only a subset of all system aspects in each experiment. The Objective System Aspects
routine
system trust
choice goal
Situational Characteristics (SC) System (OSA)
Perception (SSA)
Experience (EXP)
Interaction (INT)
algorithm
usability
system
rating
interaction
quality
process
consumption
presentation
appeal
outcome
retention
Personal Characteristics (PC) gender
privacy
expertise
Fig. 1 An updated version of the User-Centric Evaluation Framework [67]. 4
The paths from Personal and Situation Characteristics to Subjective System Aspects were added to the original framework (as presented in [67]) based on insights from various experiments with the framework.
Evaluating Recommender Systems with User Experiments
5
(OSAs) are the aspects of the system that are currently being evaluated. The algorithm can be considered as an OSA, but also the input (interaction) mechanisms (e.g. the rating scale used to provide feedback on recommendations) or output (presentation) mechanisms (e.g. the number of presented recommendations, or their layout). Subjective System Aspects (SSAs) Although we are ultimately interested in the effects of OSAs on User Experience (EXP) and Interaction (INT), we need to consider Subjective System Aspects (SSAs) as mediating variables of these effects. SSAs are users’ perceptions of the OSAs. SSAs are measured with questionnaires that participants are asked to complete after (or sometimes during) their interaction with the system (see Sect. 3.4). The measurement of SSAs is necessary because incremental advances in recommender system aspects (e.g. algorithms) are often small, and may go unnoticed. SSAs help establish whether users perceive a certain system aspect, independently of their evaluation of the aspect. For example, if an improved system does not lead to the expected increase in user satisfaction, the SSA “perceived recommendation quality” can be used to find out if users simply did not notice the improvement, or if they noticed it but did not really like it. SSAs mediate the effects of OSAs on EXP, thereby explaining how and why OSAs influence EXP, as well as increasing the robustness of this causal link. User Experience (EXP) The User Experience factors (EXPs) are users’ selfrelevant evaluations of the qualities of the recommender system. User experience is also measured with questionnaires. Note that experience can relate to different aspects of system usage, namely the evaluation of the recommender system itself (e.g. perceived system effectiveness; system-EXP), the evaluation of the process of using the system (e.g. expressing preferences, and browsing or choosing recommended items; process-EXP), or the evaluation of the chosen items (e.g. choice satisfaction; outcome-EXP). It is important to make these distinctions, because different OSAs may influence different aspects of the experience. Interaction (INT) The “final step” in the evaluation of a recommender system is the users’ interaction with the system (INT). The interaction can be measured objectively by logging the users’ clicks. Examples are: the number of recommendations inspected by the user, their rating feedback, and the time they spent using the recommender. Behavior grounds the subjective part of the evaluation in observable behavior. At the same time, the subjective components provide explanations for the (sometimes counterintuitive) observed behaviors. Personal and Situational Characteristics (PCs and SCs) Although the main objective of most user experiments is to test the effects of OSAs on SSAs, EXPs and INTs, these outcomes can also be influenced by Personal Characteristics (e.g. domain knowledge; PCs) and Situational Characteristics (e.g. choice goals; SCs). PCs and SCs are typically measured by questionnaires5 , and since they are be5
In some cases PCs and SCs can be inferred from user behavior, e.g. observing the click-stream can tell us the market segment a user belongs to [44]. SCs can also be manipulated, e.g. by priming users to approach the recommender with either a concrete or abstract mindset [71, 120]
6
Bart P. Knijnenburg, Martijn C. Willemsen
yond the influence of the system they can be measured before users interact with the system. The evaluation framework can be used as a conceptual guideline for developing hypotheses. It can answer questions like: Which EXP aspects is this OSA likely to influence? For example, an improved algorithm may influence users’ evaluation of the recommendations (outcomeEXP), while a new preference elicitation method is likely to influence the perceived effectiveness of the recommendation process (process-EXP). Both may impact users’ satisfaction with the system itself (system-EXP). Which SSAs can be used to explain these effects? For example, certain algorithms may produce more accurate recommendations, while other algorithms may increase the diversity of the recommendations. Both may increase user satisfaction, but for different reasons. Which PCs and SCs may moderate these effects? For example, users’ liking of accurate or diverse recommendations may depend on their choice goals (SC). The most suitable preference elicitation method may depend on users’ domain knowledge (PC). Like most theories [2, 3, 4, 26, 37, 116], the theoretical top level of the Knijnenburg et al. [67] evaluation framework is generative: experimenters should see the relationships between OSA, SSA, EXP, and INT as a blueprint for their own descriptive models, but define their own set of measurable constructs and manipulations that are tailored to their experiment. This way, the framework can help answer questions that are specifically relevant to the system under evaluation.
2.2 Overview of Existing User-Centric Work and Promising Directions The main contribution of any recommender system user experiment is an empirical evaluation of how selected OSAs influence the user experience, possibly moderated by PCs and SCs. To aid the selection of interesting research topics, we provide a brief overview of OSAs that have been studied in the past, and some promising directions for future work. When writing a related works section for their own papers, researchers are advised to also consult other existing overviews of user-centric research in recommender systems, such as the following: • Xiao and Benbasat [122] provide a thorough overview and synthesis of 47 empirical user-centric studies on what they call “recommendation agents”. Their synthesis consists of a conceptual model that served as inspiration for the Knijnenburg et al. [67] framework. The authors recently updated their overview [123]. • Pu et al. [96] provide an overview of the state-of-the-art of user-centric recommender systems studies. Their synthesis consists of a number of practical design guidelines for recommender systems developers (see also Chapter ??).
Evaluating Recommender Systems with User Experiments
7
• Konstan and Riedl [72] put the rise of user-centric evaluation of recommender systems into a historical context. They focus on user-centric implications of technical aspects of recommender systems. Here we discuss the most commonly researched OSAs of recommender systems. Envisioning a recommender system as a generic system that processes inputs to produce outputs, the main OSA categories are the input (preference elicitation), processing (algorithm) and output (recommendations and the presentation thereof). Our overview is meant for researchers who wish to evaluate the user experience of recommender systems. Researchers who wish to use recommender systems as a vehicle for researching aspects of human decision making are referred to Chapter ?? for a comprehensive overview.
2.2.1 Preference elicitation methods The four most common methods recommender systems use to elicit preferences from users are rating scales, attribute weights, critiques, and implicit behavior. Rating scales are the most commonly employed method. They vary in granularity from binary (thumbs up/down), via the most common star ratings (5 stars or 10 half stars), to sliders (any number of steps). Research has shown that users behave differently depending on the used rating scale [42]. Users seem to prefer the 5-star and 10half-star scales [15, 23, 28, 42, 106]. The more granular rating methods are more effortful, but also provide more information [60]. Regardless of the rating scale, user-ratings are often inaccurate [5, 100], and helping users with the rating task can increase their accuracy [87]. Preference elicitation via attribute weights originates from the field of decision analysis, where multi-attribute utility theory is used as a standard for rational decision-making [9]. Early work in this area shows that attribute-based recommenders result in better decisions and less effort compared to static browsing tools [48]. This benefit is moderated by domain knowledge: only experts are more satisfied with attribute-based recommenders and their outcomes; for novices, expressing preferences in terms of needs or examples tends to work better [65, 66, 98]. Another method to elicit preferences is example critiquing. In this method, users iteratively provide detailed feedback on example recommendations. Substantial user-centric work in this area (as summarized in [19]) shows that example critiquing systems save cognitive effort and increase decision accuracy. Moreover, aiding users by suggesting critiques seems to improve users’ decision confidence [16]. On the other hand, Lee and Benbasat [77] show that a preference elicitation method that highlights trade-offs may increase users’ trade-off difficulty. A recommender system needs a certain number of ratings before it can produce accurate recommendations, but not all users may have rated that many items yet; this is the so-called “cold start problem”. Implicit behavioral feedback such as browsing or purchase/consumption actions can be used to compute recommendations in such cases. In [67] we compared the use of explicit and implicit feedback to calculate recommendations. The results of this study showed that an implicit feed-
8
Bart P. Knijnenburg, Martijn C. Willemsen
back recommender can provide higher-quality recommendations that result in a higher perceived system effectiveness and higher choice satisfaction. The results also showed that users perceived the explicit feedback-based recommendations to be more diverse, though, and diversity is another good quality of recommendation lists (cf. [120, 121, 126], see also Chapter ??) The best solution is thus to create a hybrid system that uses both explicit and implicit feedback. Koren et al. [73] show that such hybrid recommenders are usually more accurate than their implicit and explicit counterparts (see also Chapter ??). In [65] we show that hybrid recommenders are especially satisfying and effective for experts; for novices they seem to be too complex. Another way to overcome the cold start problem is to encourage users to rate more items. Work on this topic shows that the best way to get users to rate more items is to show them the benefit of rating by presenting good recommendations early on in the interaction [33, 39, 68]. Future work could conduct a more comprehensive evaluation across the listed preference elicitation paradigms, or explore how the most suitable preference elicitation method depends not just on users’ personal characteristics [65], but also on situational characteristics such as users’ current mindset or choice goal.
2.2.2 Algorithms As mentioned in the introduction, algorithms are often evaluated in an offline setting. More accurate algorithms are often assumed to result in higher quality recommendations and more effective systems, but this is not necessarily always the case. For example, McNee et al. [82] found that users rated their most accurate algorithm as least helpful, and Torres et al. [112] found that users were most satisfied with their least accurate algorithm. Despite the prevalent opinion that recommender systems research should move beyond offline evaluations to user-centric studies [72], surprisingly few research papers about new algorithmic solutions test the effect of the proposed algorithm on users’ satisfaction (some exceptions are [25, 29, 99, 31]). Given the results of McNee et al. [82] and Torres et al. [112], we strongly suggest that algorithm developers test whether the accuracy improvements of their algorithms translate to a higher user satisfaction.
2.2.3 Recommendations and Their Presentation The composition and presentation of the list of recommendations has a strong effect on the user experience. Choosing among top recommendations is a difficult task, and may lead to a phenomenon called “choice overload” [12]. Overcoming choice overload is one of the main challenges of research on the presentation of recommendation. Longer lists of recommendations may attract more attention [109], but are generally harder to choose from [6, 12]. Diversifying recommendations seems to be a good antidote against choice overload, because diversified lists are
Evaluating Recommender Systems with User Experiments
9
attractive even when short [120, 121, 126]. In fact, non-personalized diversified lists can be as attractive as personalized recommendations [67]. A steady stream of research has considered algorithmic solutions to diversifying recommendations [1, 76, 115, 124, 125]. More research needs to be done on whether these algorithmic solutions indeed result in perceptibly more diverse recommendations, and on whether these recommendations reduce choice overload and increase user satisfaction. The layout of the recommendations on the screen determines the amount of attention users pay to each recommendation. In a vertical list, users pay more attention to the first few items than to items lower down the list [12], but this decay is much less when using a grid layout [18]. In a grid layout, items in the top-left of the grid are taken to be the most relevant [57]. Chen and Tsoi [20] show that if recommendations are divided over two pages, the items on the second page get very few clicks. Comparing a list, grid and pie (circular) layout for recommendations, they find a slight user preference for the pie layout. This layout does however take up much more space on the screen. In many commercial recommender systems the recommendations are organized into distinct categories. Chen and Pu [17] have developed a “Preference-Based Organization Interface” that uses categories as a basis for critiquing. In their system, the primary category has the user’s top recommendations, and each other category explores a trade-off. Hu and Pu [52] show that this kind of categorization increases the perceived diversity of the recommendations. Beyond this, the categorization of recommendations has not received much attention in academic research but consumer research literature [85, 103] suggests that categorization structures the user’s choice task, and helps to overcome choice overload. Another challenge for recommender systems is to explain their recommendations (see [40, 41, 110] for an overview). Explanations can be based on the preferences of similar users (e.g. “this item was rated highly by users similar to you”), similar items (e.g. “this is similar to other items you liked”), or attributes/keywords of interest (e.g. “this has attributes you prefer”). Explanations can be presented textually (e.g. as a number, keyword, text or tag cloud) or visually (e.g. as a histogram or pie chart). Research has found that users like explanations [50], and that they increase users’ understanding of the recommendation process [41, 117], their trust in the quality of the recommendations, and the competence and benevolence of the system [24, 36, 119] (more on credibility and trust can be found in Chapter ??). This in turn increases their purchase intentions [118] and their intention to return to the system [94]. Which type of explanation works best? Research comparing different types of explanation strategies has found that explanations based on the preferences of similar users are persuasive: users tend to overestimate the quality of recommendations explained this way [10, 41, 50]. Item- and keyword-based explanations produce more accurate expectations [10, 41] and ultimately lead to more satisfaction [41, 108]. Finally, Pu and Chen demonstrate that carefully organizing the list of recommendations may also be perceived as an implicit explanation [94]. This type of explanation produces little perceived cognitive overhead.
10
Bart P. Knijnenburg, Martijn C. Willemsen
Tintarev and Masthoff [111] explore the idea of personalizing explanations to the user. They show that users tend to like such personalized explanations, but that these may actually be less effective than generic explanations. Social recommenders that use a user’s friends instead of anonymous nearest neighbors for recommendation purposes have an additional opportunity for explanation, as they can show how recommendations are linked to the preferences of the user’s friends. In [62] we demonstrate that displaying such a “recommendation graph” increases the inspectability of the recommendations, and ultimately users’ satisfaction with the system. There is no doubt that explaining recommendations is beneficial for the user experience, because they help users to increase their understanding of the recommendation process. However, users can also use explanations to justify their choice among the presented recommendations, which could arguably reduce choice overload and increase their decision confidence (see Chapter ??). We reiterate the conclusion by [72, 111] that future work should explore how explanations can help to reduce choice overload and otherwise improve users’ decision-making. Work on the presentation of recommendations generally considers variants of the conventional “Top-N” list of recommendations. Alternative uses of recommendations are becoming more prevalent in practice, though. Examples are “corecommendations” (“Users who bought this also bought. . . ” [89, 90]) and “smart defaults” (recommendations as default settings for yes/no or multiple-option decisions [61, 105]). The presentation of these types of recommendations has to date not been investigated in much detail.
3 Practical Guidelines We now turn to the practical part of this chapter, where we provide guidelines regarding the different steps involved in recommender system user experiments. Sect. 3.1 (Research Model) deals with developing a research model and hypotheses for the experiment. Sect. 3.2 (Participants) discusses the recruitment of test users. Sect. 3.3 (Manipulations) covers the operationalization of hypotheses into different versions of the system and the process of randomly assigning participants to these versions. Sect. 3.4 (Measurement) explains how to measure and analyze subjective concepts like satisfaction with questionnaires. Sect. 3.5 (Statistical Evaluation), finally, explains how to statistically test the formulated hypotheses. The guidelines are illustrated with existing user-centric work in the recommender systems field where possible.
3.1 Research Model The goal of a user experiment is to test the effect of some Objective System Aspect (OSA) on the user’s Experience (EXP) and Interaction (INT). The Knijnenburg et
Evaluating Recommender Systems with User Experiments
11
al. [67] framework suggests that such effects are mediated by Subjective System Aspects (SSAs), and possibly moderated by Personal and Situational Characteristics (PCs and SCs). Before conducting the experiment, the specific constructs and their expected interrelations should be presented as a research model consisting of a set of testable hypotheses. Each hypothesis consists of an independent variable and a dependent variable. Hypotheses are predictions about how the independent variable influences the dependent variable (and optionally, how a moderating variable qualifies this effect).
3.1.1 Determining Which OSAs Will Be Tested The first step in developing a research model is to determine which OSAs will be tested. In a typical experiment the OSAs are manipulated independent variables (see Sect. 3.3): their presence, operation or appearance is altered between different experimental conditions, but these conditions are exactly the same otherwise (similar to A/B testing). This concept of ceteris paribus (“all else remains the same”) is important, because it allows the researchers to trace differences in outcomes between conditions back to the manipulated OSA. If aside from the manipulated OSA other aspects differ between conditions as well, then these aspects are said to be confounded with the OSA: it is then impossible to determine whether the OSA or any of these other aspects caused the difference in outcomes. For example, in [68] we manipulated the algorithm by testing a system with an SVD algorithm against the same system that was altered to select random items as recommendations. The items were labeled as “recommendations” in both conditions. If we had given the items different labels in each condition (e.g. “random items” and “recommendations”), then the labeling would have been confounded with the algorithm itself. I.e., if users judged the recommendations to have a higher quality, this could be either because they indeed had a higher quality, or because the “recommendations” label simply made users think that they had a higher quality. By having the same label for the random items, we ruled out the latter explanation.
3.1.2 Selecting Appropriate Outcome Measures (INT and EXP) The second step in developing a research model is to select appropriate outcome measures (dependent variables). These are typically a combination of observed behaviors (INT) and questionnaire-based feedback (EXP). Although industry executives are typically most interested in objective outcomes that influence conversion rates (i.e. INT), there are reasons why the inclusion of EXP variables is beneficial for industry and academic researchers alike. First of all, users’ behavior is often influenced by external factors (e.g. purchases may be gifts rather than a reflection of the user’s taste; time on a page may be influenced by their Internet connection speed), so the effects of OSAs on INT are less robust than on EXP. More importantly, studies that test behavioral variables only (i.e. conventional A/B tests) can
12
Bart P. Knijnenburg, Martijn C. Willemsen
detect behavioral differences, but they often say very little about how and why the behavioral difference occurred. The explanation of behavioral effects is what drives scientific discovery and sound corporate decisions, and a carefully selected combination of EXP and INT variables can provide such explanations. Knijnenburg et al. [68] provides a good example of the importance of including both EXP and INT variables in an experiment. Looking only at the behavioral outcomes of this study, one would come to the conclusion that the system with the SVD algorithm resulted in a shorter total viewing time and fewer clips clicked than the system with random recommendations. This result may be counterintuitive, until one includes perceived system effectiveness as a mediating EXP variable: The system with the SVD recommender is perceived as more effective, which manifests in less need for browsing, and hence a shorter viewing time and fewer clips clicked. Only after incorporating both EXP and INT variables were we able to explain that the SVD recommender system is indeed effective. Experiments that measure EXP variables require that the researchers administer questionnaires, which limits the scale of such experiments compared to conventional A/B tests. As such, A/B tests can more effectively test the behavioral effects of a large number of OSAs simultaneously (these tests are more appropriately called “multivariate tests”). The optimal test plan therefore involves both: A/B tests are used to discover interesting effects, while user experiments with questionnaires can follow up these tests to explain how and why these interesting effects come about. Generally speaking, a well-rounded research effort should use a combination of INT and EXP variables: the EXP variables explain differences in participants’ behavior, while the INT variables “ground” the user experience in observable behavior.
3.1.3 Explaining The Effects With Theory And Mediating Variables (SSAs) The inclusion of EXP variables alone is not always sufficient to explain how and why users are more satisfied or behave differently between conditions. Moreover, even if one can demonstrate that a certain OSA makes users more (or less) satisfied, there needs to be a compelling argument about whether this finding is generalizable, or rather just a one-off event. A theory that explains the hypothesized effects of a study more thoroughly can provide a sense of its generalizability [45]. In this regard, reseachers can consult existing theories of user experience [46, 47], technology acceptance [26, 116], attitudes and behaviors [2, 3, 4, 37], or the theory of how users experience technology embedded in the Knijnenburg et al. [67] framework. Just having a theory for the hypothesized effects is not enough, though; the experiment can (and should) confirm these theories. In the words of Iivari [53], this means translating the conceptual level theories to the descriptive level, which involves not only developing hypotheses regarding expected effects of the OSA on INT and EXP variables, but also hypotheses that explain how and why these effects come about. A theory can also help in fine-tuning experimental conditions to rule out alternative explanations. For example, choice overload theory suggests that choice over-
Evaluating Recommender Systems with User Experiments
13
load is moderated by the diversity of an item set, independent of its quality and size [34, 103]. In Willemsen et al. [120, 121] we therefore took care to increase the diversity of the recommendations witout reducing their quality, and we manipulated the size of the item set independently from the diversity. Another way to test theoretical explanations is to include mediating SSA variables in the research model. These SSAs serve both as a dependent variable (in the hypothesized effect of OSA → SSA) and an independent variable (in the hypothesized effect of SSA → EXP). For example, experiment FT4 in [67] tested two matrix factorization algorithms, one using explicit feedback (MF-E) and the other using implicit feedback (MF-I), against a system that recommended the (non-personalized) most popular items. The results ([67], Fig. 9) showed that both algorithms (OSAs) result in a more effective system (EXP) than the non-personalized version, but that the reason for this differs per algorithm. Specifically, the MF-I recommendations are perceived to have a higher quality (OSA → SSA), and these higher quality recommendations eventually result in a more effective system (SSA → EXP). On the other hand, the MF-E recommendations are perceived to be more diverse (OSA → SSA), and these diverse recommendations are perceived to have a higher quality (SSA → SSA) and thus result in a more effective system (SSA → EXP). The mediating SSAs explain the different reasons why each algorithm leads to a more effective system. Finally, it may happen that the outcome variable does not differ between OSA conditions. In some cases, a theoretical examination may point out that different underlying effects could be counteracting each other, effectively cancelling out the total effect of the OSA. One can then demonstrate this theoretical phenomenon by measuring these underlying causes and including them as mediating variables in the research model. For example, in Bollen et al. [12] we showed that there was no effect of the experimental conditions on overall choice satisfaction, but we were still able to demonstrate the phenomenon of “choice overload” by incorporating the mediating variables item set attractiveness and choice difficulty. Specifically, the results showed that more attractive item sets led to higher choice satisfaction, but that attractive sets were also more difficult to choose from, which in turn reduced choice satisfaction. We thereby demonstrated that good recommendations do not always lead to higher choice satisfaction due to choice overload. Similarly, Nguyen et al. [87] showed that the increased effectiveness of rating support by means of providing exemplars was limited, because it was counteracted by increased difficulty of using this type of support, compared to a baseline rating scale.
3.1.4 Include PCs and SCs Where Appropriate The final step in developing a research model is to determine which PCs and SCs may influence the outcome variable. Incorporating these aspects into the experiment will increase the robustness of the results, so they should be considered even though they are typically beyond the influence of the system.
14
Bart P. Knijnenburg, Martijn C. Willemsen
In some cases, the effect of the OSA on the outcome variable is hypothesized not to hold universally, but only for a specific type of user or in a specific situation. In that case, this PC or SC is said to moderate the effect of the OSA on the outcome. Measuring the PC or SC is then crucial to determine the true effect of the OSA. For example, in [66] we argued that domain novices and experts use different strategies to make decisions, and that their ideal recommender system would therefore require different preference elicitation methods. Our results demonstrated that novices were indeed more satisfied with a case-based preference elicitation method, while experts were more satisfied with an attribute-based preference elicitation method.
3.1.5 Practical Tip: Never Formulate a “No Effect” Hypothesis It is important to note that with every hypothesis comes a null hypothesis, which argues the absence of the effect described in the hypothesis. For example: H0 : There is no difference in perceived recommendation quality between algorithm A and algorithm B. H1 : Participants perceive the recommendation quality of algorithm A to be higher than algorithm B. It is common practice in scientific writing to only state H1 and leave the null hypothesis implicit. Statistical evaluations can never directly “prove” H1 , but they can support it by rejecting H0 [38]. Importantly though, the absence of support for H1 does not mean that H0 is supported instead. In other words, if the aforementioned H1 is not supported, one cannot claim that there is no difference in perceived recommendation quality between algorithm A and B, only that the current study did not find such an effect. In fact, providing support for the absence of an effect is very difficult to do statistically [11]. Researchers are therefore advised to never formulate a “no effect” hypothesis. Experiments should always be set up in such a way that differences (not equalities) between experimental conditions prove the underlying theory.
3.2 Participants Finding participants to take part in the experiment is arguably the most timeconsuming aspect of conducting a user experiment. Participant recruitment involves a tradeoff between gathering a large enough sample for statistical evaluation, and gathering a sample that accurately reflects the characteristics of the target population. Both considerations are discussed below.
Evaluating Recommender Systems with User Experiments
15
3.2.1 Sampling Participants Ideally, the sample of participants in the experiment should be an unbiased (random) sample of the target population. Creating a truly unbiased sample is practically impossible, but if one aspires to extrapolate the study results to real-world situations, then the participants should resemble the users (or potential users) of the tested system as closely as possible. To avoid “sampling bias”, certain practices should be avoided. For example, it is very tempting to ask colleagues, students or friends to participate, but these people will arguably have more knowledge of the field of study than an average user. They may even know what the experiment is about, which may unconsciously cause them to behave more predictably. Your colleagues and friends may also be more excited about the experiment, and they may want to please you, which may lead to socially desirable answers [91, 107]. It is better when participants are “blind”, i.e. when they have no “special” connection to the researcher, the system, or the experiment. Another practice to avoid is to post a link to the study to one’s Facebook or Twitter account, and ask for reposts/retweets. Again, the first-degree participants will have a connection with the researcher, and should therefore be discarded. Participants who responded to the reposts/retweets will be more likely to resemble “blind” users, but extra checks should be performed on them since they are recruited via a “snowball sampling method” [32, 49, 78, 101]. Participant recruitment messages should be phrased carefully, because their framing may influence who participates in the study and how participants approach the tested system. It is generally better to give a generic description of the study to avoid bias. Specifically, the description should focus on the task (“Test this music recommender and answer a questionnaire”) rather than the purpose of the study (“We are studying users’ privacy perceptions of a recommender system”). Avoid technical terms, otherwise non-expert users may feel they are not knowledgeable enough to participate (note that even the term “recommender system” itself may not be common parlance for some potential users). Also make sure that the experiment works in all major browsers (even older versions) and on both laptops and tablets. In some cases it makes sense to limit participation in the experiment to a specific subset of users, especially when some users cannot be given a meaningful experience. For example, in [62] we tested the inspectability and control of social recommenders using TasteWeights, a music recommender that uses overlap between Facebook users’ music likes and their friends’ music likes to calculate recommendations. We limited participation in this experiment to Facebook users with sufficient overlap between their own music likes and those of their friends. Users with insufficiently overlapping profiles were asked to either add more music likes or leave the study. We argued that this was admissible because a real system would likely do something similar. At the same time though, this meant that our conclusions would only hold for eligible users, and not for the population at large.
16
Bart P. Knijnenburg, Martijn C. Willemsen
3.2.2 Determining the Sample Size User experiments need a reasonable sample size (often reported as N) to allow robust statistical evaluation of the hypotheses. Increasing the number of participants increases the statistical power of the experiment. Statistical power is the likelihood of detecting an effect of certain size in a sample, given that the effect indeed exists in the population. To determine the required sample size, researchers should perform a power analysis [22, 35] using an estimate (based on previous work) of the expected effect size of the hypothesized effects and an adequate power level (usually 85%). In recommender systems research manipulations typically have small effects (causing differences of about 0.2–0.3 standard deviations in the dependent variables) and occasionally medium-sized effects (differences of around 0.5 standard deviations). To detect a small effect (0.3 SD) with a power of 85% in a between-subjects experiment, 201 participants are needed per experimental condition. To detect a mediumsized effect (0.5 SD), 73 participants are needed per condition. Within-subjects experiments need far fewer participants: 102 to detect small effects, and 38 to test medium-sized effects. Note, though, that there are additional sample size requirements for advanced statistical procedures like Factor Analysis (see Sect. 3.4.2) and Structural Equation Modeling (see Sect. 3.5.3). The results of “underpowered” studies should be mistrusted, even if they are statistically significant. Due to low power, it is very likely that the experimenters simply “got lucky” and found a spurious effect [88]. And even if the reported effects are real, the effect sizes are inevitably overstated. Moreover, a low N means that the study may not have an inductive base that is wide enough to generalize the findings to the entire population, because small samples are likely to be biased. For example, one of the first user-centric evaluations of a recommender system, conducted by Sinha and Swearingen [104], employs only 19 participants. Even though the authors find some significant results, the study is severely underpowered so the conclusions cannot be generalized beyond this specific sample: the large effect sizes reported are likely to be much smaller (if not absent) in the population.
3.2.3 Practical Tip: Run Your Studies on a Crowd-Sourcing Platform In the past, participants were often recruited through volunteer panels painstakingly built by universities, or through expensive consumer research panels managed by marketing firms. This has changed with the rise of classified advertisements and crowd-sourcing websites such as Craigslist and Amazon Mechanical Turk. Craigslist allows researchers to post user experiments in various cities under Jobs > Etcetera, and is very convenient for creating a geographically balanced sample. Amazon Mechanical Turk6 is often used for very small tasks, but Turk workers appreciate more elaborate survey studies. A benefit of Mechanical Turk is that it has anonymous payment facilities. Requesters can set certain criteria for workers 6
Mechanical Turk is currently only available for researchers in the United States, but various alternatives for non-US researchers exist.
Evaluating Recommender Systems with User Experiments
17
that are allowed to participate, and experience has shown that it is good practice to restrict participants to U.S. workers with a high reputation [58, 92]. In our experience, the demographics of Craigslist and Mechanical Turk participants reflect the general Internet population, with Craigslist users being a bit higher educated and more wealthy. Turk workers are less likely to complain about tedious study procedures, but are also more likely to cheat [30]. Ample attention and quality checks can prevent cheaters from affecting the results. It is good practice to include a contact email address as well as an open feedback item in the study to catch unexpected problems with the experiment.
3.3 Experimental Manipulations In a typical user experiment, one or more OSAs are manipulated into two or more experimental conditions following the ceteris paribus principle (see Sect. 3.1). OSAs can be manipulated in various ways. One can turn the OSA on or off (e.g. display predicted ratings or not), test different versions of the OSA (e.g. implicit versus explicit preference elicitation), or test several levels of the OSA (e.g. display 5, 10 or 20 recommendations). This section explains how to create meaningful experimental conditions, and how to randomly assign participants to them.
3.3.1 Selecting Conditions to Test The goal of many user experiments is to demonstrate the superiority of some new invention: a new algorithm, preference elicitation method, or recommendation display technique. In such experiments, the condition with the new invention (called the treatment condition) should be tested against a reasonable baseline condition. A baseline should be included even when several treatment conditions are compared against each other, because the baseline condition links the study conditions to the status quo in recommender systems research. Selecting a baseline can be difficult. For example, one could compare a recommender system against a non-personalized system, but the results of such an unbalanced comparison are usually unsurprising [114]. On the other hand, recommender systems are definitely not always better than their non-personalized variant, so a comparison with a non-personalized system may very well be justified when testing a recommender in a new domain [21]. Another option is to test against the state-ofthe-art (e.g. what has proven to be the best algorithm, preference elicitation method, or recommendation display technique in previous work). Not all manipulations consist of a specific baseline and treatment condition. Sometimes (especially when the experiment focused on the users’ interaction with the recommender system rather than some new invention) there is no accepted baseline. A range of plausible conditions should then be considered in a way that maximizes the opportunity for the effect to occur, while staying within the realm of
18
Bart P. Knijnenburg, Martijn C. Willemsen
plausibility. For example, testing a recommendation list length of 5 versus 300 recommendations is likely to produce a choice overload effect, but finding choice overload in lists of more plausible lengths (e.g. 20 items) is practically much more useful. Making the manipulation too subtle (e.g. testing lists of 5 versus 6 items) may not produce a choice overload effect, or the effect may be so small that many more participants are needed to detect it.
3.3.2 Including Multiple Manipulations The simplest user experiment includes a single manipulation with two experimental conditions. One can also create multiple experimental conditions per manipulation, e.g. when manipulating recommendation list length one can test lengths of 5, 10 and 20. It is also possible to manipulate multiple OSAs in a single experiment, and this is especially interesting when these OSAs are expected to have an interaction effect on the outcome variables. Interaction effects occur when a certain manipulation has an effect in certain condition(s) of the other manipulation, but no effect (or the opposite effect) in the other condition(s) of the other manipulation. For example, in [120] we showed that high-diversity recommendations were perceived as more attractive, were easier to choose from, and led to higher system satisfaction than low-diversity recommendations, but only for short recommendation lists (5 recommendations). In longer lists, there was no difference between highand low-diversity recommendations. We concluded that giving users recommendation lists that are both short and diverse could reduce choice overload. When multiple OSAs are considered simultaneously like in the example above, these OSAs should be manipulated independently, or orthogonally by creating an instance of the system for each possible combination of conditions. The example above considered a 2-by-3 experiment (2 levels of diversity, 3 list lengths), which resulted in 6 experimental conditions.
3.3.3 Setting Up Between-Subjects or Within-Subjects Randomization There are essentially three ways in which participants can be assigned to experimental conditions. In a between-subjects experiment, participants are randomly assigned to one of the experimental conditions. A benefit of between-subjects experiments is that the manipulation remains hidden from the participant, since each participant sees only one condition. This also makes the experiment more realistic, because users of real systems usually also only see a single version of the system. The averages of outcome variables are compared between conditions to see if the OSA had an effect on the outcomes. By assigning participants to conditions randomly, any differences between participants are leveled out. These differences can still cause random fluctuations in the outcomes, though, which is why between-subjects experiments typically need a larger N to attain an adequate level of statistical power.
Evaluating Recommender Systems with User Experiments
19
Our study on different interfaces for an energy-saving recommender [65] is a good example of a between-subjects experiment. In the experiment different preference elicitation methods are tested, and users’ satisfaction with the chosen energysaving measures is an important outcome variable in the experiment. Having participants go through the same process of choosing energy-saving measures several times would have been rather weird, and users would have been able to guess the purpose of the different preference elicitation methods, which could have affected the results. With 5 conditions and a number of moderating PCs, the 147 participants recruited for this study were a bare minimum, though. In a sequential within-subjects experiment, participants interact with both experimental conditions, one at a time. A benefit of within-subjects experiments is that differences in outcomes can be compared for each participant, which effectively eliminates the between-participant variability. As a result, fewer participants are needed to attain an adequate level of statistical power. A downside is that participants may be able to guess the experimental manipulation, and that repeating the same experiment several times may feel unnatural. Moreover, participants may react differently the second time they walk through the experiment. Randomizing the order in which participants see the conditions prevents the order from becoming confounded with the condition in the overall analysis. In [121] we provide a good example of a within-subjects manipulation. In that study we tested three levels of diversification of the recommendations. The three different recommendation lists were presented in random order. Other than containing different items, the lists showed no apparent differences, so it was not possible for participants to guess the purpose of the study. Moreover, the presented lists were sufficiently different that the task of selecting an item from the list did not feel repetitive. Due to the within-subjects setup, the study was able to detect subtle differences between conditions. The study additionally manipulated the list length between-subjects, but no differences between length conditions (or interactions with diversification) were found. Pu and Chen [94] also use a within-subjects manipulation, to test two different presentation techniques for recommendations. Each participant completes two tasks, one with each presentation technique. To avoid repetitiveness, the tasks involve different recommendation domains (digital cameras and notebooks). The presentation order of domains and techniques are manipulated between-subjects in a 2-by-2 setup; this cancels out any order- and task-effects. They then compare the presentation techniques using within-subjects tests. In a simultaneous within-subjects experiment, participants experience all conditions at the same time. This allows participants to compare the different conditions and choose which one they like best. This again reduces between-participant variability, and also avoids order effects. Note though that the position of experimental conditions should be randomized, because we do not want to confound condition with position on the screen. The advantage of this method is that it can detect very subtle differences between conditions. The downside is that showing two conditions simultaneously is obviously a far cry from a realistic usage scenario.
20
Bart P. Knijnenburg, Martijn C. Willemsen
As an example of a simultaneous within-subjects experiment, Ghose et al. [43] considered a novel ranking algorithm for a hotel and travel search site based on crowd-sourced content. Their study pairs the proposed algorithm with several different baseline algorithms. Each pair is tested as a simultaneous within-subjects experiment, where the two rankings produced by the proposed algorithm and the baseline algorithm are presented side-by-side, and users choose which ranking they prefer. The results show that their proposed algorithm is significantly preferred over 13 different baselines in six different cities. On average, twice as many participants prefer the recommendations of the proposed algorithm to the baseline. Ekstrand et al. [31] also conducted a simultaneous within-subject design, and they chose this design because they were interested in detecting subtle differences between two recommendation lists produced by common algorithms (user-user, item-item and SVD). Like Ghose et al. [43] Users were asked which list they preferred, but also to indicate perceived differences between the lists in terms of the relative satisfaction, novelty and diversity. Importantly, Ekstrand et al. were able to link these perceived differences to objective measures of recommendation quality (e.g., perceived novelty was predicted by popularity rank). The results show that novelty (which was highest for the user-user algorithm) had a negative effect on satisfaction and preference for a list, whereas diversity showed a positive effect. Increased realism is the main reason why between-subjects experiments are more appropriate than within-subjects experiments in most recommender system studies. Note, however, that even a between-subjects experiment is not completely natural: participants know that they are part of an experiment, and may therefore behave differently. This is called the Hawthorne effect [75]. In experiments that involve real systems, the Hawthorne effect can be detected by comparing the behavior of participants in (the baseline condition of) the experiment with the behavior of participants in the real system (or in an A/B test). If behaviors are substantially different, this is likely due to the Hawthorne effect.
3.3.4 Practical Tip: Think Big, Start Small Designing experimental manipulations often involves difficult trade-offs. With several orthogonal manipulations with multiple variants each, the number of experimental conditions will grow exponentially. Since the number of participants needed to attain a certain level of statistical power grows linearly with the number of conditions, it is advisable to keep the number of conditions low. The best strategy is therefore to think big, but start small: write down all possible versions of all OSAs that are relevant to the study in an experiment plan, but then start investigating the manipulation that seems most likely to cause an effect. If this experiment indeed detects the effect, subsequent experiments can be conducted to test different levels of the manipulation, or to include additional manipulations that may moderate (i.e. interact with) the existing effect. In [16], for example, Chen and Pu identified several OSAs that may influence the effectiveness and usability of critiquing-based recommender systems: the number of
Evaluating Recommender Systems with User Experiments
21
recommendations presented in the first round of preference elicitation, the number of alternatives presented after each round of critiquing, and whether the user initiates the critiquing or the system suggests critiques (for both unit critiques and compound critiques). They systematically explored these parameters in a series of 2-condition experiments. By keeping the setup of the experiments consistent, they were even able to make comparisons across experiments. Consistent with the “think big, start small” mantra, it is in some cases perfectly acceptable to simplify a system to increase experimental control. For example, the original TasteWeights system [14] allows you to inspect connections between liked items, friends, and recommendations, and control the weights of both liked items and friends. In our user experiment of this system [62] we wanted to test the influence of these features separately, so we split the interaction into two steps: a control step and an inspection step. This allowed us to manipulate the control and inspection OSAs independently, which resulted in a much “cleaner” experimental design.
3.4 Measurement In this section we present best practices for measuring perceptions (SSAs), experiences (EXPs) and personal and situational characteristics (PCs and SCs) using questionnaires. Most importantly, we give the reader a practical example of performing a Confirmatory Factor Analysis (CFA) using MPlus7 , a state-of-the-art statistical software package, and Lavaan8 a package for R that has many of the same features.
3.4.1 Creating Measurement Scales Due to their subjective nature, measuring perceptions, experiences, and personal and situational characteristics is not as easy as it may seem. Whereas objective traits can usually be measured with a single question (e.g. age, income), this is not advisable for subjective concepts. Single-item measurements such as “On a scale from 1 to 5, how much did you like this system?” are said to lack content validity: each participant may interpret the item differently. For example, some may like the system because of its convenience, others may like it because of its ease of use, and again others may like it because the recommendations are accurate. These different interpretations reduce the precision and conceptual clarity of the measurement. A better approach is to create measurement scales consisting of multiple items;9 at least 3 but preferably 5 or more. This is a delicate process that usually involves multiple iterations of testing and revising items. It is advisable to first develop around 10–15 items and then reduce it to 5–7 through discussions with domain 7
http://www.statmodel.com/ http://lavaan.ugent.be/ 9 Or, multiple measurement scales for the different constructs (e.g. system satisfaction, ease of use, and recommendation quality), each measured with mutiple items. 8
22
Bart P. Knijnenburg, Martijn C. Willemsen
experts and comprehension pre-tests with test subjects. 1–2 additional items may still be discarded during the analysis of the actual study results. The items in most user experiments are phrased as statements (e.g. “The system was easy to use”) to which participants are asked to express their agreement on a 5or 7-point scale (from “strongly disagree” to “strongly agree”). Studies have shown that participants find such items easy to answer. There are a few additional tips for designing good questionnaire items: • Invest a lot of time in deciding upon a clear definition of the construct to be measured, and check for each item whether it fits the construct definition. • Include both positively and negatively phrased items. This will make questionnaires less leading, and allows one to explore the flipside of the construct. It also helps to filter out participants who do not carefully read the items. However, avoid the word “not”, because it is too easily overlooked. • Study participants may not have a college degree, so their reading level may be low. Use simple words and short sentences to aid comprehension. Like with the recruitment message, try to avoid technical terms. • Avoid double-barreled questions. Each item should measure only one thing at a time. For example, if a participant found the system fun but not very useful, they would find it hard to answer the question “The system was useful and fun.” As mentioned, it is a good idea to pre-test the questionnaire items with experts; they can give advice on how to accurately define the concept to be measured, and on whether the proposed questionnaire items cover all aspects of the concept. Furthermore, comprehension pre-tests can be conducted to test how well participants understand the questionnaire items. A comprehension pre-test invites participants to read the questionnaire items aloud and to explain their reasoning while answering the questions. Their think-aloud answers can highlight questionaire items that are unclear or interpreted incorrectly.
3.4.2 Establishing Construct Validity Once a set of items has been developed that accurately reflects the concept to be measured (i.e. content validity is established), the next step is to establish construct validity, i.e. to make sure that the items comprise a robust and valid measurement scale. For the purpose of statistical analysis, each multi-item measurement scale has to be turned into single variable. Summing the item scores may seem like the most straightforward way of doing this, but Confirmatory Factor Analysis (CFA) is a more sophisticated solution that not only creates the measurement variable but also tests some of the preconditions for construct validity along the way. Listings 1 and 2 show example input of a CFA as ran in MPlus and Lavaan. The output of these tools is very similar, so we present it for MPlus only (Listing 3). The example CFA is based on an experiment with a social network based music recommender system [62]. This system employs an innovative graph-based interface that shows how the users’ Facebook music “likes” overlap with their friends’ music
Evaluating Recommender Systems with User Experiments
23
“likes”, and how these friends’ other music “likes” are in turn used to create a set of recommendations. In the graph, users can trace back each recommendation to the friends that “liked” that item, and to the overlapping “likes” that caused these friends to be part of the user’s nearest-neighborhood. We argued that this graph would provide a good justification for the recommendations, thereby increasing the perceived recommendation quality (quality) and the understandability of the recommender system (underst). Moreover, we allowed users to control either the weights of their “likes” or the weights of their friends, and we argued that this would influence their perceived control (control). Finally, we argued that perceived recommendation quality, understandability, and control would ultimately increase users’ satisfaction with the system (satisf). The CFA validates the four subjective measurement scales of the experiment. Each scale is represented by a latent factor, with each item loading on its designated scale (MPlus: lines 8–11, Lavaan: lines 2–5). The output shows the loadings of the items on the factors (lines 1–30), which are proportional to the extracted variance (lines 42–67). The factors may be correlated with each other (lines 32–40). The solution has no standard scale, so we include code (MPlus: line 12, Lavaan: lines 6–9) to give the factors a standard deviation of 1 and a mean of 0.10 We also declare all items as ordered categorical (MPlus: line 6, Lavaan: line 12), because they are measured on a 5-point scale. Otherwise, the items would be treated an interval scale, which would assume that the difference between “completely disagree” (1) and “somewhat disagree” (2) is the same as the difference between “neutral” (3) and “somewhat agree” (4). MPlus and Lavaan model ordered categorical variables in a way that does not make this assumption. Listing 1 CFA input, MPlus 1 2 3 4 5 6 7 8 9 10 11 12
DATA: FILE IS twc.dat; !specify the data file VARIABLE: !list the variable names (columns in the data file) names are s1 s2 s3 s4 s5 s6 s7 q1 q2 q3 q4 q5 q6 c1 c2 c3 c4 c5 u1 u2 u3 u4 u5 cgraph citem cfriend; usevariables are s1-u5; !specify which vars are used categorical are s1-u5; !specify which vars are categorical MODEL: !specify each factor as [factorname] by [vars] satisf by s1* s2-s7; !satisfaction quality by q1* q2-q6; !perceived recommendation quality control by c1* c2-c5; !perceived control underst by u1* u2-u5; !understandability satisf-underst@1; !set the std. dev. of each factor to 1
10
MPlus and Lavaan use a different parameterization by default by fixing the loading of the first item to 1. We free up these loadings by including an asterisk after (MPlus) or NA* before (Lavaan) the first item of each factor. This alternative solution conveniently standardizes the factor scores.
24
Bart P. Knijnenburg, Martijn C. Willemsen
Listing 2 CFA input, Lavaan (R package) 1 2 3 4 5 6 7 8 9 10 11 12 13
model