1
Evaluating Stereo and Motion Cues for Visualizing Information Nets in Three Dimensions Colin Ware and Glenn Franck Faculty of Computer Science University of New Brunswick P.O. Box 4400, Fredericton, NB. E3B 5A3
[email protected]
submitted to
ACM Transactions on Graphics (in press).
also available as
University of New Brunswick Technical Document #TR94-082 February 1994 ©1994 University of New Brunswick Ware and Franck
TOG Info Net Vis
June 21, 1995
2
Evaluating Stereo and Motion Cues for Visualizing Information Nets in Three Dimensions Colin Ware and Glenn Franck Faculty of Computer Science University of New Brunswick P.O. Box 4400, Fredericton, NB. E3B 5A3
[email protected] Abstract This paper concerns the benefits of presenting abstract data in 3D. Two experiments show that motion cues combined with stereo viewing can substantially increase the size of the graph that can be perceived. The first experiment was designed to provide quantitative measurements of how much more (or less) can be understood in 3D than in 2D. The 3D display used was configured so that the image on the monitor was coupled to the user's actual eye positions (and it was updated in real-time as the user moved) as well as being in stereo. Thus the effect was like a local "virtual reality" display located in the vicinity of the computer monitor. The results from this study show that head-coupled stereo viewing can increase the size of an abstract graph that can be understood by a factor of three; using stereo alone provided an increase by a factor of 1.6 and head coupling alone produced an increase by a factor of 2.2. The second experiment examined a variety of motion cues provided by head coupled perspective (as in virtual reality displays), hand guided motion and automatic rotation respectively, both with and without stereo in each case,. The results show that structured 3D motion and stereo viewing both help in understanding, but that the kind of motion is not particularly important; all improve performance, and all are more significant than stereo cues. These results provide strong reasons for using advanced 3D graphics for interacting with a large variety of information structures. Key Words and Phrases: Head-coupled display, stereopsis, virtual reality, information visualization, network visualization.
1. INTRODUCTION A useful and interesting method for examining three dimensional structures is to couple a perspective stereoscopic view of a 3D scene to the user's eye positions and update the view in realtime as the user moves. The key elements of this are a high resolution monitor capable of running at a high frame rate, stereo glasses and some method for tracking the user's head position (see Figure 1) [5]. The position of the user's two eyes are computed from the head position and separate images are generated showing the correct perspective view of a set of virtual objects somewhere in the vicinity of the monitor screen. The result is a localized "Virtual Reality" (VR) environment which has a number of advantages over immersive virtual reality [1, 5], not the least of these being that the everyday workspace of desk, filing cabinet, co-workers and coffee mug are
Ware and Franck
TOG Info Net Vis
June 21, 1995
3 not excluded. In our previous work we have called this "Fish Tank VR" to characterize its localized nature and distinguish it from full immersive VR [19]. The advantages of Fish Tank VR representations of conventional objects are fairly obvious. For example, an industrial designer can see her design of a telephone handset as a truly three dimensional object, or a trainee mechanic can see the engine part and how it is inserted as if he were looking at the real thing. But what about abstract information, such as data base schemas, networks of human relationships, the structure of object-oriented code or hypertext links? It is by no means clear that 3D diagrams offer any advantages over 2D ones in representing this kind of information. The present paper provides some strong evidence that 3D diagrams can offer significant advantages under the right viewing conditions. But before presenting this evidence we review some of the evidence as to whether advanced 3D viewing techniques should be used for viewing information networks. We discuss three types of evidence: perceptual, anecdotal and experimental. 1.1 How many dimensions are there in visual space? In the following discussion we use the term visual space in the everyday sense of perceived area or volume, ignoring the dimensions of, for example, color and texture. Using a naive view, moving from a 2D to a 3D display should vastly increase the amount of information that can be represented. Consider a 1000x1000 computer display. On a line we can perceive 1000 distinct pixels, on the plane we can perceive 10002 distinct pixels. Extending this logic we should be able to display 10003 distinct voxels in a 3D volume. These relations can be succinctly expressed by the following equations I2D = I1D2
I3D = I2D3/2
where InD represents the information that can be perceived given an n-dimensional display. Clearly there is a flaw in this logic; in general we do not perceive volumes of data; we do not perceive details of the insides of solids, only the layout of surfaces in space. This places an upper bound on the amount of information that can be represented in a 3D space. Using a different naive view we can argue that since stereo 3D viewing is based on input from two eyes this can at most double the amount of information perceivable, and we know that such effects as binocular rivalry mean that truly independent images from the two eyes cannot be perceived [10]. In fact it is only possible to extract depth information from highly correlated information presented to the two eyes. This alternative pessimistic view can be expressed by the equation I3D = C*I2D where C is some constant < 2.0; probably much closer to one than to two, due to this correlation. This second view suggests that moving from 2D to 3D will only yield a small benefit in visualization, at least for the understanding of abstract data. If this view is correct it will be hardly worthwhile using 3D representations of abstract multidimensional networks of information; a 2D view is likely to be equally effective and much simpler to produce. There is a third view based on the ecological argument that because we have evolved in a 3D world, information presented in 3D will be processed more easily by the visual system.
Ware and Franck
TOG Info Net Vis
June 21, 1995
4 Networks of information do not have an inherent dimensionality in the geometric sense but if our brains prefer 3D layouts then a 3D layout may be more effective in conveying the information [15]. We should also allow that the brain is capable of integrating information from the sequence of views of the world that are obtained as we move about and that this considerably increases the amount of information obtainable, although as with stereopsis these views must be highly correlated. A truly 3D display is not simply a perspective picture, or a stereo perspective picture. It requires that the image be accurate from the actual viewpoint of the observer, especially if the observer is moving. A large part of space perception comes from the relative movement of objects; in fact, this seems to be considerably more important than stereopsis in helping us interpret spatial layout, whether it be from head motion, resulting in motion parallax [8], or from object rotation giving the kinetic depth effect [2,3]. This movement allows the brain to integrate spatial information over time, and whereas a stereo display only gives two views to help understand a scene, a scene in which there is relative movement of the head and objects provides a whole continuum. Head Tracking
Stereo Glasses
Virtual 3D Graph
Figure 1. The preferred method for visualizing complex networks of information may be using head coupled stereo views. This results in a virtual 3D view of the network placed in the vicinity of the monitor. 1.2 Anecdotal evidence There is growing evidence that representing diagrams in 3D can allow more complex information to be comprehended. An influential work has been the SemNet project [7]. This used a 3D representation to allow users to visualize large knowledge bases as nodes and arcs in a three dimensional space. No attempt was made to quantify the advantages of this mode of viewing over 2D layouts but much of the current interest in 3D abstract data visualization can be traced to this study. The Cone Tree technique developed by Robertson et al. [16] has the capacity to show considerably more tree structured data than do more conventional 2D layouts. In a Cone Tree all the children of a node are displayed around the base of a cone in 3D space and this principle is
Ware and Franck
TOG Info Net Vis
June 21, 1995
5 applied recursively. The authors claim that as many as one thousand nodes may be displayable using Cone Trees without visual clutter - this is clearly more than could be contained in a 2D layout, although the Cone Trees require certain user manipulations to access some of the information. However, on the other side of the argument there are 2D layout schemes that also claim to increase the amount of information displayable [11]. 1.3 Empirical evidence Of particular relevance to the display of information networks is work that has shown that the number of errors in detecting paths through tree structures is substantially reduced if a 3D display method is used [18,19]. Sollenberger and Milgram showed that both scene rotation and stereopsis helped reduce errors in a path tracing task [17,18]. In their motion conditions the stimulus pattern rocked back and forth about a vertical axis (the perspective imagery was not coupled to head position). They found that motion was more valuable than stereopsis in reducing errors when subjects were required to discover to which of two tree roots a highlighted leaf node was attached. In a similar experiment Ware et al. used a similar task with a head coupled stereo display in which the perspective view was coupled to the measured eye position of the observer [19]. Although in Ware et al's display the motion was caused by head movement, the results were similar to those obtained previously by Sollenberger and Milgram. Since the geometric transformation of the image which may occur under head coupling or scene rotation may be very similar there is every reason to suppose that the same visual mechanisms are involved in both cases in constructing a 3D interpretation of the world. A simple model for the integration of different depth cues is a weighted additive model [3], according to which the brain computes a weighted sum of different information in determining the depth that will be perceived. Sollenberger and Milgram found their data suggested a super-additive model, however the relationship between depth perception and percent correct in a path tracing task was not made clear. Conversely, the data of Ware et al is sub-additive, although the same reservations about the link between the model and the data apply. Also, their experiment resulted in much lower error rates, and ceiling effects were undoubtedly present.
1.4 Motivation for new studies A number of unanswered questions are posed by the above studies. The first and most fundamental question is how much is gained by moving from a 2D to a 3D representation. While a completely general answer to this question can never be expected because the answer must to some extent be task specific, any answer derived from an abstract task such as path tracing in networks of nodes and arcs will generalize to the large set of problems that can be represented in this way. There is also the more profound question related to the issue of how depth information from different cues is integrated in the brain. By measuring task performance with a series of graphs of different sizes under different viewing conditions it should be possible to determine the function relating error rate to graph size for each condition. If these functions appear to belong to the same family we can model their relationship. A second question is whether the results of Sollenberger and Milgram and Ware et al generalize to arbitrary graphs other than trees. This is important because tree layout is a relatively simple, well understood process and it is trivial to lay out a pair of trees in a plane so that they do not overlap. Hence the visualization problem posed by the previous studies could easily be solved without resorting to a 3D display. This is not the case for an arbitrary graph where the layout problem is more difficult and the advantages of 3D visualization may be more pronounced. While much of the work on 2D layout of directed
Ware and Franck
TOG Info Net Vis
June 21, 1995
6 graphs has been directed at minimizing arc crossings, the algorithms are often complex [6]. We hypothesize that 3D visualization will to some extent reduce the graph crossing problem because arcs will no longer appear in the plane of the screen. A third question is what kind of motion is better for perceiving structure in information networks: a) motion induced by perspective coupled to eye position, b) automatic rotation of the object, or c) motion caused by linking the user's hand movements to the object. Both Sollenberger and Milgram and Ware et al. showed advantages of motion in information perception but the kind of motion was different in the two cases: scene rotation in the former case (causing the kinetic depth effect) and head motion in the latter (causing motion parallax). It should be noted that lateral motion of the viewpoint produces a very similar transformation to rotation of the scene about a vertical axis through the center of the scene. This leads to the hypothesis that both kinds of structured transformations may contribute to 3D space perception in similar ways to enhance network comprehension. However, it might be that the active search allowed by viewing modes a) and c) are critical to understanding since under these conditions the user has control over the view of the scene. Experiment 1a was designed to address the first and second of the above questions, while Experiment 1b was designed to supplement 1a which yielded only an incomplete answer. Experiment 2 was designed to address the third question.
2. EXPERIMENT 1a: HOW MUCH BETTER IS A 3D/STEREO DISPLAY FOR PATH TRACING IN A GRAPH? The purpose of this experiment was to provide a quantitative estimate of the improvements in graph understanding offered by adding head coupling and stereo disparity cues to the display. We chose path tracing in a graph as the task, because a graph is a very general data structure used to reprensent an information network. We chose error rates as the dependent variable because the previous studies decribed above [1, 17] have shown this to be highly sensitive to the mode of viewing. In addition, the ability to trace information paths accurately is fundamental to understanding information networks. The answer we were looking for was of the form "adding head coupled stereo increases the size of a graph that can be understood by a factor of X". In order to make such an evaluation we designed an experiment with a range of graph sizes in the hope that the data would yield a family of curves (error rate as a function of graph size) to allow valid comparisons between viewing conditions. Two viewing conditions were used initially. 1) 2D: no stereo, no rotation; the 3D graph was projected onto a 2D plane using an orthographic (parallel) projection by removing Z axis information, hence no depth information was presented. 2) Stereo, head coupled perspective: The correct perspective view was generated for each eye position (continuously updated) using an apparatus as shown in Figures 1 and 2. The perspective was continuously updated based on the measured head position (and derived eye position) of the subject. 2.1 Hardware
Ware and Franck
TOG Info Net Vis
June 21, 1995
7 The equipment used in this experiment consisted of StereoGraphics Corporation's CrystalEyes 3D LCD shutter glasses to provide the stereo, with Logitech Corporation's ultrasonic head-tracking built into the frame of the glasses. The computer used to produce the display was a Silicon Graphics Crimson VGX. In stereo mode this system uses the top and bottom half of the frame buffer for the left and right images respectively. These images are vertically expanded by repeating lines at display time which results in half the vertical resolution and also causes lines to be drawn double thickness in a vertical direction. Another feature of stereo mode is that the monitor runs at 120Hz with each eye receiving a 60Hz update rate because of the synchronized shutter glasses. Figure 2 shows Glenn Franck wearing the CrystalEyes VR 3D LCD glasses. The triangle on top of the monitor is the reference sound source for the microphones embedded in the frames of the glasses. =================================================== Figure 2 Insert 35mm slide image about here =================================================== Figure 2. The experimental setup 2.2 Experimental Procedure The subject's task was to decide whether there was a path of length two connecting two nodes which were highlighted in a randomly laid out graph. On each experimental trial there was either a path of length two (with an intervening node between the two highlighted nodes) or no path, with a 50% probability of each occurring. The computer generated a random, 3D graph consisting of different numbers of nodes, arranged in a simulated 17 cm3 volume. An example is shown in Figure 3. The nodes were divided into three equal-sized groups. Two of these groups were leaf nodes, while the third was a group of intermediate nodes. Each node in one of the leaf groups was connected via arcs to exactly two different nodes in the intermediate group. For n nodes, this produced a total of (4/3*n) connecting arcs. All nodes were placed randomly within the working volume. Unhighlighted nodes were drawn in a dark gray color, while the highlighted ones were bright red; lighting was applied to all nodes to emphasize the three-dimensional effect. The size of each node was set to be 0.4 centimeters on each side. The arcs were white and drawn with double-width (two pixel) lines. Since the arcs were drawn as lines and not polygons, perspective sizing did not affect the apparent size of the lines. Due to the artifact described in section 2.1, the vertical thickness (1.1mm) was double the horizontal thickness (0.53 mm). The background was a flat light gray so as to minimize contrast and the ghosting effects associated with stereo. The screen image is shown in Figure 3 and a stereo pair is illustrated in Figure 4. =================================================== Figure 3 Insert 35mm slide image about here =================================================== Figure 3. This photograph shows a graph containing 78 nodes and 104 arcs as it was displayed on the monitor in the 2D condition. Two of the nodes are colored red. The subject's task was to determine if there was a path of length 2 between the two red nodes.
Ware and Franck
TOG Info Net Vis
June 21, 1995
8
Figure 4. The stimulus patterns consisted of a set of nodes and arcs laid out in a volume and rendered according to a variety of different methods, either with or without stereo and with or without head coupled perspective. This stereo pair is a line drawing simulation of the screen display with 51 nodes and 68 arcs. The images are set up for crossed eye viewing. If they are inverted they can be viewed either with a stereo viewing device or with the eyes parallel (something that requires considerable practice). Five graph sizes were used for each of the two viewing conditions. Graph 1 2 3 4 5
#nodes #arcs 24 32 51 68 78 104 105 140 132 176
This resulted in 10 size/condition combinations. Each of these was examined using two separate sets of 20 trials for each subject giving a total of 40 trials per condition. The graph remained the same throughout a trial set, but for each trial a different pair of nodes were highlighted. The highlighted nodes were actually connected on 50% of the trials, randomly determined. For each subject the experiment was divided into two experimental sessions administered on separate days with a complete set of conditions given on a pseudo-random order on each day. Before beginning the experiment each day, the subject was given a short warm-up which presented two trials under each of the conditions, but only using three of the five complexities (low, middle and high) for each condition. Prior to each block of trials subjects were told which experimental condition to expect. On each trial subjects were given as much time as required to respond which they did by pressing a specified mouse button. The response time and the response validity were recorded. Due to the different graph sizes, and the relatively high numbers of polygons to draw in the more complex scenes, the update rate was reduced to 30 updates per second for all conditions. That is, the scene was redrawn into the frame buffer 30 times per second. However, the video refresh rate was 120 Hz (60 Hz for each eye). The subject wore the stereo glasses regardless of whether the condition required them in order to avoid effects related solely to the reduced luminance caused by the glasses. Eleven subjects took part in this experiment, eight of whom had used similar apparatus and/or graphics systems before. Ware and Franck
TOG Info Net Vis
June 21, 1995
9
2D
Stereo head coupled perspective
50
% Error
40
30
20
10
0 0
20
40
60
80
100
120
140
Number of Nodes
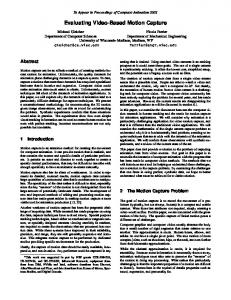
Figure 5. Error rate data from Experiment 1a. Vertical bars represent one standard error about the mean
2.3 Results and Discussion of Experiment 1a The results from Experiment 1a are summarized in Figure 5. As can be seen, the errors in the head coupled stereo condition were dramatically reduced compared to those obtained with the 2D condition. An analysis of variance revealed highly significant main effects, for 2D vs 3D, F(1,100) = 276.8, p < 0.01; the number of nodes F(4,100) = 23.23, p < 0.01, and an interaction between 2D vs 3D and the number of nodes F(4,100) = 7.76, p < 0.01. These results reflect the very large difference in error rates between 2D and 3D conditions, the increase in errors due to graph size, and the fact that the error curve for 3D is relatively flat compared to that for 3D (leading to an interaction). The time data is summarized in Figure 6. An analysis of variance for this data only reveals a significant main effect for the number of nodes, F (4,100) = 10.14, p < 0.01. There was no effect of conditions and no interaction. Since times are clearly increasing with graph size, this data suggests that the important determinant of response time is the number of nodes. A problem with this first experiment was that the results showed a considerably greater advantage to 3D viewing than had been anticipated; we had assumed that the condition with 132 nodes would yield large error rates even in 3D However, the error rate in 3D was low throughout the range of graph sizes tested. Clearly, in order to make a meaningful
Ware and Franck
TOG Info Net Vis
June 21, 1995
10 estimate of the relative advantages of 3D over 2D, a considerably larger graph was needed in the 3D condition. Experiment 1b was designed to remedy the deficiencies of 1a and we defer further interpretation of the results until after the presentation of Experiment 1b.
2D
Stereo head coupled perspective
Time (seconds)
15
10
5
0 0
20
40
60
80
100
120
140
Number of Nodes
Figure 6. Time data from Experiment 1a. . Vertical bars represent one standard error about the mean
3. EXPERIMENT 1b: Based on the results of Experiment 1a we redesigned the experiment with different ranges of graph complexities for the different conditions. We also added two conditions to help answer the question of the relative benefits of head coupling and stereo. 3.1 Conditions Conditions 1 and 4 were the same as conditions 1 and 2 respectively, of experiment 1a. 1) 2D: no stereo, no rotation; the 3D graph was projected onto a 2D plane using an orthographic (parallel) projection by removing Z axis information, hence no overlap information was available. 2) Stereo perspective: no rotation; this condition made use of a pair of StereoGraphics CrystalEyes LCD shutter glasses to provide the disparity depth cues. 3) Head coupled perspective: the scene's perspective projection changed continuously according to the subject's measured head position; the perspective projection was defined by a single viewpoint centered between the eyes. 4) Stereo, head coupled perspective: same as above, except with stereo. The correct view was generated for each eye position (continuously updated). Ware and Franck
TOG Info Net Vis
June 21, 1995
11
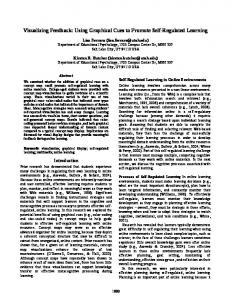
The numbers of nodes used in the different conditions were as follows. 1) 21, 42, 63, 84, 105 2) 51, 81, 111, 141, 171 3) 81, 117, 153, 189, 225 4) 111, 156, 201, 249, 291 To obtain the number of arcs multiply by 4/3. The procedure for Experiment 1b was in most respects identical to Experiment 1a except that the number or trials per condition/size combination was reduced to 12 to keep the session time to a manageable size. This experiment involved 11 participants, six of whom had been exposed to a similar environment before. There was one person from Experiment 1a that took part in Experiment 1b as well. 3.2 Results and Discussion of Experiment 1b Figure 7 summarizes the error data from this experiment, with data from Experiment 1a included for comparison. It shows a sequence of curves with varying gradients which appear to be roughly multipliers of each other with respect to the graph size. That is, error rate appears to be directly proportional to the number of nodes, with a different gradient for the different conditions.
Stereo head coupled perspective (1b) 2D (1a) Stereo head coupled perspective (1a)
2D (1b) Stereo perspective (1b) Head coupled perspective (1b)
50
% Error
40
30
20
10
0 0
50
100
150
200
250
300
Number of Nodes
Ware and Franck
TOG Info Net Vis
June 21, 1995
12 Figure 7. Error data from Experiments 1a and 1b. Vertical bars represent one standard error of the mean. The broad straight lines represent the simple model described in the text. To determine an appropriate model for this family of curves, we ran a series of polynomial regressions independently for each of the four curves. Remarkably, we found that a one parameter fit, of the form Errors = C*N where N is the number of nodes accounted for 95% of the variance. Two and three parameter fits accounted for 98% of the variance. However, these do not allow for comparisons between the different conditions. In view of the success of the one parameter model we decided to adopt it as a reasonable first approximation to the data. Since the lines for the different conditions are multiples of one another it has the advantage of allowing for a direct comparison between the different conditions. The results of this fit are shown as the broad lines in Figure 7. The coefficients for the one parameter fit were as follows: Condition Coefficient value 2D 0.369 Stereo perspective 0.232 Head coupled perspective 0.167 Stereo, head coupled perspective 0.123 On this basis we conclude that the graph that can be understood with head coupled stereo is about 3.0 times as large as the 2D graph for any given error rate (taking the ratios of the gradients). Adding stereo alone appears to increase the comprehensible graph size by approximately a factor of 1.6 and adding head coupling alone appears to increase the comprehensible graph size by a factor of 2.2. To test the significance of these differences we divided the subject means by the number of nodes in each condition to remove covariance due to the diffent numbers of nodes. We then conducted pairwise analyses of variance. The results revealed that each of the four conditions was significantly different from the others with p