acceptor splices sites and called Splice Site Maximum (SSM). In the following section it is demonstrated that without using. PWM, it is possible to predict donor ...
International Journal of Computer Applications (0975 – 8887) Volume 151 – No.5, October 2016
Evaluating the Accuracy of Splice Site Prediction based on Integrating Jensen-Shannon Divergence and a Polynomial Equation of Order 2 Yousef Seyfari
Farzad Didehvar
Hadi Banaee
Department of Mathematics and Computer Science, Amirkabir University of Technology
Department of Mathematics and Computer Science, Amirkabir University of Technology
Center for Applied Autonomous Sensor Systems (AASS) Örebro University
ABSTRACT Advances in DNA sequencing technology have caused generation of the vast amount of new sequence data. It is essential to understand the functions, features, and structures of every newly sequenced data. Analyzing sequence data by different methods could provide important information about the sequence data. One of the essential tasks for genome annotation is gene prediction that can help to understand the features and determine functions of the genes. One of the key steps towards correct gene structure prediction is accurate splice site detection. There are vast numbers of splice site prediction methods, however, a few of them can be incorporated in gene prediction modules because of their complexity. In this paper, a novel model is presented to recognize unknown splice sites in a new genome without using any prior knowledge. Our model is defined based on integrating Jensen-Shannon divergence and a polynomial equation of order 2. Finally, the proposed model is evaluated on Yeast’s genome to predict splice sites. The experimental results suggest that the proposed method is an effective approach for splice site prediction.
General Terms Bioinformatics, Gene structure
Keywords Splice site, Position weight matrix, Entropy.
1. INTRODUCTION In eukaryotes, pre-mRNA transcribed from the DNA sequence contains periodically repeated regions called introns and exons. This kind of RNAs is matured for translation by removing introns and joining exons. This process is called RNA splicing done in a series of interactions between splice sites, exon-intron or intron-exon boundaries, and a complex of snRNAs. Splice sites from the 5’ and 3’ end of introns are named donor and acceptor sites, respectively. Approximately, 99% of the splice sites are canonical where the donor and acceptor sites are identified by the presence of dinucleotides GT and AG, respectively. Finding these sites on the genome are extremely valuable because they can locate the coding regions in a DNA sequence. On the other hand, the mentioned dinucleotides are not sufficient to predict splice sites, because they are frequently appeared at non-splice site positions too [1]. To detect the exact position of donor and acceptor splice sites in the DNA sequences, it is required to find other signals besides the AG and GT dinucleotides.
Fatemeh ZareMirakabad Department of Mathematics and Computer Science, Amirkabir University of Technology
Many computational methods have been proposed for splice site detection. Position weight matrix (PWM) is a common model for splice site prediction [2], [3], [4]. The varieties of PWMs have been used for splice site prediction such as Weight Array Models [5] and Windowed Weight Array Model [6]. Beside of PWM, neural network techniques have been widely applied in splice site detection methods. These methods use the complex non-linear transformation and learn the complex features of locality surrounding of the consensus AG/GT dinucleotides [7], [8]. Support vector machine is another method for splice site prediction [3]. Most of the splice site detection methods focus on the improvement of classification performance [9], [10]. These methods try to search a new splice site based on some known splice sites of other genomes. On the whole, splice site prediction is defined as a search problem where a newly sequenced genome and some known splice sites of other genomes are given as inputs and the goal is to find unknown splice sites on the new genome. One of the famous classification-based methods is support vector machine (SVM), which is an accurate and high-performance method [11]. Since the performance of the SVM-based methods largely depends on DNA encoding method, there are some works to effectively encode DNA for feature extraction [12], [13], [14], [15]. Another approach for prediction splice sites is statistical analysis, recently a statistical method is presented for the prediction of donor splice sites, which is based on dinucleotide dependencies at all possible positions [16]. As a new point of view, this paper defines define splice site prediction as a de novo problem where a new genome is given as an input and the goal is to find unknown splice sites on the genome. In this paper, a novel model based on the specifically observed patterns on the DNA sequence entropic diagram is proposed for de novo splice site prediction. This model is evaluated on the five chromosomes of Yeast to identify the splice sites.
2. EVALUATION AND DISCUSSION In this section, at first sequence data used in the paper are discussed, and then the observation of the local maximum feature and the steps of proposed method based on it are presented.
2.1 Data Sequences To evaluate the proposed model, Yeast Intron database is used that is acquired from an online database called Saccharomyces
28
International Journal of Computer Applications (0975 – 8887) Volume 151 – No.5, October 2016 Genome Database (SGD) [17]. Sixteen splice sites are randomly selected from this database represented in Table 1 to compute Jensen-Shannon Divergence (JSD) value of splice sites and the coefficient of x 2 in polynomial equation is negative in the donor and acceptor splice sites. Based on the JSD value of splice sites and the coefficient of x 2 in the polynomial equation, a de novo model for splice site prediction is defined. The model is tested on chromosomes 2, 4, 5, 7, 8 and 10 of Yeast, which have 12, 17, 7, 12, 5 and 6 splice sites on the forward strands, respectively [18].
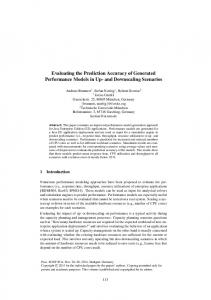
second area is false positive. In Figure 1, it can be seen that the true positive area is matched with the local maximum on that region, but this feature is not held in the false positive cases. This local maximum feature is seen in both donor and acceptor splices sites and called Splice Site Maximum (SSM).
Table 1: Coefficients of polynomial of order 2 for different true donor splice sites.
In
Standard name/ Systematic name RPO26/YPR187W YPR153W RPS23B/YPR132W YIP1/YPR028W SAR1/YPL218W RPL7B/YPL198W RPL7B/YPL198W SPT14/YPL175W RPL33A/YPL143W TAF14/YPL129W RPL21B/YPL079W GCR1/YPL075W RPS10A/YOR293W RPS7A/YOR096W RPL25/YOL127W VPS75/YNL246W
Seq. Length (bases) 544 557 803 676 712 1551 1551 1459 849 840 904 3109 755 974 843 890
a
b
c
- 0.0200 - 0.0440 - 0.0130 - 0.0270 - 0.0028 - 0.0072 - 0.0048 - 0.0319
0.53 0.86 0.22 0.42 0.12 0.11 0.08 0.63
2.09 - 0.90 2.98 0.37 3.89 2.27 2.81 - 0.15
-
-
-
- 0.0740 - 0.0074 - 0.0009 - 0.d 0068 - 0.0109
1.30 0.04 0.01 0.18 0.20
-2.20 4.20 4.90 1.60 3.95
2.2 Observation of the Local Maximum Feature for De Novo Splice Site Prediction Assume that a DNA sequence 𝑆 = 𝑠1 … 𝑠𝑛 is given where 𝑠𝑖 ∈ {𝐴, 𝐶, 𝐺, 𝑇} and the length of sequence is 𝑛, 𝑆 = 𝑛.For each position 𝑖, 𝑖 = 1 … 𝑛, two sub-sequences𝑆𝐿𝑖 ( 𝑆𝐿𝑖 = 𝑛𝐿𝑖 ) and 𝑆𝑅𝑖 ( 𝑆𝑅𝑖 = 𝑛𝑅𝑖 ) are defined on the left and right hands of the position 𝑖, respectively. The difference between 𝑆𝐿𝑖 and 𝑆𝑅𝑖 is computed based on JSD [19] as follow: 𝐶 𝑆𝐿𝑖 , 𝑆𝑅𝑖 = 2ln2(𝑛H 𝑆 − 𝑛𝐿𝑖 H 𝑆𝐿𝑖 − 𝑛𝑅𝑖 H 𝑆𝑅𝑖 ), where 𝑛 = 𝑛𝐿𝑖 + 𝑛𝑅𝑖 and H B , is computed as follows: 𝐻 𝐵 =−
𝑓𝑐𝐵 𝑙𝑜𝑔2 𝑓𝑐𝐵 , 𝑐∈ 𝐴,𝐶,𝐺,𝑇
where 𝑓𝑐𝐵 is the probability of character 𝑐 in the sequence 𝐵. The JSD value is computed on two chosen random DNA sequences 𝑆1 , 𝑆2 of the Yeast’s genome which contain splice sites. Fig. 1 shows the JSD diagram of these sub-sequences. In the following, 20 splice sites of Yeast with length 14 are selected randomly, where 7 nucleotides are chosen from the left and right of the donor splice sites, respectively. Based on these 20 donor splice sites, a PWM4 × 14is constructed. Each subsequence with length 14 is extracted from sequences 𝑆1 and 𝑆2 and scored by PWM. All sub-sequences with score above 0.9 are selected as donor splice sites. In Fig. 1, JSD diagrams contain two marked areas. These marked areas show the results of predicted sub-sequences by PWM. In both diagrams, the first predicted area is true positive and the
In the following section it is demonstrated that without using PWM, it is possible to predict donor and acceptor splice sites with finding the best local maximum (SSM region) in JSD diagram by a polynomial equation of order 2.
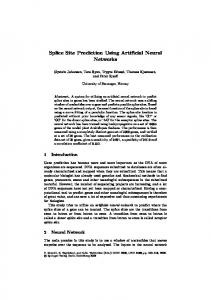
2.3 Fitting a Polynomial of Order 2 on Donor and Acceptor Splice Sites Fig. 2, JSD value on each potential splice site is computed and then the small region around the real splice site (red region) is extracted, the magnitude of that region is shown on the right hand. One of the local maximums (SSM region) in the red region shows the real splice site. To recognize the best local maximum as a splice site, a polynomial equation of order 2 is fitted on the extracted region. The extracted JSD of the donor splice site is shown on the left hand of Fig. 3.The estimated polynomial of order 2, 𝑦 = −0.01𝑥 2 + 4.4𝑥 − 4.6𝑒 + 2,is presented on the right hand of Fig. 3. Fig. 4 shows another sample of SSM for an acceptor splice site. In the following, it is shown that the coefficient of 𝑥 2 in polynomial equation can be negative to show the local maximum for donor and acceptor splice sites. Table 1 contains the coefficients of different donor splice sites in Yeast genome after fitting polynomial function. This table has five attributes including columns standard name/systematic name and sequence length which represent the name and length of the intron sequences in Yeast Intron Database, respectively. Columns a, b, and c represent the coefficients of 𝑥 2 , 𝑥 and 𝑦 intercept, respectively.
2.4 Calculating the JSD and SSM Intervals Determining the appropriate intervals for computing JSD (finding local maximums) and SSM (fitting a polynomial equation around each local maximum) helps to decrease the false splice site prediction. Two sets of Yeast data are applied for finding the best intervals for both JSD and SSM. Finding the appropriate JSD and SSM values for real splice sites are dependent to consider the number of nucleotides around the donor or acceptor dinucleotides.
2.4.1 Calculating the Appropriate Interval for the SSM To find the best intervals for SSM, two sets of splice sites are used. For the first one, all splice sites on Chr2 of Yeast on the forward (+) strand are employed. For the second one, all splice sites shown in Table 1 are used. The left part of Table 2 illustrates the study results of SSM for different intervals of acceptor splice sites on two data sets. In Table 2, the intervals like −2: +13 are subsequences that have the following pattern:𝑥𝑥𝐴𝐺𝑥𝑥𝑥𝑥𝑥𝑥𝑥𝑥𝑥𝑥𝑥, 𝑥 represents arbitrary nucleotide (𝐴, 𝑇, 𝐶 𝑜𝑟 𝐺) and dinucleotide 𝐴𝐺 represents canonical acceptor splice site signal.
29
International Journal of Computer Applications (0975 – 8887) Volume 151 – No.5, October 2016 SSM is −8: +7 predicting 14 donor splice sites out of 16.
Fig. 2. (Left) Diagram of Jensen-Shannon divergence of W026/YBL2LSM sequence. Donor splice site of this sequence starts from position 200 to 213 which is colored red. (Right) The magnitude of Donor splice site.
Fig. 1. The results of Jensen-Shannon divergence on the Yeast sub-sequences. Table 2: Result of different SSMs for acceptor splice site (AG) and donor splice site (GT)
Interval of SSM calculation
-2:+13 -3:+12 -1:+14 0:+15 -4:+11 -5:+10 -6:+9 -7:+8 -8:+7 -9:+6 -10:+5 -11:+4 -12:+3 -13:+2 -14:+1
Number of correctly predicted splice sites (true positive) Acceptor splice site Donor splice site (AG) (GT) Chr 2. 2nd data Chr 2. of 2nd data of Yeast set Yeast set 7 11 5 8 8 9 6 8 6 12 5 9 6 10 5 7 9 10 8 9 11 10 9 10 12 12 8 12 12 10 6 13 12 10 6 14 12 10 6 13 12 10 7 12 12 9 7 12 11 7 6 12 10 7 6 8 8 6 6 8
Table 2 shows that intervals −6: +9, −7: +8, −8: +7, −9: +6, −10: +5 and −11: +4 are able to predict all splice sites on Chr2 of Yeast and −1: +14 and −6: +9 intervals for the second data set with 4 unpredicted splice sites provide the minimum error. The mentioned intervals can predict all the acceptor splice sites for the first data set. Also, these intervals are appropriate for the second data set, because the number of unpredicted splice sites in this data set is significantly low. A similar study on acceptor splice sites has been applied on donor splice site for two above data sets of Yeast. The results are also presented on the right hand of Table 2. On Chr 2 of Yeast, the best interval is −5: +10 predicting 9 donor splice sites out of 12. On the second data set, the best interval for
Fig. 3. (Left) The red part of Figure 2 is extracted. (Right) Fitting with polynomial of order 2, resulting polynomial is 𝐲 = −𝟎. 𝟎𝟏𝐱 𝟐 + 𝟒. 𝟒𝐱 − 𝟒. 𝟔𝐞 + 𝟐.
Fig. 4. Acceptor splice site positions 170796 through 170810 of chromosome 2 of Yeast. (Left) Jensen-Shannon Divergence in splice site positions. (Right) Acceptor splice site after fitting with polynomial of order 2, resulting polynomial is: 𝐲 = −𝟎. 𝟎𝟎𝟕𝟖𝐱 𝟐 + 𝟎. 𝟏𝟕𝐱 + 𝟏. 𝟗.
2.4.2 Calculating the appropriate interval for JSD To find the best intervals for computing the JSD value, the process started with a window contained 14 nucleotides around of the real acceptor splice sites. In each step, the size of the window is extended to 25 nucleotides from left or right, until the best window size is reached. This study shows that the best size of the window is 100 nucleotides before splice site and it ends 225 nucleotides after splice site. The same study as the acceptor splice site is done also for donor splice sites. The observation is that the best interval is again 100 nucleotides before the donor splice site and it ends 125 nucleotides after donor splice site.
3. A NEW MODEL FOR DE NOVO SPLICE SITE PREDICTION Based on the observation in the previous section, the following algorithm is presented for finding donor and acceptor splice sites in the sequence S : 1.
For each GT dinucleotide of the sequence S considered as a potential donor splice site (AG dinucleotide considered as a potential acceptor splice site), a sub-sequence from
30
International Journal of Computer Applications (0975 – 8887) Volume 151 – No.5, October 2016 -100:125 (-100:225) is extracted. 2.
For each potential splice site dinucleotide, JSD value is computed.
3.
For each local maximum based on SSM intervals, the polynomial equation of order 2 is fitted.
4.
Each local maximum area with negative coefficient of x 2 is predicted as a splice site
chromosomes is almost fixed and also the sensitivity is high. The sensitivity of our method on donor splice sites is almost stable but it varies on acceptor splice sites, however, the average sensitivity of acceptor splice sites is higher than donor splice sites.
5. CONCLUSION
Table 3: Coefficients of polynomial of order 2 for different false donor splice sites. Chromo some chr4 chr4 chr4 chr4 chr05 chr05 chr07 chr07 chr08 chr08 chr10 chr10
start position : finish position 1403101:1403426 1425976:1426301 460723:461048 889511:889836 437923:438248 316369:316694 382482:382807 674297:674622 176845:177170 292239:292564 381364:381689 564901 : 565226
a
b
c
0.0017 -0.0086 0.00024 0.012 0.012 0.0028 0.0015 0.0094 -0.00055 0.0025 0.0014 0.01
- 0.038 0.19 - 0.025 - 0.3 -0.19 -0.063 -0.11 -0.15 0.022 -0.046 -0.051 -0.071
5.6 4.5 3.3 4.9 3.3 4.8 3.6 2.7 6 2.5 5.6 1.7
4. EVALUATING THE MODEL In this section, at first, it is shown that the observed SSM in splice sites is not arbitrary by testing this criterion on twelve randomly selected false splice sites from different chromosomes of the Yeast. The results, illustrated in Table 3 are very interesting. It is clear that from 12 false splice sites SSM is not holding in 10 and there are just two cases that result of SSM is false positive. Also, the proposed model is verified on Chrs 4, 5, 7, 8 and 10 of Yeast. To evaluate the accuracy of the model, sensitivity (Sn) and specificity (Sp) are computed as follows: 𝑆𝑛 =
𝑇𝑃 , 𝑇𝑃 + 𝐹𝑁
𝑆𝑝 =
𝑇𝑁 , 𝑇𝑁 + 𝐹𝑃
Table 4: Sensitivity and Specificity of the SSM on different chromosomes of yeast Measure
Chr 4 Chr 5 Chr 7 Chr 8 Chr 10
Acceptor splice site (AG) Sensitivity Specificity 0.941176 0.514139 1 0.508462 0.75 0.512025 0.8 0.511932 1 0.513019
This method can be extended using combining it with training based method such as PWM. Also, this method can be used within evolutionary algorithm (EA) methods such as genetic algorithm (GA) or particle swarm optimization (PSO) in order to predict splice sites.
6. REFERENCES [1]
Burset M., Seledtsov I. A., and Solovyev V. V. 2000. Analysis of canonical and non-canonical splice sites in mammalian genomes. Nucleic acids research 28, no. 21 4364-4375.
[2] Staden R. 1984. Computer methods to locate signals in nucleic acid sequences. Nucleic acids research 12, no. 1: 505-519. [3] Li J. L., Wang L. F., Wang H. Y., Bai L. Y., and Yuan Z. M. 2012. High-accuracy splice site prediction based on sequence component and position features. Genetics and Molecular Research 11, no. 3: 3432-3451. [4] Tavares L. G., Lopes H. S., and Lima C. R. E. 2009. Evaluation of weight matrix models in the splice junction recognition problem. IEEE International Conference on Bioinformatics and Biomedicine Workshop, 2009: 1419. [5] Zhang M. Q., and Marr T. G. 1993. A weight array method for splicing signal analysis. Computer applications in the biosciences: CABIOS 9, no. 5: 499509.
where TP, FP, TN and FN show the number of truly predicted splice sites, the number of falsely predicted splice sites, the number of truly predicted non-splice sites and the number of falsely predicted non-splice sites, respectively.
Chrom osome
In this paper, a new criterion for de novo splice site prediction is introduced that is based on finding the best local maximum in JSD diagram by a polynomial equation of order 2. This method does not need any prior training and its accuracy and specificity are acceptable and its sensitivity is high enough for an initial start point of the process of predicting splice sites. To find splice sites in a brand new genome without any available training data, this method can be used as an initial method.
Donor splice site (GT) Sensitivity 0.823529 0.857143 0.833333 1 0.833333
Specificity 0.511960 0.512083 0.517706 0.513812 0.514163
[6] Burge C., and Karlin S. 1997. Prediction of complete gene structures in human genomic DNA. Journal of molecular biology 268, no. 1: 78-94. [7] Nassa T., Singh S., and Goel N. 2013. "Splice Site Detection in DNA Sequences using Probabilistic Neural Network." International Journal of Computer Applications 76, no. 4: 1-4. [8] Baten A. K. M. A., Halgamuge S. K., and Chang B. CH. 2008. Fast splice site detection using information content and feature reduction. BMC bioinformatics 9, no. Suppl 12: S8. [9] Wei D., Zhang H., Wei Y., and Jiang Q. 2013 A novel splice site prediction method using support vector machine. Journal of Computational Information Systems 9, no. 20: 8053-8060. [10] Wei D., Zhuang W., Jiang Q., and Wei Y. 2012. A new classification method for human gene splice site
Table 4 shows, the specificity of our model on five different
31
International Journal of Computer Applications (0975 – 8887) Volume 151 – No.5, October 2016 prediction. In Health Information Science. Springer Berlin Heidelberg, HIS 2012: 121-130. [11] Goel N., Singh S., and Aseri T. C. 2015. An Improved Method for Splice Site Prediction in DNA Sequences Using Support Vector Machines. Procedia Computer Science, 57: 358-367. [12] Bari A. G., Reaz M. R. and Jeong B. S. 2014. Effective DNA Encoding for Splice Site Prediction Using SVM. Math-Communications in Mathematical and in Computer Chemistry, 71(1): 241-258. [13] Salekdeh A. Y. and Wiese K. C. 2011. Improving splicejunctions classification employing a novel encoding schema and decision-tree. In Congress on Evolutionary Computation (CEC): 1302-1307. [14] Wei D., Zhuang W., Jiang Q., and Wei Y. 2012. A new classification method for human gene splice site prediction. In Health Information Science. Springer Berlin Heidelberg: 121-130.
IJCATM : www.ijcaonline.org
[15] Huang J., Li T., Chen K., and Wu J. 2006. An approach of encoding for prediction of splice sites using SVM. Biochimie, 88(7): 923-929. [16] Meher P. K., Sahu T. K., Rao A. R., and Wahi S. D. 2014. A statistical approach for 5′ splice site prediction using short sequence motifs and without encoding sequence data. BMC bioinformatics, 15(1): 362-376. [17] Saccharomyces Genome Database, http://www.yeastgenome.org/
Available online:
[18] Román-Roldán R., Bernaola-Galván P., and Oliver J. L. 1998. Sequence compositional complexity of DNA through an entropic segmentation method. Physical Review Letters 80, no. 6: 1344-1347. [19] Bernaola-Galván P., Grosse I., Carpena P., Oliver J. L., Román-Roldán R., and Stanley H. E. 2000. Finding borders between coding and noncoding DNA regions by an entropic segmentation method. Physical Review Letters 85, no. 6: 1342-1345.
32