mation retrieval, the existing search engine evaluation papers are .... Direct display of best match. 2.2. .... The final ranking of documents are calculated as.
EVALUATION AND COMPARISON OF SEARCH ENGINES USING THE LSP METHOD Jozo Dujmović and Haishi Bai Department of Computer Science San Francisco State University We present a comprehensive model for quantitative evaluation and comparison of search engines. The model is based on the LSP method for system evaluation. The basic contribution of our approach is the aggregation of all relevant attributes that reflect functionality, usability, and performance of search engines. In this respect our model is fully consistent with the ISO 9126 standard for software product evaluation. Performance analysis of competitive search engines is based on our search engine benchmarking tool (SEben) that is also described in the paper. 1. Introduction Search engines were introduced in 1994 and the first attempts to develop techniques for their evaluation were published in 1996 [CHU96]. During the period of ten years the search technology made a dramatic progress [BRI98, BAE99, SPA97, CHA03, HAW06] and currently search engines are the most influential web tools. A survey of some major search engines is presented in Table 1. Some of the engines use proprietary search technology (PST), some of them are meta search engines that distill and aggregate results of multiple PST search engines, and some of them offer specialized search services using a selected PST provider. General search services are accessible through all web browsers (e.g. Netscape) and are also offered by Internet service providers (e.g. AOL). According to a study conducted by Nielsen NetRatings in July 2006 [SUL06] out of the 5.6 billion searches placed in that month, the leading GYM trio (Google, Yahoo, Microsoft) handled more than 80% of total traffic, with Google taking a leading 49.2% (see Table 1 and [BAE99] for a very different distribution in 1998). Regardless a visible industrial interest in search engine companies (e.g. see [SEW06, SEG06, GAR06]), and intensive research in the area of information retrieval, the existing search engine evaluation papers are restricted to evaluating only selected aspects of search technology [CHU96, JAN03, TAN03]. Search engines are not quantitatively evaluated as complex industrial products that are designed to satisfy user requirements. In this paper we focus on building a comprehensive model for evaluation and comparison of general PST search engines. Our model reflects the ability of
Table 1. A survey of English-focused search engines Search Begin Traffic Type Engine [year] July’06 May’06 Aliweb 1993 PST WebCrawler 1994 Meta Infoseek/Go 1994 Provider Lycos 1994 PST Altavista 1995 Provider Excite 1995 Meta Mamma 1996 Meta Dogpile 1996 Meta Ask 1996 2.6% PST Google 1998 49.2% PST AlltheWeb 1999 Provider Teoma 2000 Provider Vivisimo 2000 PST Kartoo 2001 Meta AOL Search 2003 6.3% Provider Yahoo! Search 2004 23.8% PST MSN Search 2004 9.6% PST A9 2004 PST Snap 2004 PST Quaero 2006 PST search engines to satisfy user requirements. The experimental part of the paper includes the evaluation of four leading PST search engines: Yahoo! Search, Ask, Google, and MSN. Our criterion includes the needs of both nonprofessional and professional searches, and our benchmark searches reflect this standpoint. The results of performance measurement are then aggregated with all attributes that reflect the functionality and usability of search engines to generate a compound indicator of the overall quality.
Our evaluation method is presented in the following five sections. We first introduce the search engine user models, and then the search engine attributes that are the basis of the evaluation model. The attributes include performance and quality of information retrieval that are measured using a specialized tool, which is presented in a separate section. Then we present an outline of the LSP evaluation method. Finally, we present a comprehensive LSP criterion for search engine evaluation and the evaluation results. 2. Search engine user models All parameters of search engine evaluation model, as well as the search engine benchmark workload, reflect a specific model of the search engine user. We characterize users using two attributes: (1) volume, and (2) significance of search. The volume is measured in searches per day of a specific topic. The significance is characterized as “low” if the search is purely recreational (as the majority of searches in Table 3). The significance is “high” if the results of search affect professional success, health, security, family activities, etc. Two characteristic types of users are shown in Table 2. Table 2. Characteristic search engine users SymType of search Volume Significance of search of search bol engine user GP General popuHigh Low lation SU Specialized Low High user Short-term high-intensity search traffic is generated by special events that cause high level of public interest. Such events are illustrated by the search frequency distribution shown in Fig. 1 [GOG06b]. After important events (e.g. natural disasters, globalscale diseases, terrorist attacks, events related to celebrities, etc.) the frequency of searches related to such event rapidly increases, reaches the maximum, followed by an almost exponential decrease, similar to the Rayleigh or log normal distributions. In many cases the interest in special events fades out rather quickly and does not affect the top 10 yearly queries that characterize the GP user. The GP user is defined using the statistics of most frequent requests obtained from search engine traffic monitors. The GP traffic is dominated by large public interest in special (sometimes accidental) events and popular public personalities. Table 3 shows an example of the top 10 Google queries [GOG06a] that illustrate the worldwide activity of the GP user during the year 2003.
Table 3. Top 10 Google queries in year 2003 1 Prince Charles 2 Eastenders 3 Winnie the Pooh 4 Jonny Wilkinson 5 Easyjet 6 David Beckham 7 Michael Jackson 8 2 fast 2 furious 9 Paris Hilton 10 Simpsons Frequency (searches per day)
t e ve n t
time
Figure 1. A typical event search frequency The SU search load is generated by many categories of special interest user groups, where the most important are professional searches. Typical such searches are related to the activities of students and professionals in various disciplines, such as computer science, medicine, law, etc. A significant fraction of high importance search activities is related to search of literature. 3. Search engine quality attributes General models for software quality evaluation have been analyzed by many authors [BOE78, FEN97] and standardized by ISO [ISO91] and IEEE [IEE93]. The basic idea to evaluate software from the standpoint of its operation and upgrading is shown in Fig. 2. In the case of search engines the general software quality model must be modified to reflect specific features of search engines. First, from the end user standpoint it is only interesting to evaluate the operation of the software product. Consequently, the performance evaluation area must be expanded with the evaluation of information retrieval quality. At the same time, the reliability group is found not to be critical and can be omitted. This approach yields the following tree of attributes that affect the ability of search engines to satisfy user requirements: 1. Functionality 1.1. General search methods
1.1.1. Basic search 1.1.1.1. Single keyword 1.1.1.2. Multiple keyword 1.1.1.3. Phrase 1.1.2. Advanced search 1.1.2.1. Boolean expression 1.1.2.2. Number range search 1.1.2.3. Negative terms 1.1.3. Non-English search 1.1.4. Multimedia search 1.1.4.1. Images 1.1.4.2. Video clips 1.1.4.2.1. Categorization of material 1.1.4.2.2. Popularity rating 1.1.4.2.3. Search criterion 1.1.4.3. Audio clips 1.1.5. Extended search 1.1.5.1. Case-sensitive search 1.1.5.2. Common words exclusion 1.1.5.3. Word variations (plural etc.) 1.1.5.4. Use of synonyms 1.2. Data filters 1.2.1. Adult content 1.2.2. Time filters 1.2.2.1. Last update time 1.2.2.2. Time interval 1.2.3. Domain/page/link filtering 1.2.3.1. Domain or site 1.2.3.2. Location in page 1.2.3.3. Linked pages 1.2.3.4. Keyword frequency in page 1.2.3.5. Pages from same site 1.2.4. Miscellaneous filters 1.2.4.1. Access rights 1.2.4.2. Countries 1.2.4.3. File types 1.2.4.4. RSS file format support 1.2.4.5. Similar pages 1.3. Topic-specific search 1.3.1. Technologies 1.3.2. Academic 1.3.3. Local life 1.3.4. Maps 1.3.5. Blog 2. Usability 2.1. Operability 2.1.1. Visibility of functionality 2.1.2. Ease of customization 2.1.3. User interface quality 2.1.4. Direct display of best match 2.2. Result presentation 2.2.1. Customizable page size 2.2.2. Customizable ranking of results 2.2.3. Availability of cached results 2.3. Learnability 2.3.1. On-line help (short references)
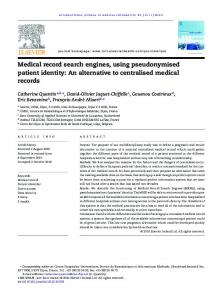
2.3.2. User manual (book quality) 2.3.3. Independent literature 2.3.4. Tutorial (learning by example) 2.3.5. Frequently asked questions 3. Performance of information retrieval 3.1. Measured response time 3.1.1. Time to return first page 3.1.2. Time to return first 100 records 3.2. Resource consumption 4. Quality of information retrieval 4.1. Coverage 4.2. Recall 4.3. Precision 1. Operation of software product 1.1 Functionality (Suitability, Accuracy, Security, Interoperability, Compliance) 1.2 Usability (Understandability, Learnability, Operability) 1.3 Performance (Processing time, Throughput, Resource consumption) 1.4 Reliability (Maturity, Fault tolerance, Recoverability) 2. Upgrading of software product 2.1 Maintainability (Analyzability, Changeability, Stability, Testability) 2.2 Portability (Adaptability, Installability, Conformance, Replaceability) 2.3 Reusability (Structuredness, Conciseness, Self-descriptiveness, Device independence) Figure 2. General attributes of software quality 4. SEben – a search engine benchmarking tool In this section we describe SEben, our search engine benchmarking tool. SEben is based on the following design goals: • Measurement of information retrieval quality • Measurement of response time • Comparison of competitive search engines • Continuous measurement that determines distributions of performance indicators • Extensibility to support more search engines The global organization of SEben is shown in Fig. 3. The performance measurement consists of C cycles, where each cycle selects one of b information retrieval benchmark queries (Q1,…,Qb), and applies this query to all n analyzed search engines. Measured performance values (quality of search, response time, etc.) are stored in a performance database, and the accumulated data are processed at the end of measurement to compute global performance indicators for each search engine.
count = 0
selector = count % b + 1 1
b
2
Q1
Qb
Q2
SE1 Performance
SE2
Database
SEn No
++count ≥ C
Compute performance indicators
Figure 3. The organization of the SEben tool
The core functionality of SEben is exposed as a Web Service that receives test requests from Web UI, Windows scheduled tasks, or other client applications (Fig.4). The test requests are then forwarded to various search engine classes, which inherit from one base class. The base class encapsulates common functionalities such as sending HTTP request, retrieving response stream, etc. All test results, including both collected metrics and retrieved URL’s, are logged to the performance database. The performance database contains several tables. The most important are the summary table (containing response time for the first page, the cumulative response time for all retrieved pages, the number of bytes per each page, and the total number of retrieved URL’s) and the detailed table (containing all retrieved unique URL’s). We also collect time stamps and other data necessary for analyzing distributions of measured values. This design provides a reusable framework for search engine evaluation, and new search engines can be supported by creating new search engine classes. Engine-specific code only needs to implement two methods: GetSearchAddress, which accept keywords and format a query string following specific format defined by the target engine; and GetSearchResult, which parses acquired HTTP response stream to collect returned URL’s. In the following sections, we’ll introduce theoretical backgrounds of information retrieval quality measurements implemented in SEben. 4.1 Measurement of server response time
Search Engines on Internet Google
Msn
…
Yahoo!
Search Engine Base Class Test Request
Test Result
Test Service
Web UI
Scheduled Task
Result Database
Client applications
Let us define the server response time is the time that a search engine needs to execute a query and to generate the result set. Although most of search engines display server response times on result pages, we decided to find an independent measurement to verify these claims. In order to eliminate effects of network delays, we measured the server response time in the following way: 1)
Figure 4. SEben input and output Our benchmark queries (initially b>300) reflect the GP and SU user models and include most popular search topics reported by Yahoo! Search, MSN, and Google in the past 6 years. When both monthly data and yearly data are available, yearly data are used. For example, one of our query sets was taken from Google Zeitgeist Archive [GOG06b].
2) 3)
An empty search request (the search without any keyword) is submitted to the search engine. The total response time between when the request is sent and when HTTP response stream is acquired is recorded as t1. Immediately after we get response from step 1, we send out actual search request and the corresponding response time t2 is recorded. The server response time is t2 - t1.
The rational behind this measurement is simple: both t2 and t1 contain three components: the time for
the request packet to be routed to search engine, the time for search engine to process the request, and the time to establish response stream connection. By subtracting t1 from t2, we eliminated factors affected by network transportation, assuming consecutive request packets are routed in similar routes. At the same time, we tried to eliminate the effect of caches by sending unique queries, which are composed by combining keywords from different workloads. Theoretically, if D denotes the set of all relevant documents and A is the set of answers returned by the search engine, then the main performance indicators are precision |D∩A|/|A| and recall |D∩A|/|D| (here |A| denotes the number of elements in the set A). Unfortunately, in the case of web search engines we cannot directly measure D and A, and exactly compute precision and recall. Below, we present approximate methods for measuring precision, recall and coverage.
⎧ r (i ), (i ) ⎪ j Rj = ⎨
U j ∈ {u1(i ), u2(i ) ,..., uk(i ) }
⎪k + 1, U j ∉ {u(i ), u(i ) ,..., u (i ) } k 1 2 ⎩
,
j = 1,..., m
Here r j( i ) ∈ {1,..., k } is the ranking assigned to U j by search engine i. The final ranking of documents are calculated as average value of
Rj =
1 n
R (ij ) : n
∑ R(ji )
j = 1,..., m
i =1
The first k documents with highest final ranking are selected as the final collection of all relevant documents to be studied, denoted as U. Finally, the precision Pi of search engine i can be defined as: Pi =
| U ∩ {u1(i ) ,...., uk(i ) } | k
, 0 ≤ Pi ≤ 1, i = 1,..., n
4.2 Measurement of precision
4.3 Measurement of recall Precision of search is defined as the ratio of the number of retrieved relevant documents |D∩A| and the number of all retrieved documents |A|. Most of existing studies are based on manual scoring systems to decide relevancy of documents. As our goal is to establish a framework of automatic repetitive low-cost tests, an alternative measurement is required. A statistical analysis in [JAN03] shows that 73% of users only viewed 2 documents out of all retrieved documents. In addition, 53% of users were able to find wanted document using only one query. The results show that the quality of ranking is crucial to fulfill user search requirements, because the majority of users only browse very few documents in the result set. Furthermore, the existing ranking algorithms can ensure that statistically most relevant documents are ranked highest. Given this result, we limited our analysis to first k documents returned by search engines. Suppose that our analysis includes n search engines and the number of reported URL’s for each search engine is limited to k. Let U1,...,Um be all the different URL’s collected by n search engines and k ≤ m ≤ nk. Then, let
u1( i ) ,..., uk(i ) denote sorted URL’s returned by search engine i, where index r in ur( i ) denotes the rank (r=1 is the most important and r=k is the least important ac(i ) cording to search engine i). Let R1( i ) ,..., Rm be the
ranking assigned to U1,...,Um by search engine i according to the following formula:
Recall is the fraction of all relevant documents that is returned by a search engine. Obviously, it is not possible to collect all relevant documents from the web. However, recalls of different engines can be compared using relative ratios. For a specific search, let D be the (unknown) set of all relevant documents. Then D ∩ A1,..., D ∩ An are the sets of relevant documents returned by search engines 1,…,n. The recall of search engine i can be defined as follows: | D ∩ Ai | |D| For any pair of search engines i and j: Ci =
D ∩ Ai D D ∩ Ai Ci = ⋅ = Cj D D ∩ Aj D ∩ Aj
For search engine i, we approximate D ∩ Ai by the result sets we collected during precision measurements: D ∩ Ai ≈ U ∩ {u1(i ) ,...., uk(i ) } U is the collection of documents that all participating search engines voted to be relevant. A document returned by search engine i is considered relevant if and only if the document belongs to U as well. 4.4 Measurement of coverage The coverage of a search engine can be determined as the total number of pages returned by the
search engine. It is impractical to physically measure the absolute coverage of search engines because that would require us to develop a crawler that is superior to existing crawlers and is able to find all documents on the Internet. On the other hand, measuring relative coverage sizes of search engines is possible, as suggested in [BHA97]. We adopted the approximation formula proposed in [BHA97], which gives a relative ratio of coverage. Let A be the set of all pages indexed by the search engine E1, and let B be the set of all the pages indexed by search engine E2. Then, for any random URL u from Internet, the probability of u ∈ A and the probability of u ∈ B are proportional to sizes of A and size of B:
| A | Pr (u ∈ A) ≈ | B | Pr (u ∈ B ) Using the conditional probability rule we have P (u ∈ A ∩ B ) Pr (u ∈ A) = r Pr (u ∈ B | u ∈ A) Pr (u ∈ B ) = | A| = |B|
Pr (u ∈ A ∩ B ) Pr (u ∈ A | u ∈ B )
Pr (u ∈ A | u ∈ B ) Pr (u ∈ B | u ∈ A)
This formula assumes that sampled documents are uniformly distributed, and the accuracy of the formula is affected by recalls of analyzed engines. A more complete discussion of this model can be found in [BHA97] where the authors used a lexicon of 40,000 words and Yahoo to generate sample documents. In our measurement, we used so far over 10,000 documents retrieved using PST search engines that are not among the competitive search engines. Although the sample does not necessarily represent the actual web word distribution, it is a fairscaled, diverse selection over space and time. In addition, using independent PST search engines eliminates the possible bias caused by using one of the analyzed search engines as data source. In all performance indicators (coverage, recall and precision) we normalize the measured values with the value that corresponds to the best system. In this way the best system has relative quality 1 (or 100%) and all other systems have lower values. These normalized (relative) values are then used as inputs for the evaluation criteria. 5. LSP method for system evaluation
System evaluation is a process of determining the extent to which a given system satisfies a set of requirements specified by a human decision maker (evaluator). This definition implies that the evaluated
system has users, and users expect that the system can satisfy their requirements. The LSP method [DUJ96, DUJ97, DUJ06] essentially consists of three steps: • Creating a system attribute tree • Defining elementary criteria • Development of preference aggregation structure The system attribute tree (SAT) is a decomposition structure that includes all system attributes that affect the ability of the evaluated system to satisfy user requirements. The SAT presented in Section 2 includes two types of attributes: compound attributes (that can be further decomposed) and terminal attributes (called performance variables) that cannot be further decomposed and can be directly evaluated. Performance variables are evaluated using elementary criterion functions that map the values of performance variable to the corresponding preference score. The preference score is the degree of satisfaction of requirements and its range is from 0 to 1 (or 100%). For example, if the requirement is that a search engine response time t greater than tmax seconds is unacceptable, and the time that is less than tmin seconds satisfies completely user expectation, then the corresponding preference score E is
E = 100min{1, max[0, (tmax − t ) /(tmax − tmin )]} 0 ≤ E ≤ 100% This mapping can be conveniently expressed using the preference scale shown in Fig. 5. Similar elementary criteria can be defined for all n performance variables, and from these criteria we get an array of elementary preferences: E1,..., En . Using these elementary preferences we can compute the global preference E = L(E1,..., En ) that reflects the total satisfaction of all requirements. Response time
tmin 0 10
tmax 20 30 40 50 60 70 80 90 100 Elementary preference [%]
Figure 5. An example of elementary criterion To compute the global preference we must use preference aggregation structure that consists of superposition of appropriate aggregation operators. We assume that no system can be better than its best component, or worse than its weakest component. Consequently, the preference aggregators should be organized as means. Some components of an evaluated system are al-
ways more important than other components. So, if we use means to aggregate elementary preferences, then the selected means must have adjustable weights. We use preference aggregators based on weighted power means; an aggregator that has k input preferences e1,..., ek generates the output preference e0 = (w1e1r + ... + w k ekr )1/ r 0 < w i < 1, w1 + ... + w k = 1 0 ≤ ei ≤ 1,
i = 0,1,..., k
The weights w1,...,w k reflect the relative importance of inputs e1,..., ek , and the exponent r reflects the logic properties of the aggregator. Such aggregator is graphically presented in Fig. 6 and a survey of all basic aggregators is presented in Table 4.
w1
e1
e0
r
wk
ek
Figure 6. A preference aggregator (power mean)
Pure Conjunction
Neutrality
C+ C++
C
C+-
CC-+
DD--
D D-+
D+ D+-
D++
E -9.06 -1.66 -0.15 0.62 1.45 2.79 5.8 20.6 1 r:-3.51 -0.72 0.26 1 2.02 3.93 9.52 strong medium
weak
Conjunctive polarization
ANDOR (PC) -∞