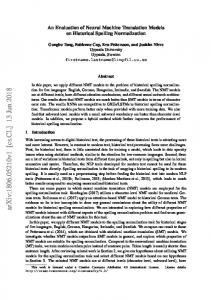
Apr 23, 2014 - 3 Linux Kernel Virtual Machine. In our experiments we used the Linux Kernel Virtual Ma- chine (KVM) [14]. KVM is an example of a hosted VM.
Evaluation of an RTOS on top of a hosted virtual machine system Mehdi Aichouch, Jean-Christophe Prevotet, Fabienne Nouvel
To cite this version: Mehdi Aichouch, Jean-Christophe Prevotet, Fabienne Nouvel. Evaluation of an RTOS on top of a hosted virtual machine system. Design and Architectures for Signal and Image Processing (DASIP), 2013 Conference on, Oct 2013, Cagliari, Italy. pp.290-297, 2013.
HAL Id: hal-00982172 https://hal.archives-ouvertes.fr/hal-00982172 Submitted on 23 Apr 2014
HAL is a multi-disciplinary open access archive for the deposit and dissemination of scientific research documents, whether they are published or not. The documents may come from teaching and research institutions in France or abroad, or from public or private research centers.
L’archive ouverte pluridisciplinaire HAL, est destin´ee au d´epˆot et `a la diffusion de documents scientifiques de niveau recherche, publi´es ou non, ´emanant des ´etablissements d’enseignement et de recherche fran¸cais ou ´etrangers, des laboratoires publics ou priv´es.
Evaluation of an RTOS on top of a Hosted Virtual Machine System Mehdi Aichouch, Jean-Christophe Pr´evotet and Fabienne Nouvel Institut d’Electronique et de T´el´ecomunications de Rennes INSA Rennes
Abstract In this paper we evaluate a virtualized RTOS by detailing its internal fine-grained overheads and latencies rather than by providing more global results from an application perspective, as it is usually the case. This approach is fundamental to analyze a mixed criticality real-time system where applications with different levels of criticality must share the same hardware with different operating systems. This evaluation allows to observe how the RTOS behaves when deployed on top of a virtual machine system and to understand what are the key features of the RTOS which impact the performance degradation.
1 Introduction The availability of multicore system-on-chip equipped with an instruction set architecture that support virtualization offers an interesting solution to deploy multiple operating systems on the same hardware which reduce the number of electronic devices in the case of an embedded system. For example, in the domain of automotive systems, multicore systems offer the opportunity to dedicate real-time operating systems to specific cores for real-time programming, allowing remaining cores to be managed by generalpurpose OS to support in-vehicle infotainment system. Running a real-time operating system inside a virtual machine instead of a bare-metal hardware clearly impacts the timing of the kernel. This new timing need to be quantified in order to evaluate how it affects the execution of real-time applications. So far, many studies have evaluated the performance of a virtualized RTOS. The majority of these studies usually focus on measuring the interrupt latency by tracing the time between a timer interrupt assertion and the instant an observable response occurs in a single user-space task that runs on top of the virtualized RTOS. The interrupt latency measurement in the virtualized RTOS showed that, the virtualization technique adds a maximum value that ranges from several hundreds of microsec-
onds to some milliseconds to the interrupt latency in comparison to the same RTOS running natively on a real machine. From an application developer perspective, this is a practical evaluation that gives a global overview of the performance of a virtualized application. But from an OS developer perspective, this evaluation lacks more detailed metrics concerning the operating system kernel overheads and latencies that are useful to observe the scalability of the virtualization technique. In our work, we measured a set of fine-grained overheads and latencies of a virtualized RTOS. The analysis of the results allow to observe how these internal overheads and latencies are impacted by the virtualization technique and to understand the software and hardware mechanisms that are involved in the performance degradation. In the remainder of this paper, we provide an overview of the virtualization concept in section 2, and explain the hardware mechanisms required to build an efficient virtual machine system. In section 3, we present an implementation of a hosted virtual machine system. In section 4, we discuss some related work that evaluated the same platform that we used in our experiments. We give a comprehensive overview of the tools that were used to measure the overheads and latencies in section 5. Then, we analyze the results and explain the reasons for performance degradations in section 6. Finally, we conclude and give the future directions of our work.
2 Virtualization Technique In this section, we provide an introduction to the various parts of a hardware platform, with a view to understanding how virtualization can be achieved. Understanding the design of a system composed of virtual machines is necessary to evaluate the impact that this mechanism could cause to a virtualized real-time operating system.
2.1
System of Virtual Machines
Running multiple guest operating systems simultaneously on a single host hardware platform could be realized
by partitioning processor time, memory space, and the I/O devices. The hardware resources allocated to a guest operating system constitutes a virtual machine (VM). The software component that allocates the hardware resources to each guest operating system is referred to as a virtual machine monitor (VMM). The classic approach to system VM architecture is to place the VMM on bare hardware whereas the virtual machine fits on top. The VMM runs in the most highly privileged mode, while all guest operating systems run with lesser privileges, as shown in Figure 1.b. Then, in a completely transparent way, the VMM can intercept and implement all the guest OS’s actions that interact with the hardware resources. An alternative implementation builds the VMM on top of an existing host operating system, resulting in what is called a hosted VM as shown in Figure 1.c and 1.d. In this configuration, the installation process is similar to installing a typical application program. Guest Apps
Guest Apps
Guest Apps
Guest OS
Guest OS
Applications
Guest OS
VMM
VMM
OS
VMM
Host OS
Hardware
Hardware
Hardware
a. Traditional system
b. Native VM system
c. User-mode hosted VM system
Host OS
Non privileged modes Privileged modes
Hardware d. Hosted VM system
Figure 1. Native and Hosted VM Systems. From [16]
2.2
ulating any remaining instructions depends on several factors, including the actual number of instructions that must be emulated, the complexity of discovering the instructions that must be emulated and the data structures and algorithms used for emulation. 2.2.1
Conditions for ISA Virtualization
In a virtual machine environment, an operating system running on a guest virtual machine should not be allowed to change hardware resources in a way that affects the other virtual machines. Hence, even the operating system on a virtual machine must execute in a mode that disables the direct modifications of system resources such as the CPU timer interval. Consequently, all of the guest operating system software is forced to execute in user mode. This represents a problem that prevents the construction of efficient VMM. But before explaining the reason of this problem we need to define two terms. Sensitive instruction. A sensitive instruction is an instruction that attempts to read or change the resource-related registers and memory locations in the system, for example, the physical memory assigned to a program or the mode of the system. The POPF, Intel IA-32 instruction is an example. This instruction pops a word from the top of a stack in memory, increments the stack pointer by 2, and stores the value in the lower 16 bits of the EFLAGS register. One of the bits in the EFLAGS register is IF, the interrupt-enable flag that is not modified when POPF is executed in user mode. The interrupt-enable flag can only be modified in privileged mode. Privileged instruction. A privileged instruction is defined as one that traps if the machine is in user mode and does not trap if the machine is in system mode.
Resource Virtualization - Processors
There are two ways of virtualizing a processor. The first is emulation, and the second is direct native execution on the host machine. Emulation involves examining each guest instruction in turn, and emulating on virtualized resources the exact actions that would have been performed on real resources. Emulation is the only processor virtualization mechanism available when the instruction set architecture (ISA) of the guest is different from the ISA of the host. The second processor virtualization method uses direct native execution on the host machine. This method is possible only if the ISA of the host is similar to the ISA of the guest and only under certain conditions. In this case, the guest program will often run on a virtual machine at about the same speed as on native hardware, unless there are memory or I/O resource limitations. The overhead of em-
The reason why a VMM could not be constructed efficiently is due to the fact that if a sensitive instruction such as POPF is executed by the guest operating system, and that this guest OS is running in user mode, this instruction will not trap. So the VMM could not take control of the machine and execute on behalf of the guest OS. The only way to force the control back to the VMM, is the use of emulation. It would be possible for a VMM to intercept POPF and other sensitive instructions if all guest software were intercepted instruction by instruction. The VMM could then examine the action desired by the virtual machine that issued the sensitive instruction and reformulate the request in the context of the virtual machine system as a whole. The use of interpretation clearly leads to inefficiency, in particular when the frequency of sensitive instructions requiring interpretation is relatively high. To avoid this problem, it is necessary for an ISA to be
efficiently virtualizable that all the sensitive instructions are a subset of the privileged instructions. More precisely, if a sensitive instruction is a privileged instruction, then it will always trap when executed in user mode. All non-privileged instructions can be executed natively on the host platform and no emulation is required.
Direct execution of User Requests
operating system kernel can run in ring 0 and guest applications can run in ring 3. A key aspect of the VT-x technology that allows faster virtual machine systems to be built is the elimination of the need to run all guest code in the user mode, essentially by providing a new mode of operation specifically for the VMM. For code regions that do not contain instructions that affect any critical shared resources, the hardware executes as efficiently as it would have on a normal machine. It is only in few cases where this is not possible that a certain degree of emulation must be performed by the VMM. Thus, once in the virtual machine, the exits back to the monitor are far less frequent in the hardware case than in software virtualization.
3 Linux Kernel Virtual Machine
Figure 2. Intel ISA’s operation modes and privilege levels.
2.2.2
Hardware Virtualization Technology
To enhance the performance of virtual machine implementations, hardware manufacturers developed a dedicated technology for their processors. The main feature is the inclusion of a new processor operating mode. For example, the Intel VT-x feature has added a new processor mode called VMX. In this mode, the processor can be in either VMX root operation or VMX non root operation. In both cases, all four IA-32 privilege levels (rings) are available for software. In addition to the usual four rings, VT-x, provides four new less privileged rings of protection for the execution of guest software, as shown in Figure 2. The processor in the VMX root operation behaves similarly to a normal processor without the VT-X technology. The main difference relies in the addition of a set of new VMX instructions. The behavior of the processor in a non-root operation is limited in some respects. The limitations are such that critical shared resources are kept under the control of a monitor running in VMX root operation. This limitation of control extends also to non-root operation in ring 0, which, in normal processors, is the most privileged level. Thus the intention is for the VMM to work in VMX root operation, while the virtual machine itself, including the guest operating system and application, work in VMX non-root operation. Because VMX non-root operation includes all four IA-32 privilege levels (rings), guest software can run in the rings in which it was originally intended to run, i.e, the guest
In our experiments we used the Linux Kernel Virtual Machine (KVM) [14]. KVM is an example of a hosted VM. Here the host is the Linux operating system and the virtual machine monitor is composed of two components, the Kernel Virtual Machine is the privileged component and the Qemu is the unprivileged component. Figure 3 illustrates the KVM and Qemu architecture. The KVM virtualizes the processor by creating a virtual machine data structure to hold the virtual CPU registers. It also virtualizes the memory by configuring the MMU hardware to translate the guest virtual addresses to host physical addresses if the architecture supports the two-dimensional paging. Otherwise it uses shadow page table to emulate a hardware MMU. KVM traps the I/O instructions and forwards them to Qemu which feeds them into a device model in order to emulate their behavior, and possibly triggers real I/O such as transmitting a network packet.
3.1
Qemu
Qemu is a computer emulator software [6]. Usually, it is used to emulate a hardware architecture on another different architecture, for example emulating a Power-PC ISA using an IA-32 ISA. When Qemu is executed with the -enable-kvm option, the CPU emulation mechanism of Qemu is disabled. The Qemu software invokes the services provided by KVM to execute the code of the guest operating system natively on the hardware. This operation is only possible when the guest OS is targeted for the same architecture of the host processor. For example, the guest OS is an x86 version of Linux and the host processor is an x86. Qemu is used by KVM to emulate I/O devices. When a guest I/O instruction is encountered, it traps to the KVM code that forwards it to Qemu. If the requested device is supported by the Linux host OS, the request is converted
into a Linux host OS call. The KVM, through Qemu, now acts as a user application under Linux. When the application returns from this system call, the control gets back to the KVM and then into the guest OS running on the virtual machine.
3.2
Virtual Machine Process
Starting a virtual machine under KVM could be done by starting a Qemu user process. When the Qemu process starts executing, it requests the creation of the virtual machine. The KVM creates a virtual machine data structure and associates it to the Qemu process. Then, when the Qemu process is scheduled by the Linux kernel, it requests the launch of the virtual machine. After that, the processor starts executing the guest OS code until it encounters an I/O instruction, or until the occurrence of an interrupt. The Linux operating system schedules this virtual machine process as it schedules the other regular processes. Virtual Machine Applications
Host Applications
Linux
The results of the evaluation showed that a cyclictest executed on a virtualized RTOS produced a maximum timer interrupt latency higher than a cyclictest executed on a native RTOS by several hundreds of microseconds. This comparison helps to estimate the performance of a virtualized RTOS from an application perspective. Nevertheless, it does not help to understand the reasons that caused this higher overhead. Moreover, in the case of a system that is subject to hard real time constraints, this approach only allows to assert that during the first hour of operation the maximum latency did not cause a failure. However, in general, even if later execution times are less than observed during the first hour, this does not preclude a deadline miss at a later time. In contrast, our approach, by detailing the distribution of the global additional overhead in terms of scheduling execution cost, context-switch cost, release overhead, and event release latency allows to investigate the functionalities of the kernel that are the most involved in the performance degradation. Moreover, by conducting proper schedulability analysis [10] based on estimated execution costs, a much stronger guarantee regarding the temporal correctness of the application could be asserted.
Guest OS Qemu kvm driver
User mode KVM
Privileged mode
Hardware
Figure 3. Linux Kernel Virtual Machine and Qemu.
4 Related Work A recent state-of-the-art survey [12] regarding the realtime issues in virtualization has presented a complete overview of virtualization solutions. Here we discuss the evaluation of the virtual machine system based on KVM. Multiple experiments [7, 11, 13, 15, 17, 18] have evaluated the real-time virtualization performance of KVM. To measure the performance of KVM, a real-time operating system was executed inside a virtual machine and the cyclictest benchmark [3] was executed on top of the guest RTOS for a limited period of time, for example one hour. The cyclictest is a simple benchmark to measure the accuracy of OS sleep() primitives and part of the “rttests” benchmark suite developed primarily to evaluate the PREEMPT RT real-time Linux kernel patch. To obtain accurate results, the cyclictest was executed at highest real-time priority. The wakeup time measured is considered as an approximation of the timer interrupt latency in the virtualized RTOS.
5 Experiments In this section we present our evaluation of the virtualized RTOS. First, we define the overheads and latencies that are of interest. Second, we describe the hardware platform and the RTOS that we used in our experiments. Then, we present the synthetic workloads used to measure the overheads and latencies.
5.1
Overheads and Latencies
• Scheduling overhead is the time taken to perform a process selection. • Context-switch overhead is the time required to perform a context switching. • Event Latency is the delay from the raising of the interrupt signal by the hardware device until the start of execution of the associated interrupt service routine (ISR). • Release Overhead is the delay to execute the release ISR. The release ISR determines that a job Ji has been released and updates the process implementing a task Ti to reflect the parameters of the newly-released job.
5.2
Test platform
In the first configuration, we tested the native RTOS, and we used a dual-core Intel 1.86-Ghz as a hardware platform.
The real-time operating system we used is LITMUSˆRT [9] configured with the partitioned-fixed priority (P-FP) scheduler and dedicated to one core of the machine. In the second configuration, we used the Linux KVM/Qemu as a hosted VM system. We configured the host Linux kernel with the PREEMPT RT real-time patch to improve its real-time capability. We installed the LITMUSˆRT real-time operating system inside a virtual machine. While the tested hardware platform is not a typical platform for small embedded system, we used it due to its similarities in terms of CPU clock frequency, cache memory and virtualization extension, with the platform that the automotive manufacturers [4] would like to deploy in upcoming automotive SoC.
5.3
RTOS: LITMUSˆRT
LITMUSˆRT is a real-time Linux patch. Its main property consists in extending the Linux kernel with multiprocessor real-time scheduling policies and locking protocols. The particularity of the LITMUSˆRT kernel resides in the fact that its code is instrumented to measure independently the duration of each scheduling decision, context switch, event latency, release, and inter-processor interrupt. In LITMUSˆRT, the Feather-Trace [8] infrastructure was used for this purpose. Feather-Trace is a light-weight event tracing toolkit. Its main characteristic is the low level overhead that it introduces, which is an important feature in our case because it ensures that the measurements trace does not influence the results.
5.4
Synthetic Workloads
The experimental methodology we used in our evaluation is inspired by the methodology used to evaluate the LITMUSˆRT kernel [10]. To measure the overheads and latencies we used a synthetic task sets system. Each task set has a size n = m ∗ k, where m is the number of processors, and k is the number of tasks per processor and ranges from one to twenty. For each value of n, five task sets systems were generated and each task set within a system was executed for 60 seconds. The task sets were generated by randomly choosing their CPU utilization of each included task until the CPU utilization capacity was reached. The utilization of each task was randomly generated using one of the following distributions: light uniform, light bimodal, light exponential, medium uniform, and medium bimodal, as proposed by Baker [5]. The task periods were generated using a uniform distribution within a [10ms, 100ms] range. Then, the utilization and the period values were used to compute the execution time of each task.
These distributions are well known to stress specific sources of algorithmic and overhead-related capacity loss. For example, using light utilization distributions produces task sets with many tasks where each task has a low CPU utilization which results in a large number of interrupt sources and long ready queues. Using medium utilization distribution produces tasks’ set with a mix of low and high CPU utilization tasks. In addition to real-time workload, m background tasks were launched that create memory and cache contention by repeatedly accessing large arrays. This avoids the underestimation of the worst-case overheads. The measurements of overheads and latencies results in a large log events records. From this large log events, we extract the measurement for each overhead and latency. Then, for each overhead and latency the average-case and the worst-case statistics are distilled.
6 Results In total, the overhead experiments resulted in 1 GB of events records, which contained more than 500 thousands valid overhead samples. Figure 4, 6, 8, and 10 show the average-case and the worst-case trends of all the overheads and latencies from the virtualized RTOS, and Figure 5, 7, 9, and 11 show the similar measurements from the native RTOS. The values of overheads and latencies in the graphs are given in microsecond and plotted as a function of the number of tasks per processor. In the average case, the overall overheads and latencies of the virtualized RTOS are roughly comparable to similar measurements from native RTOS. This similarity is explained by the fact that in most cases the guest code is executed natively on the machine, thus it runs at the same speed as the native code. A key observation from Figure 4 and 5 is that the scheduling average-case trend under either configuration does not appear to be correlated to the task set size. This is due the fact that in LITMUSˆRT, the partitioned fixed-priority scheduler is efficiently implemented using a bitfield-based ready queues to enable fast lookup of ready processes. As a result, the runtime complexity of finding the next highest-priority job does not depend on the number of ready tasks. Another contributing factor is that task sets with high task counts also have a high utilization, which means that the background processes that create memory contention execute less frequently and results in an increased cache hit rate. However, Figure 8 and 9 show a difference in the average-case between the virtualized and native RTOS. We see a slight increase of the event latency of the virtualized RTOS in comparison to the native RTOS. This difference is
measured scheduling overhead under P-FP scheduling
measured context-switch overhead under P-FP scheduling
100
400 maximum average std. deviation
maximum average std. deviation
350 overhead in microseconds
overhead in microseconds
80
60
40
300 250 200 150 100
20 50 0
0 1
2
3
4
5
6
7
8 9 10 11 12 13 number of tasks per processor
14
15
16
17
18
19
20
1
Figure 4. Scheduling overhead.
2
3
4
5
7
8 9 10 11 12 13 number of tasks per processor
14
15
16
17
18
19
20
17
18
19
20
Figure 6. Context-switch overhead.
measured scheduling overhead under P-FP scheduling
measured context-switch overhead under P-FP scheduling
50
100 maximum average std. deviation
maximum average std. deviation 80 overhead in microseconds
40 overhead in microseconds
6
30
20
10
60
40
20
0
0 1
2
3
4
5
6
7
8 9 10 11 12 13 number of tasks per processor
14
15
16
17
18
19
20
1
2
3
4
5
6
7
8 9 10 11 12 13 number of tasks per processor
14
15
16
Figure 5. Scheduling overhead (native).
Figure 7. Context-switch overhead (native).
due to the fact that the event latency is related to the emulation of the I/O interrupt as explained in the next section. In contrast, the worst-case trend present much more irregularity compared to the average-case trend. This irregularity could be explained by multiple reasons. Some high-overhead value could be explained by the actual occurrence of rare, high-overhead events. For example, in Figure 9 most of the worst-case event latency are under 20µs. However, the high-overhead values at n = 15 and n = 19, are approximately equal to 42µs, that we explain by the occurrence of an interrupt. Since our system was frequently servicing long-running ISRs related to disk and network I/O during overhead tracing. We suspect that the measurement was certainly disturbed by an inopportune interrupt. As we can see in Figure 7 at n = 8 and n = 13 where the worst-case overhead samples appear to be different from the overall trend. In addition, other high-overhead values could be caused by measurement error. In fact, in repeated measurements of some overhead, a small number of samples may be ”outliers”, that is some samples appear to not match the overall trend. While outliers typically do not significantly affect average-case estimates (due the large number of correct samples), large outliers can dramatically alter the estimated maximum. In our case study, we observed outliers in data sets from overhead sources that can be disturbed by interrupts. In fact,
outliers occurred frequently in measurements of event latency and context-switch overhead, which are strongly affected by interrupt delivery. In contrast, outliers occurred rarely in the measurements of scheduling overhead since interrupt delivery is disabled throughout most parts of the measured scheduling code path. This is confirmed by the standard deviation of the measured values, where we can see that the probability of occurrence of high-overhead worst-case values is very low. Figure 11 shows the measurement of the release overhead in the native case. It is the measurment of the delay to execute the release ISR. This function is executed while the interrupts are disabled, therefore we did not observed a high variation in the worst-case values. Which confirms the analysis we presented in the previous paragraph. However, Figure 10 presents the same measurement from the virtualized RTOS. But in this case, we can see that the worst-case is very high in comparison with the average-case. We explain this by the fact that, even if the release ISR is executed while interrupts are disabled in guest the operating system, it does not mean that the guest operating system could not be preempted by the virtual machine monitor. This is due to the fact that the guest OS is not authorized to disable the interrupt in the system, and therefore it is subject to perturbation from other workload happening in the host. This preemption of the guest operating system could delay the response time of the primitives currentlty executing by the
measured event latency under P-FP scheduling
measured release interrupt overhead under P-FP scheduling
300
100 maximum average std. deviation 80 overhead in microseconds
overhead in microseconds
250
maximum average std. deviation
200
150
100
60
40
20
50
0
0 1
2
3
4
5
6
7
8 9 10 11 12 13 number of tasks per processor
14
15
16
17
18
19
20
1
2
Figure 8. Event latency.
3
4
5
7
8 9 10 11 12 13 number of tasks per processor
14
15
16
17
18
19
20
17
18
19
20
Figure 10. Release overhead.
measured event latency under P-FP scheduling
measured release interrupt overhead under P-FP scheduling
50
50 maximum average std. deviation
maximum average std. deviation 40 overhead in microseconds
40 overhead in microseconds
6
30
20
10
30
20
10
0
0 1
2
3
4
5
6
7
8 9 10 11 12 13 number of tasks per processor
14
15
16
17
18
19
20
1
2
3
4
5
6
7
8 9 10 11 12 13 number of tasks per processor
14
15
16
Figure 9. Event latency (native).
Figure 11. Release overhead (native).
guest OS. In general, the worst-case values of the virtualized RTOS are higher than the native RTOS. Nevertheless, it is difficult to draw a conclusion from the comparison of the worst-case measured values. The reasons of this performance degradation is explained in more details in the next section.
is accepted by the guest operating system and transferred to the appropriate ISR. As a result, the event latency in the virtualized RTOS is higher than in the native RTOS. To avoid this overhead, hardware manufacturers added a new feature to their processors to enable the virtualization of interrupts. For example, the Intel VT-d [1] feature enables the virtualization of the Advanced Programmable Interrupt Controller (APIC). When this feature is used, the processor will emulate many accesses to the APIC, track the state of the virtual APIC, and deliver virtual interrupts, all in VMX non root operation without any exit from the virtual machine to the virtual machine monitor. Currently, a patch [2] is being developed to support this feature in KVM.
Reasons for Performance Degradation: Virtual machines can improve the utilization of hardware by sharing resources among multiple guest operating systems, each guest is given the illusion of owning all the machine resources. Unfortunately, this also raises the expectations of guest OS, which now requires performance on its workload similar to that provided by a complete machine. Performance measurements presented in the previous section indicated in the worst-case, it was difficult to achieve a guest performance that is similar to a native performance. Interrupt handling. When an interrupt is raised by a physical device, it is intercepted by the virtual machine monitor, converted to a virtual interrupt, and injected into the virtual machine. The time to emulate the access to the virtual device and to acknowledge the interrupt must be added to the time during which the interrupt is pending, and until it
7. Conclusions Running a real-time operating system along side Linux on the same shared hardware could be achieved using a multicore system that support virtualization. In our evaluation, we measured the order-of-magnitude of the fine-grained overheads and latencies of a virtualized RTOS. We identified that in the average-case, all the overheads and the latencies commensurate with those measured in the native RTOS which do not influence the schedulability tests of soft real-time applications. However, based on
the worst-case measurements it is difficult to draw a conclusion regarding the impact of virtualization on the schedulability tests of hard real-time applications. We hope that these measurements will help the community to understand the impact of virtualization on a guest real-time operating system and observe what are the possible performance enhancements. In a future work, we will continue our experimentation by considering the effect of activities going on other VMs while the real-time VM is executing. And we will also integrate our carefully estimated parameters into a schedulability analysis in order to derive a more strong and conditional guarantee regarding the temporal correctness of a real-time application.
References [1] Intel 64 and IA-32 Architectures Software Developer’s Manual. Intel Corporation. [2] KVM: x86: CPU isolation and direct interrupts handling by guests. https://lkml.org/lkml/2012/6/28/30. [3] PREEMPT RT: the Linux kernel real-time patch. https://rt.wiki.kernel.org/index.php/RT PREEMPT HOWTO. [4] Renesas R-Car H2 SoC targets infotainment. http://johndayautomotivelectronics.com/?p=13641. [5] T. P. Baker. A comparison of global and partitioned edf schedulability tests for multiprocessors. Technical report, In International Conf. on Real-Time and Network Systems, 2005. [6] F. Bellard. QEMU, a fast and portable dynamic translator. Translator, pages 41–46, 2005. [7] Z. Bing. Scheduling Policy Optimization in Kernel-based Virtual Machine. Computational Intelligence and Software Engineering (CiSE), 2010 International Conference on, 2010. [8] B. Brandenburg and J. Anderson. Feather-Trace: A lightweight event tracing toolkit. Proceedings of the Third International Workshop on Operating Systems Platforms for Embedded Real-Time Applications, pages 19–28, 2007. [9] B. Brandenburg, A. Block, J. Calandrino, U. Devi, H. Leontyev, and J. Anderson. LITMUSˆRT: A Status Report. Proceedings of the 9th Real-Time Linux Workshop, pages 107– 123, 2007. [10] B. B. Brandenburg. Scheduling and Locking in Multiprocessor Real-Time Operating Systems. PhD thesis, The University of North Carolina at Chapel Hill, 2011. [11] N. Forsberg. Evaluation of Real-Time Performance in Virtualized Environment. Technical report, 2011. [12] Z. Gu. A State-of-the-Art Survey on Real-Time Issues in Embedded Systems Virtualization. Journal of Software Engineering and Applications, 05(04):277–290, 2012. [13] J. Kiszka. Towards Linux as a Real-Time Hypervisor. Proceedings of the 11th Real-Time Linux Workshop, 2010. [14] A. Kivity, Y. Kamay, D. Laor, and U. Lublin. kvm: the Linux Virtual Machine Monitor. Proceedings of the Linux Symposium, 2007.
[15] M. Ramachandran. Challenges in Virtualizing Real-Time Systems Using KVM / QEMU Solution. Proceedings of the 14th Real-Time Linux Workshop. [16] J. E. Smith and R. Nair. Virtual Machines Versatile Platforms for Systems and Processes. Elsevier MORGAN KAUFMANN, 2005. [17] J. Zhang, K. Chen, B. Zuo, R. Ma, Y. Dong, and H. Guan. Performance analysis towards a KVM-Based embedded real-time virtualization architecture. 5th International Conference on Computer Sciences and Convergence Information Technology, pages 421–426, Nov. 2010. [18] B. Zuo, K. Chen, A. Liang, H. Guan, J. Zhang, R. Ma, and H. Yang. Performance Tuning Towards a KVM-Based Low Latency Virtualization System. 2010 2nd International Conference on Information Engineering and Computer Science, pages 1–4, Dec. 2010.