Journal of Cancer Science & Therapy - Open Access www.omicsonline.org
Research Article OPEN ACCESS Freely available online doi:10.4172/1948-5956.1000025
JCST/Vol.2 Issue 3
Evaluation of IMRT QA Point Measurement Rocesses Using a Commercial Heterogeneous Phantom Khaled Aljarrah1, 2*, Todd Pawlicki1, Neelam Tyagi1 and Steve B. Jiang1 1 2
Department of Radiation Oncology, UC San Diego, CA, USA Department of Physics, Jordan University of Science & Technology, Irbid, Jordan
Abstract Intensity Modulated Radiation Therapy (IMRT) has the potential to deliver a highly conformal dose distribution to the target volume compared to conventional radiotherapy. However, the use of IMRT introduces complexities in dose delivery and verification. Routine IMRT QA is typically performed in a homogeneous solid water phantom and does not verify the accuracy of a treatment planning system’s handling of the heterogeneity correction algorithm, which is particularly important in a low density lung medium. The purpose of this work is to evaluate common IMRT QA point measurement processes that take advantage of a commercial heterogeneous phantom [CIRS IMRT thorax phantom (CIRS, Inc., Norfolk, Virginia, USA)]. Dose calculated with Monte Carlo (MC) methods and pencil beam (PB) methods are used. IMRT QA using the CIRS phantom with the MC and PB algorithms was retrospectively analyzed using control charts and a capability index. Fifteen actual IMRT treatment plans of lung cancer patients were used for this study. The dose was measured in the phantom at points located in lung, bone, and tissue with an ion chamber (IC) for 15 cases and thermoluminescent dosimeters (TLDs) for 5 cases. Measurements and calculations in each heterogeneity (e.g., TLD/MC in bone) were considered as separate processes. Control charts and the capability index Cpm were used to evaluate the following processes using the CIRS phantom: IC/MC, PB/MC, TLD/MC for measurements in the lung, tissue and bone. The processes PB/IC and MC/IC using conventional homogeneous water-equivalent slab geometry were also evaluated. In total, 11 IMRT QA processes were considered. Comparison of the data showed that the dose inside the lung calculated with PB was overestimated by 6% on average relative to the MC calculations. On average, MC calculations in bone and tissue agree within 3% with PB calculations and IC measurements. Process capability values (Cpm) greater than 1.33 indicate a well performing process. Using the CIRS phantom, Cpm ranged from 0.25 for the PB/ MC process in lung to 1.41 for the TLD/MC process in tissue. By comparison, the process using the conventional waterequivalent slab phantom showed the PB/IC and MC/IC Cpm values of 1.36 and 1.21, respectively. Nine of the 11 IMRT QA processes studied were not able to meet the clinical specifications of 5%. However, we found the CIRS phantom is versatile to compare both homogeneous and heterogeneous IMRT QA measurements to calculations. Our results indicate that additional refinements of the IMRT QA processes are required. This is especially true for calculations and measurements in lung-equivalent media. The capability index is a simple and useful quantitative tool for comparing different approaches to lung IMRT QA.
IMRT; Process control
Introduction Lung cancer is the leading cause of cancer mortality in the United States. Significant effort has been carried out in developing highly conformal dose delivery techniques using multiple coplanar beams for these patients. IMRT is being used for lung cancer treatment and has shown the potential to deliver a highly conformal dose to the target while minimizing dose to the healthy tissues and is thus an effective tool for dose escalation in lung cancer treatment (Arriagada et al., 2004). Due to the complexity of IMRT treatment plans, patient specific quality assurance (QA) is the standard of practice (Palta et al., 2008). Different measuring devices and techniques such as TLD, EPID and gamma analysis were adopted to investigate the dose distributions for the QA purpose. An independent dose and monitor unit verification (MUV) software was investigated and benchmarked for clinical applications by Goerge et al. (Georg et al., 2007a; Georg et al., 2007b). A common procedure is based on point dose measurements using ion chamber or planar dose measurements using films in a homogeneous solid water phantom. While these measurements provide an evaluation of the linac and MLC performance for a specific IMRT plan, they do not directly verify the dose calculation accuracy of a treatment planning system (TPS) for the IMRT plan in
IMRT QA measurements are typically influenced by the phantom setup and the machine daily output which could introduce up to 3% uncertainty in dose accuracy. Monte Carlo (MC) methods are not influenced by equipment setup and machine output fluctuations. Furthermore, MC calculates the dose to the medium of interest without introducing any correction to the medium geometry. Monte Carlo methods are
*Corresponding author: Khaled Aljarrah, Department of applied Physics, BioMedical Physics Laboratory, Jordan University of Science & Technology (JUST), P.O. Box 3030, Irbid 22110, Jordan, Tel: +962-2-7201000, ext: 23512; Fax: +9622-7201071; E-mail:
[email protected] Received March 08, 2010; Accepted April 18, 2010; Published April 18, 2010 Citation: Aljarrah K, Pawlicki T, Tyagi N, Jiang SB (2010) Evaluation of IMRT QA Point Measurement Rocesses Using a Commercial Heterogeneous Phantom. J Cancer Sci Ther 2: 063-069. doi:10.4172/1948-5956.1000025 Copyright: © 2010 Aljarrah K, et al. This is an open-access article distributed under the terms of the Creative Commons Attribution License, which permits unrestricted use, distribution, and reproduction in any medium, provided the original author and source are credited.
Volume 2(3): 063-069 (2010) - 063
CS
lishing Pub G
r p ou
J Cancer Sci Ther ISSN:1948-5956 JCST, an open access journal
heterogeneous materials. This is particularly important for the case of lung cancer IMRT, where the lateral electron transport at the boundaries of lung and tissue (or tumor) can not be easily handled by a conventional pencil beam algorithm (Butson et al., 2000; Laub et al., 2001; Ma et al., 2003; McDermott et al., 2003; Jang et al., 2006; Davidson et al., 2007).
OM I
Keywords: Photon-beam dose calculation; Quality assurance;
Citation: Aljarrah K, Pawlicki T, Tyagi N, Jiang SB (2010) Evaluation of IMRT QA Point Measurement Rocesses Using a Commercial Heterogeneous Phantom. J Cancer Sci Ther 2: 063-069. doi:10.4172/1948-5956.1000025
a good way to test a realistic lung phantom for routine IMRT QA using realistic plans of IMRT lung patients. Anthropomorphic-type thorax phantoms, such as the CIRS IMRT thorax phantom (CIRS, Inc., Norfolk, Virginia, USA), can potentially be used for the QA of lung IMRT plans to evaluate the dose calculation accuracy of a TPS in a heterogeneous media for a particular IMRT plan. The CIRS phantom consists of various interchangeable tissue equivalent and heterogeneous medium inserts for thermoluminescent dosimeter (TLD) and ion chamber (IC) measurements. This phantom has previously been used for validating a convolution/superposition algorithm (Breitmanet al., 2007). Clinical specifications (e.g., ±3%) are not sufficient for the purpose of determining process performance because clinical criteria are independent of process performance. Therefore, process analysis was done using control charts and a capability indices similar to that described by Breen et al and Gerard et al. (Breen et al., 2008; Gerard et al., 2009). Control charts consist of a mean value called a center line and action limits called control chart limits. Data points within the control chart limits are considered to be subject only to random errors. The purpose of this work is to evaluate common IMRT QA point measurement processes that take advantage of a commercial heterogeneous phantom [CIRS IMRT thorax phantom]. In this study, the CIRS thorax phantom is used with TLD and ion chamber measurements together with a pencil beam and Monte Carlo dose calculation algorithms. Fifteen physician-approved IMRT treatment plans were included in this study and process evaluation is done using control charts and the process capability index, Cpm.
Materials and Methods Phantoms Realistic thorax phantom: The CIRS phantom has been used as the realistic heterogeneous thorax phantom for this study. The phantom has interchangeable inserts with plugs to load a
BB
6
7
4
2
7cm
3cm
10 9
3
-5cm
20 cm
5 1
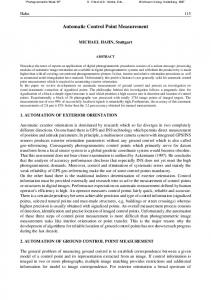
Treatment planning and dose calculation Prior to the CT scanning of the phantom, 3 lead fiducial markers of 2 mm diameter (called BB’s) were placed on the phantom’s left lateral, right lateral and anterior surface (shown in Figure 1). These markers were used to align the phantom on the CT couch and the treatment room couch. The marker coordinates were used as a reference for coordinate transformation from the TPS coordinate to MC or pencil beam system coordinate. The phantom was CT scanned using a GE light speed scanner with 2.5 mm slice thickness. The CT data was exported to the TPS workstation for contouring and dose calculation. The location of the IC active volume (0.6ccm) in each insert was contoured in the TPS such that the contoured volume has the same size as that of the chamber’s active volume. Fifteen actual lung cancer patients’ IMRT plans, generated by the CORVUS IMRT planning system (North American Scientific, Inc., Chatsworth, CA, USA), were used in this study. The CORVUS TPS uses a pencil beam (PB) algorithm that is based on a radiological path length correction. Each plan used the 6 MV photon beam of a Varian 21 EX linear accelerator (equipped with Millennium MLC) with a beamlet size of 1×1 cm2 and consists of 5 to 7 gantry angles. The same beam arrangements, fluence maps, and monitor units, were applied on the thorax phantom to generate hybrid QA plans for each patient.
BB Left
Tissue equivalent
8cm 30 cm
Bone equivalent Figure 1: A cross sectional view for the CIRS thorax phantom showing the phantom dimensions and location of the lung equivalent inserts (1, 2, 9, and 10), bone inserts (3), and tissue inserts (4, 5, 6, 7, and 8). The phantom has interchangeable inserts for lung equivalent (ρ = 0.21 gm/cm3) and bone equivalent (ρ = 1.60 gm/cm3) material in the regions corresponding to the lungs and the vertebral bodies.
The CIRS phantom was set up for measurements in the treatment room and aligned to the BB’s using the lasers. Sets of measurements were then performed by placing ion chambers at locations inside lung, bone, and tissue inside the thorax phantom. Three identical Farmer -type IC chambers were used to measure the dose to the measurement points in the phantom. Followed the linac commissioning condition (depth of 5 cm, 10×10 cm2 field size, 100 cm SSD, and 100 cGy for 100 MU) a calibration procedure was used for each chamber to convert the chamber reading to dose in cGy. This was done by delivering 100 MU in a solid water phantom at a depth of 5 cm for 10×10 cm2 field size and then using the measured dose values as a conversion factor from charge to dose. The measured and calculated doses for each plan were normalized to the plan prescribed dose for the purpose of dose comparison. Volume 2(3): 063-069 (2010) - 064
CS
lishing Pub G
r p ou
J Cancer Sci Ther ISSN:1948-5956 JCST, an open access journal
The first set of measurements was done by delivering all the patient plans to the homogeneous solid water phantom. The IC was placed at the plan’s isocenter. The plan’s isocenter was shifted such that the measurement point would correspond with the high dose target regions in the patient’s plan.
OM I
L ung equivalent 8 4cm
Homogeneous solid water phantom: A homogeneous solid water phantom of 30×30 cm2 dimension in the beam’s eye view was used for all water phantom measurements. The phantom material has characteristics very close to those of water (e.g. elemental composition, mass fraction, nominal density, mean atomic number etc.).
Measurements
Anterior BB
Insert
farmer-type ion chamber or TLDs for point dose measurements. The inserts are distributed as: 2 inserts in each lung were filled with a lung equivalent material, 1 insert at the location of the vertebral body was filled with a bone equivalent material, and 5 inserts located in the mediastinum region were filled with tissue equivalent material. A cross sectional schematic view of the CIRS lung phantom is shown in Figure 1.
Journal of Cancer Science & Therapy - Open Access
Research Article OPEN ACCESS Freely available online doi:10.4172/1948-5956.1000025
www.omicsonline.org
JCST/Vol.2 Issue 3
The same phantom set-up was used for TLD measurements using 3 mm cylindrical TLDs. The TLDs were prepared for irradiation by annealing them at 400oC for 1 hr, then for 24 hrs at 100oC. Using special inserts TLDs were placed at same IC locations. After loading the TLDs in the phantom, the IMRT treatment plane is delivered. The irradiated TLDs were read by heating them to 100oC in a TLDs reader system. A Harshaw TLD reader Model 500A was used to read the TLDs. Measurements using TLDs were repeated 5 times and done for the first 5 patients. TLD dose measurements were also normalized to the plan prescribed dose for the purpose of dose comparison.
the different processes are calculated in the following way: for a patient with a prescribed target dose of D Gy/fraction, then the percent difference between the IC, (or PB or TLD) in the CIRS phantom is (IC - MC).100/D, the percent difference between the PB (or MC) in the solid water phantom is (PB - IC).100 / D.
Monte Carlo Simulations
(n = 1) are calculated using the expressions UCL X 3
The Monte Carlo code MCSIM, the most recent version of the MCDOSE (Li et al., 2000; Ma, 2004a), was used to calculate the dose to the homogeneous water phantom and the CIRS phantom. The simulations were carried out using the following transport parameters: ECUT = 0.7 MeV, PCUT = 0.01 MeV and ESTEPE = 0.4. The measured average multi-leaf collimator (MLC) leaf leakage of 1.8 % was used to simulate transmission through the closed MLC leaves. Beam transmission through the jaws was considered zero. A phase space file generated below the jaws for 40×40 cm2 field size was used as the source for the photon beam (Aljarrah et al., 2006). Back scatter was corrected by calculating the fitting parameters of Jiang et al. for different fields at the linac calibration conditions (Jiang et al., 2001).
and LCL X 3
The fluence maps of the 15 hybrid treatment plans were exported from the TPS to the MC workstation. The MCSIM code reads the MLC leaf sequence file of the IMRT treatment plans generated by CORVUS to create the intensity map for each field. For phantom dose calculation, the simulated phantom was built from the phantom’s CT data with up to 128×128×128 voxels and 0.3 cm3 voxel size. 900 millions photon histories were simulated such that the uncertainty in Monte Carlo results was less than 2% in the target for all calculations.
Process analysis A process is considered as any individual combination of equipment and procedures to obtain a result. A total of 11 processes were studied. These consisted of: 1) PB/IC using a solid water phantom, 2) MC/IC using a solid water phantom, 3) IC/MC using the CIRS phantom in lung, 4) PB/MC using the CIRS phantom in lung, 5) TLD/MC using the CIRS phantom in lung, 6) IC/MC using the CIRS phantom in tissue, 7) PB/MC using the CIRS phantom in tissue, 8) TLD/MC using the CIRS phantom in tissue, 9) IC/MC using the CIRS phantom in bone, 10) PB/MC using the CIRS phantom in bone, and 11) TLD/MC using the CIRS phantom in bone. Control charts require that homogeneous subgroups are obtained from the process for the purpose of calculating the control limits. Each individual IMRT QA percent difference between measurement and calculation is considered as a homogeneous subgroup of size one. The percent differences for
mR d2 n
mR , respectively where the bias correction d2 n
factor d2 is equal to 1.128 for the case n = 1(Wheeler and Chambers 1992). When the data are normally distributed, the risk of a false positive is less than 1%, which is a property of the normal distribution. If the data do not follow a normal distribution, the risk of a false is still low but not equal to that of the normal distribution. All 15 cases from each process were used to determine the control limits. In the case of the TLD measurements, all 5 cases were used to determine the control limits. The average of the percent differences is designated as the process target,X and is used for the center line of the control chart. The capability indices Cp and Cpk are commonly used to quantify process performance. Both of the indices need to be used together to adequately describe process performance. We elected to use the capability index Cpm (Chan et al., 1988) because, in one number, it accounts for both the proximity of the process to the target value as well as the magnitude of process variation. It is given by,
Cpm
USL LSL
6 2 X T
2
where USL -LSL is the difference between the upper and lower clinical specification limits, is the variance, is the mean, and T is the target value for the process (0% for IMRT QA). Processes will have Cpm values greater than 1.33 if they are operating optimally (Pillet et al., 1997). Values less than 1.33 indicate that a process contains excessive variability compared to the specifications and/or the process is off target. In this work, IMRT QA process performance was compared against two different clinical specification limits, namely, 3% and 5%. The clinical specification limits represent the difference between a measured and calculated value, expressed as a percentage.
Results Table 1 shows the results for the percentage dose difference for all 11 processes in this study. The largest average percent difference was for the lung PB/MC process at 5.8% with a minimum of -2% and a maximum of 11.4%. The average percent difference for all other processes was within 2%.
Dosimetry in the conventional water-equivalent slab phantom IMRT plans of all the patients were first delivered to a rectangular homogeneous water-equivalent phantom as part of Volume 2(3): 063-069 (2010) - 065
lishing Pub G r CS
p ou
J Cancer Sci Ther ISSN:1948-5956 JCST, an open access journal
of the moving range between successive percent differences. The upper and lower control charts limits for individual values
OM I
To convert the MC calculated dose per fluence to dose per MU, a calibration factor was calculated by performing a MC dose calculation with the same linac calibration conditions in water. The calibration factor was implemented in the MCSIM code to perform absolute dose calculation. Dose to material was determined for all simulations.
Upper and lower control chart limits are given by
UCL X 2.66 mR a n d LCL X 2.66 mR , r e s p e c t i v e l y where X is the average percent difference and mR is the average
Citation: Aljarrah K, Pawlicki T, Tyagi N, Jiang SB (2010) Evaluation of IMRT QA Point Measurement Rocesses Using a Commercial Heterogeneous Phantom. J Cancer Sci Ther 2: 063-069. doi:10.4172/1948-5956.1000025
Process PB/IC MC/IC IC/MC PB/MC TLD/MC IC/MC PB/MC TLD/MC IC/MC PB/MC TLD/MC
Phantom
Mean (%) -0.6 -0.7 1.1 1.0 0.8 0.1 0.2 0.2 -1.8 5.8 -1.4
Solid H2O Bone
Tissue
Lung
Standard deviation (%) 1.1 1.2 1.9 1.4 1.7 1.9 2.2 1.2 1.9 3.5 2.0
Minimum (%) -2.6 -2.5 -1.9 -2.5 -1.9 -3.1 -4.1 -1.1 -3.9 -2.0 -3.6
Maximum (%) 1.4 1.6 5.7 2.6 2.8 3.6 4.4 1.6 1.7 11.4 1.8
Table 1: This table shows the mean, 1 standard deviation, minimum and maximum for all 11 processes. Results are percent difference between normalized planned doses. Process
Phantom
PB/IC MC/IC PB/IC MC/IC PB/IC IC/MC PB/MC TLD/MC IC/MC PB/MC TLD/MC
Solid H2O Bone
Tissue
Lung
Cpm 3% clinical specifications
Cpm 5% clinical specifications
0.82 0.72 0.45 0.59 0.52 0.53 0.45 0.85 0.38 0.15 0.40
1.36 1.21 0.75 0.99 0.86 0.89 0.75 1.41 0.64 0.25 0.67
Clinical specifications for Cpm = 1.33 4.9 5.5 8.8 6.7 7.7 7.5 8.8 4.7 10.4 26.9 9.9
Table 2: This table shows the process target and process capability (Cpm) for the 11 IMRT QA processes considered in this study against 3% and 5% clinical specifications. The last column of the table show the required clinical specification limit required to achieve Cpm = 1.33 (as a percent difference from the plan normalized dose) that would be required to reach an optimal performing process.
the regular IMRT QA procedure. The dose was measured using the IC at the target isocenter and compared with calculations performed using MC and PB calculation. Figure 2 shows control chart for the percentage dose difference between IC measurements and both MC and PB dose calculation. The point dose calculation at the target isocenter for all the plans agree within 2 – 3% with the measured data in the homogeneous medium which is within the statistical uncertainty for MC simulations and IC measurements. The MC calculated dose at the target isocenter point agrees within 2% with the PB calculation.
Conventional water-equivalent slab phantom
Percentage dose differences between the PB algorithm and IC measurements with respect to MC calculations were evaluated for all 15 patients in lung, tissue, and bone. The target location in the QA phantom was selected in regions corresponding to the target isocenter in the patient plans, and hence located in high dose regions. The PB calculated dose systematically overestimates MC calculations by about 6% in the lung regions. The difference between MC calculations and IC measurement are within 4% inside lung. The percentage dose difference between MC calculations and dose measured using the IC and TLDs in bone and tissue regions were within ±4% except for one IC/MC case in bone.
Process analysis PB / IC
MC / IC
3.0 2.0
1.85
UCL
1.0 0.0 -0.59 -1.0 -2.0 -3.0
LCL
-3.03
-4.0 0
2
4
6
8
10
12
14
16
Patient number Figure 2: Dose comparison of the percentage dose difference between PB, MC and the IC measurement in a convention slab water-equivalent phantom. The upper and lower control limits for the PB/IC IMRT QA process are denoted by UCL, and LCL, respectively.
Figure 3a, Figure 3c show the control charts for the percentage difference between MC calculations, IC measurements, TLD measurements and PB calculations for all the patients at points located in lung, tissue, and bone respectively. Note that only the control chart limits for the PB/IC process is shown in each figure. All processes are operating in control. Volume 2(3): 063-069 (2010) - 066
CS
lishing Pub G
r p ou
J Cancer Sci Ther ISSN:1948-5956 JCST, an open access journal
Table 2 shows the process capability index Cpm for both 3% and 5% clinical specifications. Neither process is capable of meeting the 3% clinical specifications for the solid water-based IMRT QA processes. Similarly, none of the IMRT QA processes using the CIRS phantom are able to meet the 3% clinical specification. At 5% specifications, both the solid water PB/IC and the CIRS phantom tissue TLD/MC processes are operating with Cpm greater than 1.33. Also shown in Table 2 are the clinical specifications that would be necessary for each process to achieve Cpm = 1.33 (the threshold value for an optimally operating process). These processes are able to meet clinical specifications ranging from 4.7% to 26.9%.
OM I
4.0
Dose difference (%)
Dosimetry in the CIRS heterogeneous thorax phantom
Journal of Cancer Science & Therapy - Open Access www.omicsonline.org
Research Article OPEN ACCESS Freely available online doi:10.4172/1948-5956.1000025
JCST/Vol.2 Issue 3 Discussion
CIRS phantom - Lung IC / MC 15.0
PB / MC
TLD / MC
UCL
14.89
Dose difference (%)
12.0 9.0 6.0
5.80
3.0 0.0 -3.0
-3.30
LCL
-6.0 0
2
4
6
8
10
12
14
16
Patient number
B
CIRS phantom - Tissue IC / MC
PB / MC
TLD / MC
6.0 UCL
4.96
Dose difference (%)
4.0 2.0 0.23
0.0 -2.0 -4.0
-4.51
LCL
-6.0 0
2
C
4
6
8 10 Patient number
12
14
16
CIRS phantom - Bone IC / MC
PB / MC
TLD / MC
6.0 UCL
4.70
Dose difference (%)
4.0 2.0 0.95 0.0 -2.0 LCL
-2.80
-4.0 -6.0 0
2
4
6
8
10
12
14
16
Patient number Figure 3: Percentage dose difference between MC calculations, IC measurements, and PB calculation for points located in: (a) lung, (b) tissue, and (c) bone. The upper and lower control limits are denoted by UCL, and LCL, respectively. The solid lines in the plots represent the center line, and upper and lower control limits for the PB/MC IMRT QA process.
Dose verification in inhomogeneous medium such as lung shows a difference between MC calculation and PB TPS calculation. Dose was previously verified in a slab geometry and for a single beam (Boyer and Mok, 1986; Metcalfe et al., 1993; Charland et al., 2003; Carrasco et al., 2004; Krieger and Sauer, 2005; Paelinck et al., 2005; Blazy et al., 2006; Tyagi et al., 2008). Other studies verified the dose in a thorax type phantom. Davidson et al. (2007) showed that the CORVUS pencil beam algorithm overestimated the dose by 10 – 15% in tumor, heart, and cord relative to the measured TLD using an anthropomorphic phantom (Davidson et al., 2007). Ma et al. (2000) found 4% dose difference between MC and Corvus in a cylindrical water phantom with various hypothetical target shapes. They also found Discrepancies of more than 5% in the target region and over 20% in the critical structures were found in some IMRT patient (Ma et al., 2000). Ma et al. (2000) verified IMRT dose accuracy in a homogeneous PMMA QA cylindrical phantom (Ma et al., 2003). In that study, 2 cm diameter lung and bone cylindrical inserts were used to evaluate the dose to both mediums. They found 5% discrepancy for one patient between MC and CORVUS in the bone insert. McDermott et al. (2003) showed a comparison between MC calculated dose using MCNP and CORVUS TPS in an anthropomorphic phantom (McDermott et al., 2003). They found up to 10% difference in the high dose region and 5% dose difference to the CTV between MC and TPS when the target was located in the right lung and mediastinum. Some differences between the MC, PB, IC, and TLD results (and their associated processes) may be attributed to the dose conversion from dose to medium to dose to water. PB-based algorithms calculate the dose to water while MC reports the dose to the medium. The differences as discussed by Siebers et al. (2000) are about 1, 10, and 13% for lung, bone, and air, respectively (Siebers et al., 2000). PB-based algorithms are based on path length correction which does not account for the lateral scattered dose. Differences of MC and PB from measurements are due to the reasons that measurements are susceptible to fluence perturbations by the medium composition and medium interfaces. The reference calibration for ion chambers (water phantom, 10×10 cm2, depth = 5, SSD=100cm), for example, is not valid for IMRT fields in the presence of heterogeneities where lateral electronic disequilibrium may effect the chamber fluence correction factor. For single static IMRT field the correction factors could be as high as 10% and requires a field dependent correction factor (Bouchard et al., 2004). The effect of the fluence factor is reduced when the measurement device is located in a flat dose gradient region. There are many other sources of systematic errors such as Volume 2(3): 063-069 (2010) - 067
CS
lishing Pub G
r p ou
J Cancer Sci Ther ISSN:1948-5956 JCST, an open access journal
The overall goal of this work was to analyze different IMRT QA processes using a commercial heterogeneous phantom with different measurement tools and calculation algorithms. In particular, we used control charts and the capability index Cpm to characterize process performance. Due to the retrospective nature of this analysis, it was not our intent nor was it possible to identify specific errors that were identified by the control charts or the capability index. However, we can point to some issues that may have contributed to the results.
OM I
A
Citation: Aljarrah K, Pawlicki T, Tyagi N, Jiang SB (2010) Evaluation of IMRT QA Point Measurement Rocesses Using a Commercial Heterogeneous Phantom. J Cancer Sci Ther 2: 063-069. doi:10.4172/1948-5956.1000025
All 11 IMRT QA processes studied were in control. In practice, as soon as a result is obtained out of the control limits, then the physicist should immediately identify the reason for the systematic error (e.g., measurement setup, MC input parameters, etc.). The process target (mean value) was non-zero at approximately 0.6 – 0.7%, which could imply an error in the calibration or that other errors are present as well. Phantom setup and the daily variation of machine output should be within 3% so one might expect a process to perform within a 3 or even 5% specifications. However, from a process control point of view, the magnitude and frequency of errors that arise in the process can not be assumed to vary within any expected range. A process could produce a result within or outside those specifications at any time. This is because process performance depends on many additional factors some of which are known and others which are unknown. One is ultimately concerned with answering the question whether or not a process produces the same expected results over time. Control chart limits depend on the magnitude of case-to-case variation, which has been shown as an effective way to identify errors in a process. It is important to identify what is the minimum necessary complexity for QA procedures to efficiently identify errors that indicate a plan may have a negative clinical impact on the patient. In order to achieve this, one requires a metric to indicate process performance against clinical specifications. We have used the capability index, Cpm. The results show (5th column of Table 2) that the processes of IMRT QA are largely not capable of meeting clinical specifications at either the 3% or 5% level. These results are specific to the equipment, protocol, and staff at the institution where the data was acquired. There are some differences comparing the results using Cpm to that of process ability as defined by Pawlicki et al. (2008a); Pawlicki et al. (2008b). For example, using the process ability at 3% and 5% clinical specifications, there are correspondingly 1 of 11 and 5 of 11 processes performing acceptability. In contrast, using Cpm we find 0 of 11 and 2 of 11 of the processes performing acceptably for the 3% and 5% clinical specifications, respectively. Even 10% clinical specifications, only 9 of 11 processes perform acceptably. Cpm is a more comprehensive indicator of process performance compared to process ability. Part of the reason for this is that the process ability is similar to the capability index Cp and does not account for the proximity of the measurements to the target value. Standardization of capability indices is necessary to make this approach clinically useful and relevant across different institutions so that all institutions use the same capability indices when comparing process performance. The capability analysis shows that sophisticated phantoms and calculation algorithms alone are not enough to ensure high quality IMRT lung treatments. Either the clinical specifications need to be relaxed or processes of IMRT QA need to be reengineered to meet the demands of the clinical specifications.
In this study, the CIRS heterogeneous thorax phantom has been investigated for routine IMRT QA using different measurement and calculation methods. Dose to different locations in the phantom, measured and calculated using IC measurements, and PB calculations were compared with the MC simulations. The PB algorithm overestimated the dose in the lung as compared to measurements and MC simulations but showed good agreement inside bone and tissue equivalent material. Measurements showed good agreement with MC calculations for majority of the patients in lung, bone and tissues. The ability of the processes to meet clinical specifications was found to be limited, however. The results also indicate that additional refinements of the IMRT QA processes are required. This is especially true for calculations and measurements in lungequivalent media. A process capability index (Cpm) was a useful quantitative parameter for comparing different processes of IMRT QA. Acknowledgments The authors would like to acknowledge Dr. Styliani Flampouri for her helpful discussions. Also we would like to thank Mr. Andrew Kaplan for his help with computer cluster used in this work.
References 1. Aljarrah K, Sharp GC, Neicu T, Jiang S (2006) Determination of the initial beam parameters in Monte Carlo linac simulation. Med Phys 33: 850-58. » CrossRef » PubMed » Google Scholar
2. Arriagada R, Komaki R, Cox JD (2004) Radiation dose escalation in non-small cell carcinoma of the lung. Semin Radiat Oncol 14: 287-91. » CrossRef » PubMed » Google Scholar
3. Bouchard H, Seuntjens J (2004) Ionization chamber-based reference dosimetry of intensity modulated radiation beams. Med Phys 31: 2454-65. » CrossRef » PubMed » Google Scholar
4. Breen SL, Moseley DJ, Zhang B, Sharpe MB (2008) Statistical process control for IMRT dosimetric verification. Med Phys 35: 4417-4425. » CrossRef » PubMed » Google Scholar
5. Breitman K, Rathee S, Newcomb C, Murray B, Robinson D, et al. (2007) Experimental validation of the Eclipse AAA algorithm. J Appl Clin Med Phys 8: 76-92. » CrossRef » PubMed » Google Scholar 6. Chan LK, Cheng SW, Spiring FA (1988) A New Measure of Process Capability: Cpm. Journal of Quality Technology 20: 162-175. » CrossRef » PubMed » Google Scholar 7. Davidson SE, Ibbott GS, Prado KL, Dong L, Liao Z, et al. (2007) Accuracy of two heterogeneity dose calculation algorithms for IMRT in treatment plans designed using an anthropomorphic thorax phantom. Med Phys 34: 1850-7. » CrossRef » PubMed » Google Scholar
8. Gerard K, Grandhaye JP, Marchesi V, Kafrouni H, Husson F, et al. (2009) A comprehensive analysis of the IMRT dose delivery process using statistical process control (SPC). Med Phys 36: 1275-85. » CrossRef » PubMed » Google Scholar 9. Jiang SB, Boyer AL, Ma CM (2001) Modeling the extrafocal radiation and monitor chamber backscatter for photon beam dose calculation. Med Phys 28: 55-66. » CrossRef » PubMed » Google Scholar
10. Ma CM, Pawlicki T, Jiang SB, Li JS, Deng J, et al. (2000) Monte Carlo verification of IMRT dose distributions from a commercial treatment planning optimization system. Phys Med Biol 45: 2483-2495. » CrossRef » PubMed » Google Scholar
11. McDermott PN, He T, DeYoung A (2003) Dose calculation accuracy of lung planning with a commercial IMRT treatment planning system. J Appl Clin Med Phys 4: 341-51. » CrossRef » PubMed » Google Scholar 12. Palta JR, Liu C, Li JG (2008) Quality assurance of intensity-modulated radiation therapy. Int J Radiat Oncol Biol Phys 71: S108-S112. » CrossRef » PubMed » Google Scholar
Volume 2(3): 063-069 (2010) - 068
CS
lishing Pub G
r p ou
J Cancer Sci Ther ISSN:1948-5956 JCST, an open access journal
Conclusions
OM I
dose grid resolution, MC statistical considerations (De Smedt et al., 2005; Isambert et al., 2010), and the location of bone and tissue measurement point in low dose volumes under the jaws that may present as a systematic error in the process of IMRT QA. These sources of error are a contributing factor to the variability observed in the results.
Journal of Cancer Science & Therapy - Open Access www.omicsonline.org
14. Pawlicki T, Yoo S, Court LE, McMillan SK, Rice RK, et al. (2008b) Moving from IMRT QA measurements toward independent computer calculations using control charts. Radiother Oncol 89: 330-337. » CrossRef » PubMed » Google Scholar 15. Pillet M, Rochon S, Duclos E (1997) SPC - Generalization of capability index
Cpm: Case of unilateral tolerances. Quality Engineering 10: 171-176.
» CrossRef
» PubMed » Google Scholar
16. Siebers JV, Keall PJ, Nahum AE, Mohan R (2000) Converting absorbed dose to medium to absorbed dose to water for Monte Carlo based photon beam dose calculations. Phys Med Biol 45: 983-95. » CrossRef » PubMed » Google Scholar 17. Wheeler DJ, Chambers DS (1992) Understanding Statistical Process Control. Knoxville SPC Press. » CrossRef » PubMed » Google Scholar
Volume 2(3): 063-069 (2010) - 069
CS
lishing Pub G
r p ou
J Cancer Sci Ther ISSN:1948-5956 JCST, an open access journal
JCST/Vol.2 Issue 3
OM I
13. Pawlicki T, Yoo S, Court LE, McMillan SK, Rice RK, et al. (2008a) Process control analysis of IMRT QA: implications for clinical trials. Phys Med Biol 53: 5193-5205. » CrossRef » PubMed » Google Scholar
Research Article OPEN ACCESS Freely available online doi:10.4172/1948-5956.1000025