Dec 4, 2017 - ABSTRACT: The method for estimating the mean of square error, kurtosis and error correlation coefficient for deviations from the average range ...
http://www.transnav.eu
the International Journal
Volume 11
on Marine Navigation
Number 4
and Safety of Sea Transportation
December 2017 DOI: 10.12716/1001.11.04.10
Evaluation of Navigation System Accuracy Indexes for Deviation Reading from Average Range A.V. Boykov Admiral Makarov State University of Maritime and Inland Shipping, Moscow, Russia
V.A. Mikhalskiy & V.N. Ivantsov The State Research Navigation ‐ Hydrographic Institute, Saint‐Petersburg, Russia
ABSTRACT: The method for estimating the mean of square error, kurtosis and error correlation coefficient for deviations from the average range of three navigation parameter indications from the outputs of three information sensors is substantiated and developed.
1 INTRODUCTION In modern navigation, there is a contradiction between the need for solving probabilistic problems, for example, the calculation of the navigation safety indications, and the lack of the necessary initial data. Such initial data are the parameters of navigation parameters accuracy (NP): the root‐mean‐ square error (RMSE) m, the excess E, characterizing the form of the law of error distribution ED, and the correlation coefficient of latitude errors r (Latitude) and the longitude of the shipʹs position (Longitude) . Therefore, the task of estimation the INS accuracy indicators in the process of operation in the specific operation conditions of the INS based on the internal signals of the IntNS is very relevant. These internal signals are the readings of three or two INS that are part of the IntNS.
y*i=
1 (y1i+y2i+y3i), 3
(1,b)
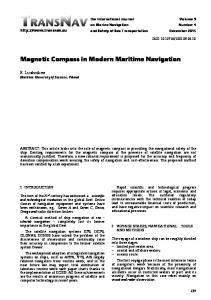
And similar calculations are made for the testimony of other two INS. Here, the symbols denote: j ‐is the INS number, i‐ is the sequence number of the measurements or the time point. Figure 1 shows the diagram of the variation in latitude production latencies, in conventional units, and deviations of the same NP for the day of navigation. Contemplating the diagram, we find that the deviations as a whole reflect well the change in the errors in time. This allows us to assume that by evasion, it is possible to estimate correctly the accuracy indices of NP.
The estimation of indications during the voyage is conducted with a discreteness of t=1 or 2 h diagrams and tables of deviations u between the samples yji NP from the outputs of three INS and their average value y*i, for example, for INS‐1: u1i=y1i–y*i;
(1,а) 641
make the second approximation for the unknown RMSE (root‐mean‐square error) my1 with respect to (3, a) my1=mu1 1 / 0,57 =kmu1=1,32mu1
(5,b)
Kurtosis of deviation is calculated according to the formula: 1 E n(
Figure 1 ‐ Graphs of errors (solid line) and deviations (dashed line) latitude of INS, conventional units.
Method of estimation accuracy figure. When we estimate the accuracy indices by the deviations of uji 1 from the average of three readings, У*i= (у1i+y2i+y3i), 3 y3i), for example, for the first INS‐1 at the i‐th time of , the deviation u1i=y1i–y*/ . The unknown error х1i NP y1 of the first INS at i moment of time equals
u 1 u ) n 1, 45
m2y1=m2u1+m2y*+2rmu1my*;
m2u1=
1 n 1,45
u n
1
2 i
,
(3,а)
(3,b)
n 2 2 i 1
3
(6)
where n – is the number of deviations and
1 n 1,45
u n
1
2 i
=m2u ‐is the root‐mean‐square value
of deviation. Covariance and correlation coefficient of errors by means of deviations can be computed from the formulas:
х1i=u1i+y*i This error cannot be determined, because Equation (2) contains two unknowns, but it is possible for n values u1i to determine MSE mx1=my1 of values Y1[2]. In accordance with the theorem on the variance of the probability theory function [3], the RMSE my1 of the sought‐for value y1 equals:
n 4 in
1
Rlat.longl
1 n
u n
1
Шi
u Дi ;
Rlat.longl RШД/mШmД.,
(7,а)
(7,б)
where ulat.i and ulong.i ‐ are INS reading deviation mlat. и mlong.k ‐ the root‐mean‐square value of deviation computed from the formula (3,b); n ‐ the number of deviations in the cycle of determination of the correlation coefficient. The validity checking of the method.
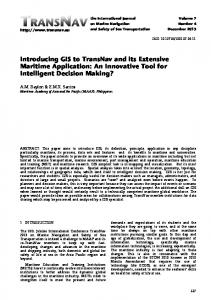
To check the validity of the method computed from formulas (3) ‐ (5) and (6), the empirical ratio of the Root‐Mean‐Square Error k*=my2/mu2 was rated according to the data of the INS operating within 8 days, indications of which were recorded every hour. The results we can find in Table1 below, show the value of the Root‐Mean‐Square Error my computed from the formula (3,b) where х2=у2–уэт2 is taken in place of u, and the value of the Root‐Mean‐ ru,y* =m2об/mumy*, Square Error mu2 of the second INS, which is the least where mоб ‐ RMSE of general deviation for u and precision device of the above three INS within у*, which, taking 1 into account (1, b), can be taken twenty‐four hours of observation. 2 equals to m об my*. Where уэт2 is calibration value of Navigation 3 Parameters. We take r = 0 at first‐order estimate in (3, a), then m2y1=m2u1+m2y*. In the same table, the values of kurtosis calculated 2 2 for errors and deviations are also given. If 1we express m y* in terms of (3, a) m y1 as m2y*= my1,, then we arrive at : where n –is the number of deviations; (n–1,45) ‐ the number of deviations, is corrected in accordance with the Student distribution law; r=ru,y* ‐ deviation correlation coefficient u average values of NP у*, which can be found from the relation
3
2y1
m ‐ 0,3 m2y1=0,67m2y1=m2u1,
and finally my1=mu1
1 / 0,67 =1,23mu1.
(5,а).
Now it is possible to determine the correlation coefficient r plugged the obtained values in (4) and to 642
Table 1. The results of the analysis of the possibility to estimate the INS accuracy values according to the NP deviations from the mean values, nominal units __________________________________________________________________________________________________ Date Value Latitude Longitude Error Deviation Compar. Error Deviation Compar. __________________________________________________________________________________________________ 25.10 RMSE, n.u. 0,08 0,06 1,32 + 0,17 0,12 1,42 + Kurtosis 2,9 2,6 26.10 RMSE, n.u. 0,21 0,16 1,31 + 0,25 0,18 1,39 + Kurtosis ‐0,5 0 > ‐0,7 0,7 > 27.10 RMSE, n.u. 0,03 0,02 1,5 ‐ 0,08 0,09 0,89 ‐ Kurtosis ‐0,9 ‐1,3 28.10 RMSE, n.u. 0,06 0,05 1,2 + 0,26 0,17 1,53 + Kurtosis 0,7 1,5 > ‐0,1 ‐0,4