Haeussler et al. Genome Biology (2016) 17:148 DOI 10.1186/s13059-016-1012-2
RESEARCH
Open Access
Evaluation of off-target and on-target scoring algorithms and integration into the guide RNA selection tool CRISPOR Maximilian Haeussler1* , Kai Schönig2, Hélène Eckert3, Alexis Eschstruth4, Joffrey Mianné5, Jean-Baptiste Renaud6, Sylvie Schneider-Maunoury4, Alena Shkumatava3, Lydia Teboul5, Jim Kent1, Jean-Stephane Joly6 and Jean-Paul Concordet7*
Abstract Background: The success of the CRISPR/Cas9 genome editing technique depends on the choice of the guide RNA sequence, which is facilitated by various websites. Despite the importance and popularity of these algorithms, it is unclear to which extent their predictions are in agreement with actual measurements. Results: We conduct the first independent evaluation of CRISPR/Cas9 predictions. To this end, we collect data from eight SpCas9 off-target studies and compare them with the sites predicted by popular algorithms. We identify problems in one implementation but found that sequence-based off-target predictions are very reliable, identifying most off-targets with mutation rates superior to 0.1 %, while the number of false positives can be largely reduced with a cutoff on the off-target score. We also evaluate on-target efficiency prediction algorithms against available datasets. The correlation between the predictions and the guide activity varied considerably, especially for zebrafish. Together with novel data from our labs, we find that the optimal on-target efficiency prediction model strongly depends on whether the guide RNA is expressed from a U6 promoter or transcribed in vitro. We further demonstrate that the best predictions can significantly reduce the time spent on guide screening. Conclusions: To make these guidelines easily accessible to anyone planning a CRISPR genome editing experiment, we built a new website (http://crispor.org) that predicts off-targets and helps select and clone efficient guide sequences for more than 120 genomes using different Cas9 proteins and the eight efficiency scoring systems evaluated here.
Background The CRISPR/Cas9 “revolution” [1] is sweeping through the life sciences. As more researchers face the task of selecting an optimal Cas9 guide RNA sequence that targets a genome sequence of interest, the overall specificity of the technique is still under discussion: highthroughput cell culture studies have found numerous off-targets not predicted by existing algorithms, sometimes even involving 1-bp indels (“bulges”) in the alignment with the guide sequence [2, 3], while studies in * Correspondence:
[email protected];
[email protected] 1 Santa Cruz Genomics Institute, MS CBSE, University of California, 1156 High Street, Santa Cruz, CA 95064, USA 7 INSERM U1154, CNRS UMR 7196, Muséum National d’Histoire Naturelle, Paris, France Full list of author information is available at the end of the article
Drosophila, Caenorhabditis elegans, zebrafish, and mice have found virtually no off-target effects [4–6]. The guide sequence also determines the efficiency of ontarget cleavage [7, 8]; thus, current genome editing protocols recommend [9] that researchers select guides carefully to minimize potential off-target effects and test several to optimize on-target activity. Although published tools and scoring systems allow ranking sequences by specificity [10–22] and efficiency [2, 8, 23–25], they are usually limited to a handful of genomes and only few evidence-based recommendations exist to optimize offtarget search parameters and on-target efficiency. In this article, we compare existing scoring systems against published datasets and our own experimental data. The optimal selection parameters that we identified were integrated into a new CRISPR/Cas9 guide designer tool.
© 2016 The Author(s). Open Access This article is distributed under the terms of the Creative Commons Attribution 4.0 International License (http://creativecommons.org/licenses/by/4.0/), which permits unrestricted use, distribution, and reproduction in any medium, provided you give appropriate credit to the original author(s) and the source, provide a link to the Creative Commons license, and indicate if changes were made. The Creative Commons Public Domain Dedication waiver (http://creativecommons.org/publicdomain/zero/1.0/) applies to the data made available in this article, unless otherwise stated.
Haeussler et al. Genome Biology (2016) 17:148
Results and discussion We developed a novel web-based tool, CRISPOR (http:// crispor.org), to assist with guide selection in 120 genomes, including plants and many emerging model organisms, and pre-calculated results for all human coding exons as a UCSC Genome Browser track. To evaluate off-target prediction accuracy, we took advantage of eight recently published studies that detected and quantified off-target cleavage sites [2, 3, 7, 26–29] (summarized in Additional file 1: Table S1) and from these collected 650 off-target sequences that were experimentally identified for 31 different guides (Additional file 2). The assays differed mostly in sensitivity (Additional file 3: Figure S1; Additional file 4: Table S2, and Additional file 5: Table S3). Two studies [3, 28] did not validate identified off-targets with PCR amplicon sequencing in the same cell type and may include false positives. We noticed two outliers, VEGFA_site2 and HEK293_sgRNA4, from the study by Tsai et al. [3]. The two guides are responsible for 151 and 133 off-targets, respectively. Together they account for 44 % (284/650) of all off-target sequences in our dataset and 71 % (84/ 119) of the off-targets with five or more mismatches. They also have the highest GC content in the Tsai et al. data, 80 % and 75 %, respectively (Additional file 6: Figure S2). A relationship between GC content and specificity is known from siRNA design [30] and would
Page 2 of 12
explain the previously observed difficulty to target GC-rich genes [2, 8, 31] and quadruplex-forming sequences [32]. Of all four million unique -NGG guide sequences in human coding exons, the ones with a GC content >75 % constitute only 13 %, so they can usually be avoided. We therefore removed these two guides from further analysis. One issue with the remaining data was the sensitivity of the assays. The two assays using targeted sequencing of predicted sites reported off-targets with a modification frequency lower than 0.001 % [7, 29] while all whole-genome assays estimated their sensitivity at around 0.1–0.2 % [2, 3, 33] (Additional file 1: Table S1; [26, 28] did not report sensitivity). This means that the rare off-targets found in targeted sequencing studies cannot be compared with those from whole-genome assays. We therefore chose to analyze only off-targets that can be detected with whole-genome assays, with a modification frequency >0.1 %. Of the remaining 225 off-targets, most (88.4 %) had up to four mismatches relative to the guide (Fig. 1). All others had five or six mismatches but with low modification frequencies, 1 % are missed (data not shown). We next examined the ranking of guides by specificity. The MIT scores of all potential off-targets of a guide can be summarized into the “guide specificity score” defined by [7], which ranges from 0–100 (100 = best). Figure 3a shows that higher specificity scores are generally associated with fewer off-target sites and lower off-target modification frequencies, as expected. In contrast, a few guides had unusually strong off-targets, illustrating that the scoring model could still be improved, possibly by using the CFD off-target score or taking into account the chromatin context [3, 7]. However, a single score for guide specificity may not always be valuable. For example, intergenic off-targets may be considered a minor
Haeussler et al. Genome Biology (2016) 17:148
A
Page 4 of 12
B
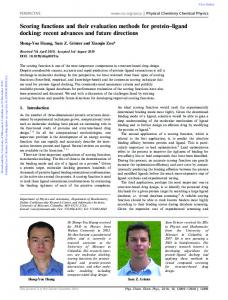
Fig. 3 Cross-study analysis of MIT specificity scores as calculated by CRISPOR versus the number and strength of off-targets found. a For 31 guide sequences, CRISPOR guide specificity scores are shown (x-axis), as well as the number of off-targets (y-axis) and sum of off-target modification frequencies (circle size). The guide with a specificity score of 88 has no single detected off-target. b The specificity scores of 31 tested guide sequences (blue) versus the specificity scores of all unique guides (unique 20mers followed by NGG) in human coding regions (green). Specificity scores were calculated using the CRISPOR website. For a version of this figure with specificity scores calculated by the MIT site, see Additional file 9: Figure S4
issue for functional studies in cultured cells. When transgenic animals are back-crossed, off-targets on a different chromosome will not co-segregate with the mutation of interest and may often be acceptable. Therefore, while CRISPOR shows the MIT specificity score as an indicator of guide quality, all potential off-targets are annotated and shown for detailed inspection. We ranked the four million unique guide sequences in human coding regions by MIT specificity score. We observed that the guides tested in the eight off-target studies exhibit relatively low specificity scores relative to the genome average (Fig. 3b). The relatively low specificity scores make the high number of off-targets that were found less surprising. As a result, there is currently limited data on guides with high specificity scores that are more relevant when designing an experiment. Figure 3b shows that the more specific guide RNAs that were tested as well as about 30 % of the guide sequences in human coding regions exceed a specificity score of 50. Therefore, the CRISPOR website highlights guides with a minimum MIT specificity score of 50. With the MIT website, as it misses some off-targets, the cutoff should be higher, around 70–80 (Additional file 9: Figure S4). In addition to off-target cleavage, we evaluated predictions of on-target efficiency, including eight different scoring models and two heuristics. For this purpose, we collected activity data for more than 19,000 guides, including data sets used to build the scoring models [6, 8, 23–25, 34, 38, 39] and from independent studies in cultured cells and ascidian oocytes and from zebrafish screens [31, 40–43]. Additional file 10: Table S5 summarizes the studies and the different assay types. For datasets where replicates are available, the Spearman correlation is in the range 0.71–0.77 (Additional file 11: Table S6; Hct116, mouse embryonic stem cells) for the same assay in the same cell type. This gives an indication
of the quality of the data and suggests that a correlation of about 0.7 constitutes an upper limit of any prediction. For some datasets, the assay was repeated in a different cell type. In these cases, the correlations were almost identical for some cell type combinations (e.g., 0.75 for Hl60/Kbm7 [38]; Additional file 11: Table S6) and lower for others (0.53–0.63 for Rpe1 cells [41]). If these lower correlations are due to differences in the chromatin state, this suggests that its influence varies and is relatively modest, at most 10–20 % of the rank correlation. The heat map in Fig. 4 shows that on independent datasets, those not used to train any algorithm such as Hart et al. [41], current predictions achieve Spearman correlations of 0.341–0.436 (see Additional file 12 for plots of individual data points). In cases when algorithms are applied to their own training dataset the correlations are higher, but this is an artifact, known as algorithmic overfitting; we show the corresponding correlation values in grey in Fig. 4. We observed that the quality of the assay is an important parameter. For example, for a dataset obtained with Surveyor Nuclease, we found no significant correlation between guide activity and any of the scores (see “Liu” in Additional file 13: Figure S5). Another example is the Housden et al. score [44], which did not predict well the activity in any dataset, including its own. This may be due again to the accuracy of the activity measurements or a result of the statistical model used by Housden et al., a weight matrix. The dataset “Wang 2015” was designed with a scoring algorithm and shows very little signal. The dataset “Eschstruth” is very small and includes several guides that were selected based on very high Doench scores. In the Chari et al. study [24], the dataset from K562 cells was not correlated with two replicates of the same assay in HEK293T cells, so we only used the HEK293T dataset, like Chari et al. themselves. We do
Haeussler et al. Genome Biology (2016) 17:148
Page 5 of 12
Fig. 4 Heat map of Spearman rank correlation coefficients between efficiency scores and datasets. For each dataset, the experimental system is indicated by a species icon or cell type. Number of guides tested are shown in parentheses. Scores are shown along the horizontal axis, datasets on the vertical. Correlations of an algorithm against its own training dataset are shown in grey as they are likely to be overestimated due to overfitting. The datasets Wang/Xu HL60 and Koike-Yusa/Xu on mouse embryonic stem cells are originally from Wang et al. [38] and Koike-Yusa et al. [54] but were used as processed by Xu et al. [23]. From the dataset by Hart et al. [41], only the cell line Hct116/repeat2 was used, as it gave the highest correlation value; for this study efficiency was averaged over all time points. Data on human cell lines for the two datasets by Doench et al. [8, 34] are not shown here but gave an almost identical correlation profile. All data points are shown as scatter plots in Additional file 12; for assay background information on the datasets see Additional file 8: Table S4
not show these five datasets in Fig. 4 but instead in Additional file 13: Figure S5; the raw data are included in Additional file 14. Figure 4 shows that scores trained on mammalian cell lines work surprisingly well in other organisms, even in non-vertebrate ones, like Ciona intestinalis, C. elegans, and, to some extent, Drosophila, though in the latter only limited data are available. In contrast, the MorenoMateos score, an algorithm trained on zebrafish assays, does not translate well to all other datasets and vice versa. This is consistent with previous reports that the Doench score is not accurate in zebrafish [31, 40]. For this organism, guides are made by in vitro transcription with the T7 promoter and injected into eggs rather than expressed from exogenous DNA in cells from a U6 promoter. Without constant expression of the guide from a plasmid, the stability of guide RNA starts to play a bigger role [39]. Possible explanations for the difference in algorithm performance are, therefore, that RNA stability
or the promoter leads to differences in guide activity. By excluding artifacts (grey) in Fig. 4 and taking this separation into account, one can hypothesize that the Fusi/ Doench score performs best in U6 promoter-based assays and Moreno-Mateos best in assays based on delivery of guide RNAs produced by T7 in vitro transcription. To confirm this observation and to rule out an influence of the organism or the assay itself, we analyzed data from our own labs in the same way (Fig. 5). We tested two series of guides in cell cultures with two different assays (“K562-lacZ rank” and “U20S/MEF/C6-T7 endo”, 24 and 49 guides, respectively), injected one series of guides in zebrafish one-cell embryos (“Zebrafish-seq”, 163 guides) and another series in mouse embryos (“Mouse in vivo Seq”, 30 guides) (Additional file 15: Table S7). The data confirmed that zebrafish and cell culture results differ and most importantly they showed that the mouse in vivo data, using in vitro transcribed guide RNA, correlates best with the zebrafish-based
Haeussler et al. Genome Biology (2016) 17:148
Fig. 5 Heat map of Spearman rank correlation coefficients for the best two efficiency scores from Fig. 4 and four novel datasets from this study. Correlations are shown as in Fig. 4
predictor (Spearman P value 0.019; see Additional file 12 for P values and Additional file 14 for all frequencies and prediction scores where these data sets are called “Schoenig”, “Concordet”, “Shkumatava”, and “Teboul”, respectively). Correlation of the prediction score with observed absolute activity may disadvantage some algorithms. We therefore performed precision-recall curve analysis (Additional file 16: Figure S6) and also calculated precision/recall based on the overlap of the top quartile of the predictions with the top quartile of measured activity (Additional file 17: Figure S7). For the latter, we added two heuristics described by [6, 25], GC content in the last four base pairs and whether the guide ends with -GG. The results overall correspond to the performance as measured by correlation values; the Fusi/Doench and Moreno-Mateos scores perform best on the large datasets and depend on the expression system. Two prediction schemes can reach a relatively high precision: the Wong score [45] for cell cultures (U6 promoter) and the -GG rule for T7 in vitro transcription. However, their recall is relatively low; in the Doench 2014 dataset, for example, only 12.8 % of guides have a Wong score that is not zero and 13.2 % end with -GG. CRISPOR calculates all currently available scores and lets the user select the most suitable one for the particular assay/model organism. Based on Fig. 4, we recommend the Fusi/Doench score for guides expressed from a U6 promoter and the Moreno-Mateos score for experiments where guides are produced by T7 in vitro transcription. As an additional ranking criterion, when there is a large set of possible guides to pick from, the Wong score and -GG rule predict well efficient U6- and in vitro-transcribed guides, respectively. Are correlations of around 0.4 high enough to reduce the number of guides in practice? To demonstrate that the efficiency scores are useful not only when designing thousands of guides for genome-wide screens [38] but also in a more common genome editing project of just a
Page 6 of 12
few loci, we evaluated the prediction performance on the data from our labs shown in Fig. 5. For two datasets, we have screened multiple guides per locus to select the most efficient one and evaluated post hoc how much time could have been saved by using the appropriate prediction algorithm. In the K562 cell culture dataset, three guides each from eight loci in human, mouse, and rat were tested with an in vitro assay [46] (dataset “Schönig” in Additional file 14). For six out of eight loci, the highest Fusi/Doench score did predict the guide with the strongest cleavage (P = 0.032). In another set of 104 guides from 11 zebrafish loci (“Shkumatava” in Additional file 14), taking only two guides with the highest Moreno-Mateos score from each locus would have reduced the number of injections from 104 to 22 and still identified one of the top two guides for nine out of 11 loci (P = 0.024; no other score was significant). In both cases, a second round of screening would have been required, but the number of guides to screen could have been reduced by a third. In the case of the zebrafish screen, which are typically more time-consuming than cell culture assays, we estimate that we could have saved 250 h of work by using the Moreno-Mateos score. In addition and especially in mice, the ability of predicting guide RNA activity is a significant advance in terms of animal welfare as fewer animals will be required to create mutants.
Conclusions Our collection of off-target sites confirms that, overall and across all studies, bulges are rare and extremely GC-rich guides should rather be avoided. For the remaining sites, sequence-based prediction performance has to be seen relative to the sensitivity of the experimental system used to validate the off-targets. When using a cutoff on the CFD score, predictions contain 98 % of off-target sites validated by whole-genome assays (sensitivities > ~0.1 %), with a 43 % false positive rate. As targeted sequencing is the most sensitive assay for most applications, predicting off-target sites and validating them with targeted sequencing seem easier and more sensitive than any of the whole-genome off-target assays like Guide-Seq and Digenome-Seq. However, sites have to be predicted with a software package that reliably identifies sites with at least four mismatches, like CRISPOR or CasOffFinder, not the current versions of the CRISPR Design website (http://crispr.mit.edu/) or Ecrisp. Our comparison of on-target activity predictions confirms that they can significantly reduce the effort spent on screening guides, but we found that the prediction model trained on data from the same guide expression system (U6 versus T7 in vitro transcription) has to be used. In particular, Figs. 4 and 5 indicate that the results
Haeussler et al. Genome Biology (2016) 17:148
of guide injections into mouse oocytes, the most expensive experiment in this field, despite being the organism where thousands of cell culture data points are available, are currently best predicted by an algorithm trained on injection results from a non-mammalian organism, zebrafish. Our summary of all publicly available data, the predicted scores, and source code to calculate these should simplify future computational work on CRISPR/Cas9 off- and on-target predictions. For wet lab experimentalists who want to integrate the current state of the art into their experimental design, our website (http://cris por.org) includes pre-calculated results for all human exons on the UCSC Genome Browser tracks and can calculate off-target scores, all efficiency scores, CG content warnings, score cutoffs as presented in this article, and PCR primers in 120 genomes within minutes for any sequence of interest. We hope that the results and resources presented here will aid with future improvements and wider adoption of CRISPR/Cas9 offand on-target prediction algorithms and reduce the time spent on screening for off-targets and efficient guide sequences.
Methods
Page 7 of 12
The complete dataset consists of 30 guide sequences tested by 36 assays, 634 off-target sequences, and 697 cleavage frequencies, as some off-targets were detected by different assays. For an overview of all off-target studies see Additional file 1: Table S1; for the complete offtarget dataset see Additional file 2. Cleaning the off-target datasets
After removal of the two GC-rich guides and 0.01 % modification frequency filtering, the filtered dataset contained 225 modification frequency measurements of 179 off-target sequences for 31 tested guide sequences, of which 26 guide sequences contain off-targets >0.01 %. Off-target scores
From the description in the article [7] there are several possibilities to calculate the Hsu score; we used only the normalized aggregate frequencies which also gave the highest AUC. The off-target and specificity score of the MIT website were implemented based on source code by Hari Jay (https://snipt.net/harijay/fz-score-d1324dab/). We implemented the CROP-IT and CCTop off-target scores from the description in the original articles [36, 37]. For the CFD score [34], we received source code from the authors.
Individual off-target datasets and modification frequency
We obtained lists of guide sequences and their off-targets from studies [3, 7, 26–29] that tested 20-bp-long guide sequences. Data were extracted from supplemental files with the PDF table extraction software Tabula (http:// tabula.technology/). In the case of a study that tested both 19- and 20-bp guides [33], for consistency we used only the 20-bp guide data but included data from both cell lines (HAP1 and K562). For all studies, we obtained a measure of cleavage, the “modification frequency”, the number of all successful genome insertions or deletions divided by all observations at the respective off-target site, as reported by [7] and [29]. For a study that quantified modifications using both sequencing and lentiviral insertions [38], we did not use the low-resolution number of lentiviral insertion sites but rather the frequencies from targeted sequencing, which the authors kindly shared with us. Tsai et al. [3] measured only successful modification events, so as an approximation of modification frequency we divided reads per site by all reads obtained for one guide. Two studies [3, 28] observe only modifications, so the sum of the frequencies of a single guide is always 1.0, which is not the case for the other datasets. Frock et al. [28] did not directly quantify genomic insertions or deletions but counted the correlated events “lentiviral insertion”, which samples relatively rare cleavage events and may as a result overestimate real modification frequencies.
Previously published knock-out and cleavage efficiency datasets
The efficiency studies are summarized in Additional file 10: Table S5. We used the human knock-out efficiency dataset from Wang et al. as provided by Xu et al. [23, 38] for HL60 cells, inversing the sign, such that higher values mean a more efficient knock-out, as in the other studies. The dataset by Doench et al. [8] was used as rank-percent values as provided; we also converted parts of the raw data to log-abundance values, as described in their study, and split them by exon and cell type. For the newer dataset from Doench et al. [34], we used their Supplemental Table 16 and only the eight genes with reproducible results across the treatments (CCDC101, CUL3, HPRT1, MED12, NF1, NF2, TADA1, TADA2B) as recommended in their study. Guides that did not uniquely map to the human genome (hg19) were removed, resulting in 2333 guides. For Chari et al. [24], we used only the Streptococcus pyogenes dataset from 293 T cells, as the K562 dataset was not correlated with any score nor their 293 T results. Datasets from [6, 25, 31, 40, 42, 43] were used as provided. At first we did not obtain any significant correlation for the dataset by Housden et al. [44] and after notifying the authors and received a corrected version of their Additional file 1: Table S1. For the dataset by Hart et al. [41], we received the log-fold changes in five different cell lines and time points 8–18 days from the authors. The guides in this
Haeussler et al. Genome Biology (2016) 17:148
study were selected to have a GC content in the range 45–70 % and no T in the last 4 bp. We kept only data for 4293 guides against the 829 genes determined to be essential by the authors in all five cell lines, used the average over all time points as the assay result, and used only the result from the Hct116, library 1, replicate 1 which was the only cell line with a replicate and with a high correlation between both replicates and the focus of the original study (Additional file 10: Table S5). A very recent CRISPR library [47] was designed using the Wang score and, due to this bias, is not usable for our evaluation. All sequences without genomic coordinates were mapped with BLAT [48] to the respective genome and extended by 50 bp on both sides of the protospacer adjacent motif (PAM) to provide enough flanking sequences for the score calculations. For the Doench 2014 dataset, duplicate genomic hits were resolved manually to a single hit. For the other datasets, guides with duplicate matches were skipped. All tested guide sequences and their reported efficiencies are available in Additional file 12. New cleavage efficiency datasets
Our first cell culture dataset (“Schönig” in Additional file 14 and Additional file 10: Table S5) is a set of 24 guide sequences, three guides each from eight loci, one locus in human, five in rats, two in mice, tested with a lacZ nuclease activity assay [46]. For this purpose, the guide RNA target regions were inserted into a nuclease reporter plasmid (pTAL-Rep37) in between a partly duplicated, nonfunctional β-galactosidase gene. Upon transfection of the reporter plasmid and px330-U6based guide RNA expression vectors [49] into HeLa cells, nuclease-induced double-strand breaks stimulate the repair of the gene segments into a functional reporter gene, the activity of which is determined in cell lysates using an o-nitrophenyl-β-D-galactopyranosid (ONPG) assay. A luciferase expression vector was also added to the transfection mix and luciferase activity was measured as transfection control. Each sample activity was ranked from 1 to 3, with 3 representing strongest cleavage. The P value in the text is the probability to obtain six or more guides with an activity of 3 when randomly drawing one guide per locus and repeating the sampling 100,000 times. The second cell culture dataset (“Concordet” in Additional file 14 and Additional file 10: Table S5) was obtained from 52 guide sequences targeting 14 loci. The guides were cloned into the MLM3636 plasmid with a U6 promoter (Addgene #43860, from the KJ Joung lab), and electroporated into cells. PCR products were tested with the T7 endonuclease assay [50] and mutated sequences quantified by gel electrophoresis. The result of
Page 8 of 12
the T7 assay was reported as the numbers 1, 2, or 3 based on the mutation rate: 1, inactive guides; 2, not very active guides; 3, efficient guides (mutation rate > 10 %). In total, 26 guides from the human genome were tested in U2OS cells, 18 mouse guides in mouse embryonic fibroblast (MEF) cells, and eight rat guides in C6 cells. Our first zebrafish dataset (“Eschstruth” in Additional file 14) is a set of 18 guide sequences targeting a single locus in zebrafish. Three of the guides were selected because of their high Doench scores. We injected 20–50 pg gRNA transcribed from a T7 promoter into zebrafish onecell embryos with 300 pg Cas9 mRNA. Cleavage efficiency was measured on 16 single embryos 24 h post-fertilization with the T7 assay, a standard protocol described previously [50] and classified into three categories: no cleavage (1), low cleavage (2), and high cleavage (3). This dataset is shown in Additional file 16: Figure S6, but not Fig. 5 as it is small and the extremely high Doench scores (top 3 %) were used to select the guide sequences, so it is biased compared with the other datasets from this study, where guides were selected without using any predictions. Our second zebrafish dataset (“Shkumatava” in Additional file 14 and Additional file 10: Table S5) is a set of 103 guide sequences from 11 different loci in zebrafish. Guides were transcribed in vitro with the T7 RNA polymerase kit. No guide was selected based on efficiency scores. Guide RNA (10 pg) and 150–200 pg of Cas9 mRNA were injected into wild-type AB zebrafish at the one-cell stage. Cleavage efficiency was measured by extracting genomic DNA from around 20 embryos, PCR of the target regions, cloning the result into a TOPO-vector, and shipping for Sanger sequencing a number of colonies in the range 10–20. The result of the assay is the number of sequences with mutations over all sequences. Guides were manually assigned to a locus if they were located closer together than 3 kbp. The P value in the text is the probability to obtain at least nine successes, where a success is defined as finding at least one guide with a modification frequency among the top two values in a locus when selecting two guides randomly from each locus. The sampling was repeated 100,000 times. For our mouse in vivo dataset of 30 guides (“Teboul in vivo” in Additional file 14), single guide RNAs (sgRNAs) were synthesized using a MEGAshortscript T7 Transcription kit (Ambion). RNAs were purified using a MEGAclear kit (Ambion). RNA quality was assessed using a NanoDrop (Thermo Scientific) and by electrophoresis on 2 % agarose gel containing ethidium bromide (Fisher Scientific). Cas9 mRNA (5meC, Psi) was commercially purchased (tebu-bio, L-6125-100). Pronuclear microinjection was performed as previously described [51], employing a FemtoJet (Eppendorf ) and
Haeussler et al. Genome Biology (2016) 17:148
C57BL/6 N or C57BL/6 J embryos. Cas9 mRNA and sgRNAs were diluted and mixed in MIB to working concentrations of 100 ng/μl and 50 ng/μl each, respectively. For sessions where needles clogged up consistently, the microinjection mix was further diluted with MIB. Injected embryos were re-implanted in CD1 pseudopregnant females. Host females were allowed to litter and rear F0 progeny. Genomic DNA from F0 and F1 animals was extracted from ear clip biopsies using the DNA Extract All Reagents Kit (Applied Biosystems). The targeted region was PCR amplified using high fidelity Expand Long Range dNTPack (Roche). PCR products were further purified using a gel extraction kit (Qiagen) and analyzed by Sanger sequencing (SourceBioscience). In total, 496 embryos were tested, 160 of which were mutant. For the absolute counts of embryos for each guide, see Additional file 15: Table S7. Additional file 17: Figure S7 showns that precision/recall analysis overall gives the same resultsesults as the analysis of Spearman rank correlations. Some scores have a tendency towards higher recall (Fusi, Ren), some towards precision (Wong, Farboud -GG rule). Scoring functions
Some of the original articles did not include source code. We implemented the efficiency score by Doench et al. [8] and shared it with Doench et al., who made it available on their website. As a result, our source code has already been used in a study by Xu et al. [23] for an evaluation of the Doench score. We also had to reimplement the Moreno-Mateos score based on the description in the article [39], as the authors declined to share code. R code to calculate their scoring function was gratefully provided by Wang et al. [38]. We subtracted the result from 1.0 such that higher scores correspond to a better knock out, like all other scores. For the CRISPOR website and better performance, we had to reimplement this score. Even though we are using the same SVM library (libsvm) via scikit-learn [52], the results are slightly different (Pearson R = 0.97, 85 % of the differences are